Adverse moves in gold (GLD) like we have right now, especially after months of incessant hype, puts those who bought into the narrative on the wrong side; stunned, unable to move.
There’s a small chance, this could be a shakeout before going higher. Anything can happen.
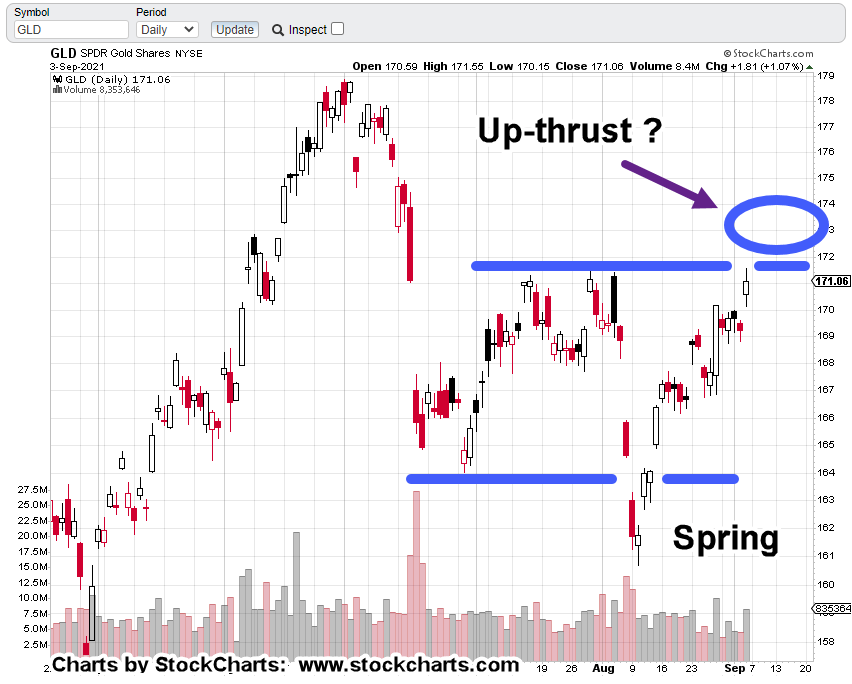
However, if we look at the chart of GLD, it’s a grim situation for the bulls.
Gold (GLD)
Daily chart, GLD:
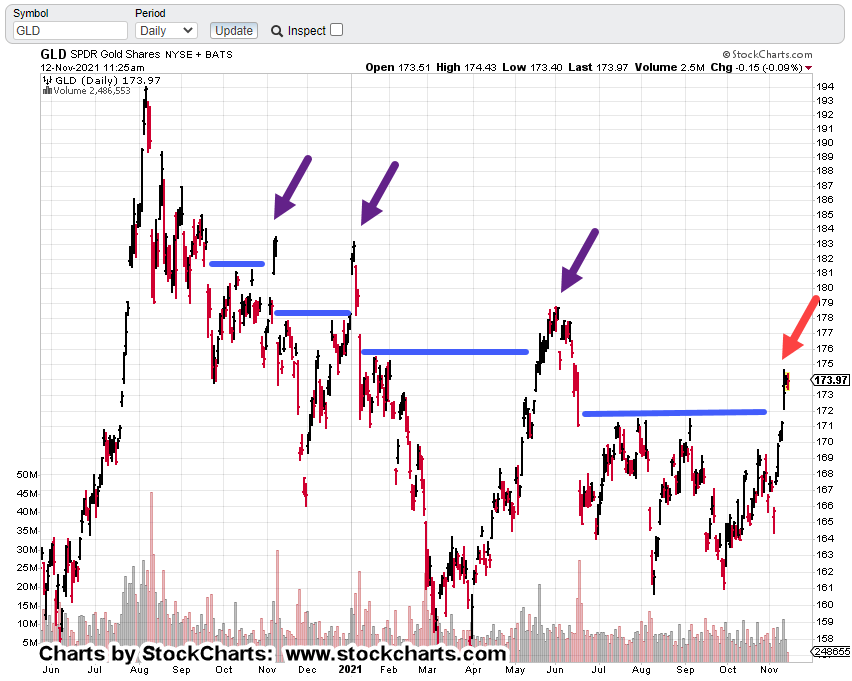
This wasn’t just a one-day push above resistance and then reversal.
GLD, spent a Fibonacci 8-Days struggling to break out before this morning’s collapse.
Stunned bulls may think it’s a buying opportunity. If so, there’s likely to be some kind of underside test of resistance.
However, that’s not guaranteed. Moves like this tend to offer no relief and just grind their way lower.
Positioning:
At this juncture, we’ve got a nasty adverse move; putting the short position (DUST) well in the green (not advice, not a recommendation).
Any upward test of GLD, and the miners, GDX, GDXJ, is likely to reveal new support/resistance boundaries and possibly trend-lines.
If so, we’ll have something to monitor for a potential exit signal.
Note: Posts on this site are for education purposes only. They provide one firm’s insight on the markets. Not investment advice. See additional disclaimer here.
This trade could still fall apart for some unknown reason.
If it looks like the bulls are somehow re-gaining control, it will show up in the price action and we’ll exit accordingly (not advice, not a recommendation).
Stay Tuned
Note: Posts on this site are for education purposes only. They provide one firm’s insight on the markets. Not investment advice. See additional disclaimer here.
The first part describes some technical details that are all true … after that, well, you decide.
Turns out, gold is going to skyrocket because of Russia !
I suppose, anything can happen.
We get fundamentals and anecdotal data as the reasoning for a Russia driven up-side breakout.
The problem with fundamentals is, they don’t work.
They never have worked.
Wyckoff discovered this a century ago when he said (from his autobiography) that ‘stocks move based on a power of their own. That power, has nothing to do with fundamentals.’
Trading genius Ed Seykota repeated that truth during his interview for ‘Market Wizards’.
He called them ‘funny mentals’ and went on to say he nearly, if not always lost money using them.
This article’s so good that I have to pay to read it.
From reading the shaded area, we can infer a similar (bullish) discussion to the first link above.
Sorry, not interested.
Summary
This time really could be different. Gold could launch into a sustained upward breakout.
However, the charts (GDX, GDXJ) at this juncture, are saying ‘not yet’.
Maintaining short (not advice, not a recommendation) via DUST … which is now in the green.
Stay Tuned
Note: Posts on this site are for education purposes only. They provide one firm’s insight on the markets. Not investment advice. See additional disclaimer here.
Now, that news is just starting to hit the mainstream.
They pretend like they’re not sure what’s it’s all about. So, let’s help them out with some facts.
Embedded within the article at this link, is an actual list of ‘strange anomalies’ that are occurring amongst the most athletically conditioned in the world.
If it’s happening with the athletes, it’s happening in the rest of the population.
Summary:
Early this session, Gold (GLD) and the miners, GDX, GDXJ have, or are testing their highs with inverse funds DUST and JDST testing the lows.
If this is a major transition from up to down for gold and the miners, this type of back and forth is normal.
Positions:
We’re still at the danger point but action can’t stay at these levels for too long. If it does, that would imply the bulls are gaining control and going to move the market to much higher levels.
Obviously, since we’re short (not advice, not a recommendation) via DUST, we’re on the other side of the gold bull trade.
A reasonable stop for DUST would be at, near, or just below yesterday’s low of 16.72 (not advice, not a recommendation).
As of this post, with DUST currently trading at DUST, 17.11, my firm’s position is down a modest – 1.82%.
Note: Posts on this site are for education purposes only. They provide one firm’s insight on the markets. Not investment advice. See additional disclaimer here.
Back in the day during the dot-com boom, fund managers were throwing in the towel (‘value’ fund managers, if memory serves) because the markets as they said, “did not make sense anymore”.
Valuations were insane and managers with decades of experience decided the time had come to exit for good.
Of course, it was a contrarian indicator. Those lofty valuations and prices were at or near their peak.
It was not long after when the market cracked. There was a rebound of sorts but the stage was set for a long bear market.
History Repeating?
This is a brief update to document two bear managers that are quitting in separate ways.
The other has exited short positions which included getting out of Tesla (TSLA) just before it rolled over.
These types of high-profile events usually happen at or near a significant top.
If the overall markets continue to grind higher, there may be similar retirements and/or fund closures.
Gold (GLD) Update
Before a market can reverse to the downside, it has to stop going up.
Sounds obvious but with the bullish hysteria on gold, coupled with non-stop inflation talk, it may take a while for the bulls to exhaust themselves.
We’re still at the danger point for GLD as well as the miners GDX, GDXJ.
Items of note for the session:
GDX had a double top (same high as Friday) and the inverse fund DUST posted + 0.01, above its own Friday low.
It could mean we’re at the extreme(s) with no more directional thrust or just a pause before continuing with the existing trend.
Stay Tuned
Note: Posts on this site are for education purposes only. They provide one firm’s insight on the markets. Not investment advice. See additional disclaimer here.
As we’ll see in the charts below, gold (GLD) has pushed above resistance three times in the past.
Each time, GLD reversed.
Two of those had GLD print new post, 8/6/20, lows.
The average decline was -11.3%.
During that time, miners GDX, GDXJ, took the brunt of the action.
The last GLD draw-down (6/1/21 – 8/10/21), was about -10.2%, while GDX got whacked top-to-bottom with -28.2%.
At this juncture, miner’s downside price action looks to be leveraged by about 3:1, when compared with gold.
Gold (GLD) Analysis:
The un-marked chart:
The marked chart has the past three up-thrusts above resistance (magenta arrows) and our current potential; the orange arrow.
Note the typical distance price action traveled above the blue line resistance levels.
If GLD does not move any higher from this point, its current distance above resistance is typical when using the past three moves for reference.
Danger Point:
In the markets, anything can happen.
Price action in GLD and miners, GDX, GDXJ are each at their own danger points.
Counter-intuitively, this is where the risk of being wrong is least (not advice, not a recommendation).
Senior Miners, GDX:
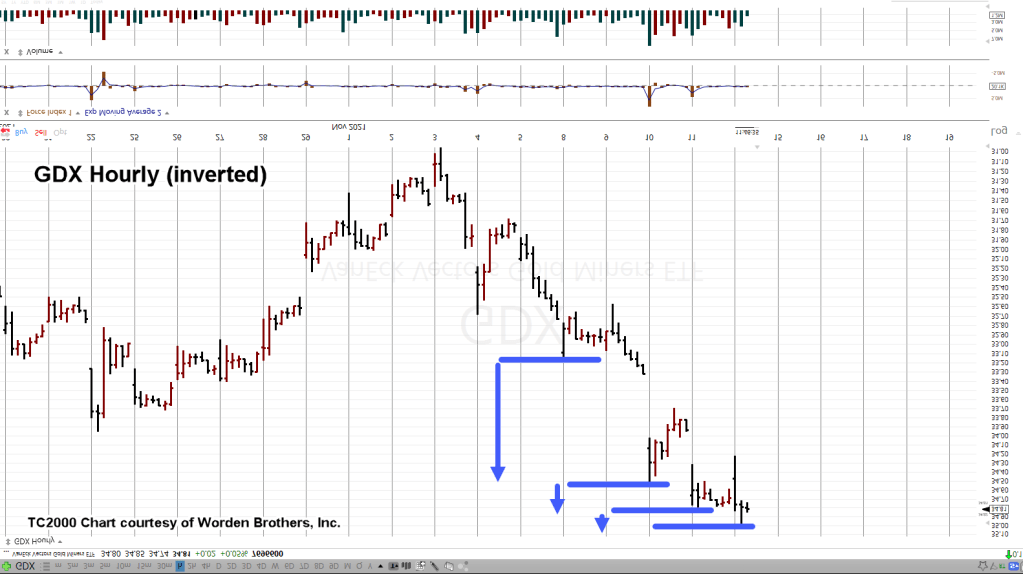
Taking the hourly chart of GDX and inverting it, gives us a chart similar to inverse fund DUST but without the tracking (bias) errors.
The inverted hourly chart:
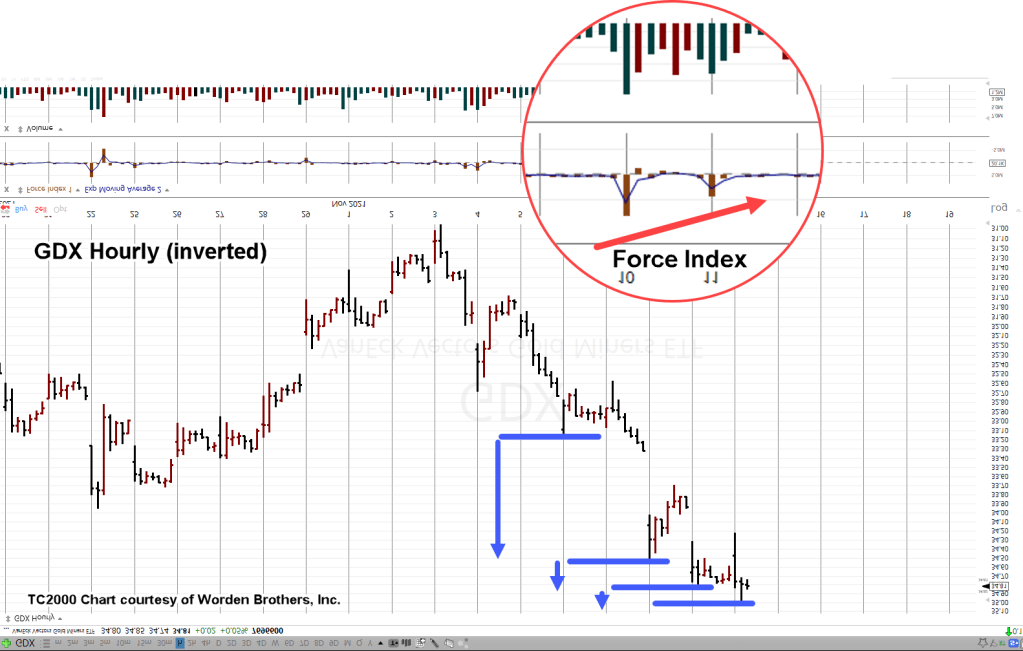
Net downward price action is narrowing; less and less downward progress with each thrust.
This is an indicator we may be nearing the end of the move.
Helping that assessment along, is the next chart. The circled area shows Force Index is also dissipating.
Today’s session thus far, has essentially no more thrust energy when compared to the last two sessions.
Summary:
Price action in DUST, has gone a little farther (lower) than desired.
However, the analysis above tells us there’s nothing, yet, that would indicate an exit of the short position (not advice, not a recommendation).
One has to remember who’s on the other side of this trade; that is, the bull side.
The general public has been led to believe inflation is rampant. The media and various YouTube personalities have whipped them into an inflation frenzy.
Its become some kind of psychosis
Costs are going higher. That part is true.
The reason they’re higher, or at least a different perspective, is available to everyone via Uneducated Economist and Steven Van Metre just to name two.
As Van Metre said about a year ago concerning the actions by the Fed (paraphrasing),
‘Do you think the Fed is going to educate the public and tell them Quantitative Easing is actually deflationary?
No, they will allow the public to have the false belief their (Fed) actions have the opposite effect.‘
Note: Posts on this site are for education purposes only. They provide one firm’s insight on the markets. Not investment advice. See additional disclaimer here.
No other major index has three consecutive quarters lower.
Even the gold miners (GDX, GDXJ), while in a bear market, still had an up quarter with the one ending June 30th, this year.
So, what does this mean?
Slow At First. Then, All At Once:
The first answer is the obvious one; the air is slowly but steadily (thus far) coming out of this sector.
The second answer is more complicated.
As discussed yesterday, we’ve seen the phenomenon of instantaneous focus shift in disparate parties … a well documented and repeated occurrence in the animal kingdom.
We could see a similar thing with biotech or the markets overall.
As Dan from I Allegedly reported yesterday, the container ship pile-up off the coast and slow unloading is intentional.
The resulting shortages are intentional.
The corresponding price rises (camouflaged as ‘inflation’ by the media), are intentional.
It’s possible (speculation) that by having prices go up and the media touting it as inflation, the public, pile into the corresponding sectors such as gold, silver and the miners … all of which have been heading lower.
More importantly, what this crowd does NOT do, is go the other direction; sell and sell short, stockpile food, water, medicine, tools, hardware, consumables, protection, backup power.
Of course, some of them are.
However, just in my neighborhood as I look around and down the street, there are fifteen houses that are visible.
I know for a fact, only two (this residence and the neighbor across the street) have been, and are, taking preparatory action: That equates to 13%.
Driving through the neighborhood to get to a main road, there are about another 40 homes.
I can see, none of them have an operation garden (or livestock) of any kind: That makes our ‘prep’ percentage go down to 3.6.%.
The real percentage (for the entire neighborhood) may be close to 0.5%, or less.
This is probably a typical number but your mileage may vary.
Instantaneous Shift:
That low percentage (0.5%), gives a clue to how vicious a down-draft could be once everyone realizes they’ve been had.
Couple that with our ‘elephant’ from yesterday, and it may be absolute insanity.
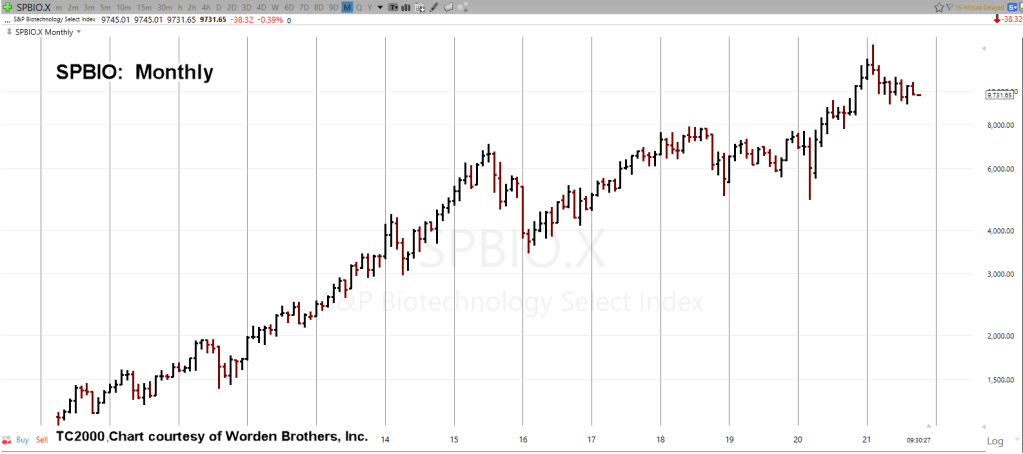
All of which, brings us to the chart of biotech (SPBIO).
SPBIO Analysis:
Not only was it a down quarter but on a monthly and weekly basis, SPBIO has posted reversal and continuation (down) bars respectively.
The unmarked monthly chart of SPBIO, is below:
The next two charts show monthly reversal bars and then a Fibonacci projection to lower levels.
The projection was taken from the all time high on February 9th, this year, to the intermediate low, May 11th; then the counter-trend pivot high on June 28th.
It’s interesting to note; the monthly reversal bars are Fibonacci 8-months apart.
Stay Tuned
Note: Posts on this site are for education purposes only. They provide one firm’s insight on the markets. Not investment advice. See additional disclaimer here.
Note: Posts on this site are for education purposes only. They provide one firm’s insight on the markets. Not investment advice. See additional disclaimer here.
Note: Posts on this site are for education purposes only. They provide one firm’s insight on the markets. Not investment advice. See additional disclaimer here.
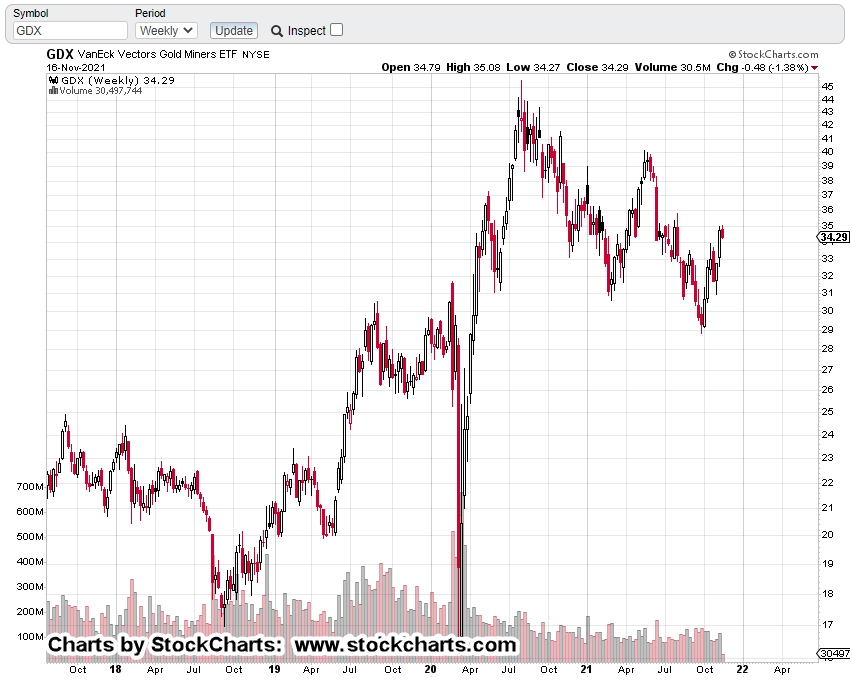
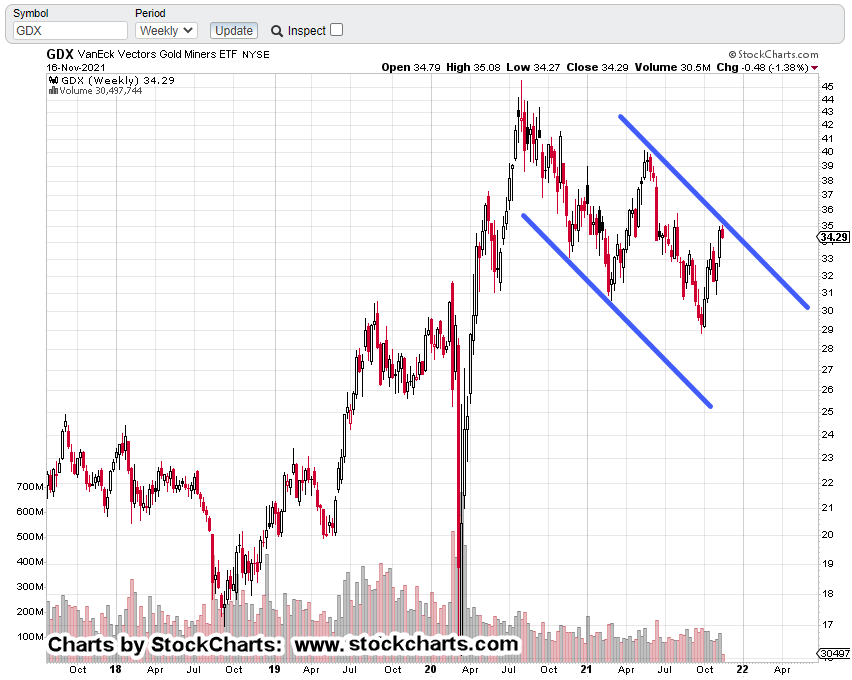
With a slight new daily high, we’re potentially at the end of the GDX rally.
It should be noted: The past two weeks of trading have stayed within the price extremes of the wide bar posted during the week of August 20th.
This is called ‘inside action’; typically signaling preparation for the next phase … whether up or down.
Note, the inverse fund DUST pushed just 0.02 points (DUST, 19.78) below our stop level (not advice, not a recommendation).
That position was elected to be maintained … we’re still short.
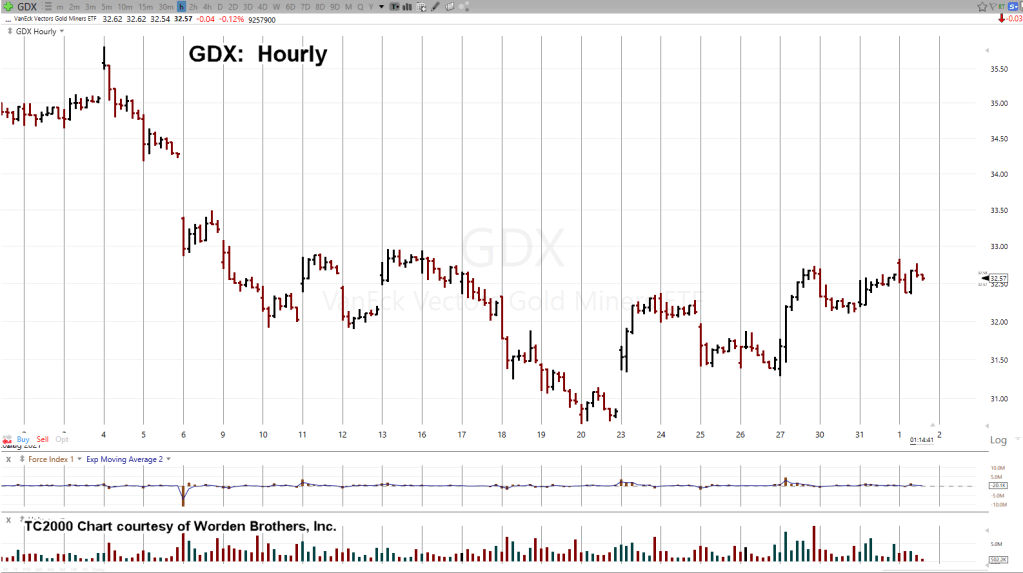
The hourly unmarked chart of GDX is below:
Next, we invert the chart to mimic the inverse fund DUST:
Now, comes the mark-up:
From Wyckoff’s writings all the way back to circa 1910, he discussed ‘shortening of the thrust’.
When net progress becomes less and less … we know we’re nearing the end of the move.
Throw into the mix the high level of resistance at the GDX 33.00, and probabilities favor the downside … upside for DUST (not advice, not a recommendation).
Stay Tuned
Note: Posts on this site are for education purposes only. They provide one firm’s insight on the markets. Not investment advice. See additional disclaimer here.