Note: Posts on this site are for education purposes only. They provide one firm’s insight on the markets. Not investment advice. See additional disclaimer here.
Looks like the silver wipeout took more than a few by surprise.
However, that’s not the real story.
Some of the comments on various YouTube ‘analysis’ sites are to the effect:
I don’t know what to believe. I don’t know what’s real.
The inference is, that silver ‘should’ have gone higher.
There was supposed to be some kind of massive breakout as we head into hyperinflation, right?
Track Record, vs. ‘Should’
Part of the reason for posts on this site is to establish a track record.
The silver analysis over the past four months is the best recent example.
That assessment never wavered; price action in SLV, is consistent with either an outright reversal, or sideways congestion (not advice, not a recommendation).
It is not consistent with a hyperinflation breakout.
Longtime visitors to this site would have least known that ‘something’s up’ with silver.
Its behavior does not fit the narrative.
Anything Can Happen
As always, the market can reverse and do something unexpected.
Price action could change character.
If so, the objective is to identify that change early, then assess opportunities (if any).
Note: Posts on this site are for education purposes only. They provide one firm’s insight on the markets. Not investment advice. See additional disclaimer here.
Especially shocking after having been subjected to non-stop delusion (now going on four months), and being ‘certain’ precious metals were headed higher.
Enough already.
Silver (SLV) is currently trading down a whopping -4.7%, in the pre-market session. Gold (GLD) is lower by about -1.2%.
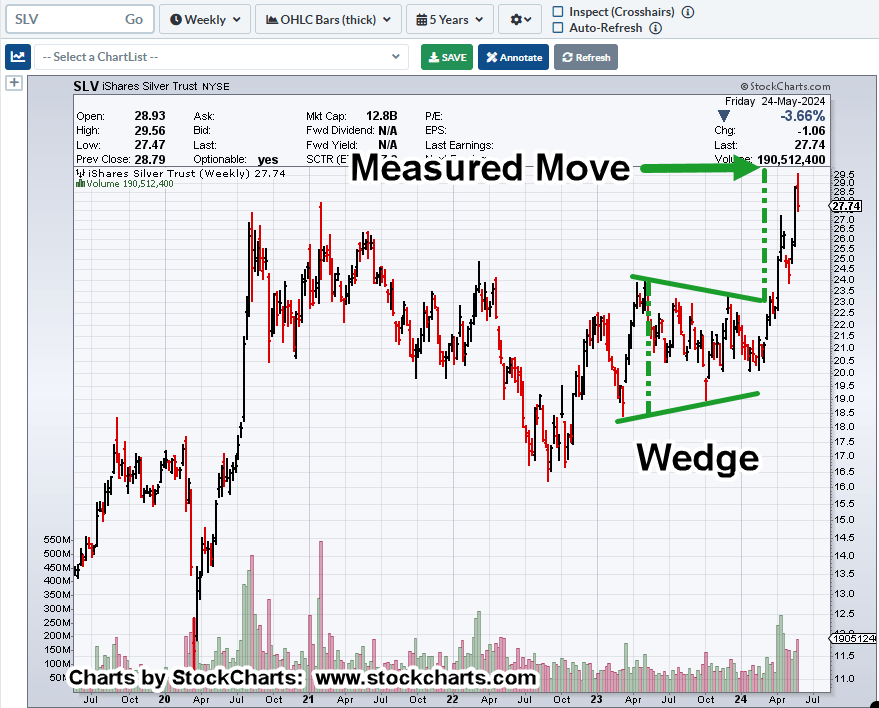
Silver analysis has been consistent; SLV, price action itself, indicates a top and reversal or at best, sideways congestion (not advice, not a recommendation)
If one wants to review, starting back in April, we have:
Now, this update essentially completes the process.
Silver, SLV, is about to open well below resistance as shown in the ‘Stalls-Out, update.
The Battle Against ‘Tik-Tok’ Brain
Fewer and fewer have a brain … like this (warning, profanity).
This guy sounds very much like the one in the ‘About‘ section. 🙂
Housekeeping: UNG, JDST
As can be inferred, a short trade via JDST, has already been opened: JDST-24-05.
Depending on today’s action, the stop listed is likely to be moved higher (not advice, not a recommendation).
Nat-Gas (UNG), on the other hand, is not behaving as expected.
The initial position UNG-24-11, was reduced by 80%, as a result of yesterday’s action. It’s likely that position will be closed out completely during this session (if not already).
Note: Posts on this site are for education purposes only. They provide one firm’s insight on the markets. Not investment advice. See additional disclaimer here.
Note: Posts on this site are for education purposes only. They provide one firm’s insight on the markets. Not investment advice. See additional disclaimer here.
Note: Posts on this site are for education purposes only. They provide one firm’s insight on the markets. Not investment advice. See additional disclaimer here.
As usual, we have the rabid gold and silver bulls, breathless; ‘This is it!’, ‘This is the big one!’, ‘Dollar collapse, imminent!’
All the while, nobody’s reporting the fact, that ever since ‘The Speck’ was introduced in 2019, and of course, Speck ‘protection‘, gold production has dropped to 2014 levels, and has not recovered (source, Statista).
Is it as simple as ‘supply and demand’? Is the ‘inflation’ narrative, just another ruse?
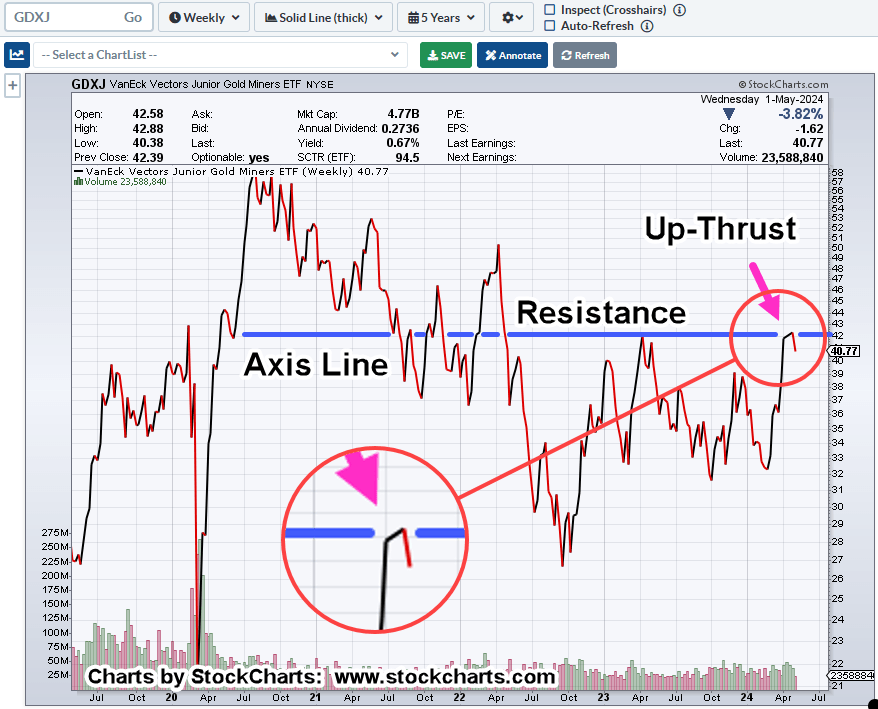
Even as gold and silver are rising (for now), the mining sector’s GDX, GDXJ, are far below their all-time highs.
As if to put icing on the cake, Newmont, appears to have reversed (not advice, not a recommendation).
Newmont Mining NEM, Daily (inverted)
Similar to recent biotech analysis, we’re inverting the chart to show the potential.
Note: This ‘inversion’ technique is a psychological exercise covered in one of Dr. Elder’s books (here and here).
It’s a basic fundamental for un-biased analysis.
Back in the day, while publishing on SeekingAlpha (a whole story in itself), users of that site would complain about charts being ‘upside down’. 🙂
Moving on, we have the following:
There’s a lot going on in this chart.
Price action has recoiled off the support (resistance non-inverted) and is now at a point where it may attempt to retrace for a test.
MACD has become successively bullish; now has a crossover signal.
As shown in prior updates here and here, the support level’s in the vicinity of the 23.6%, retrace.
That indicates bullishness on the chart above or weakness on non-inverted (not advice, not a recommendation).
Note: Posts on this site are for education purposes only. They provide one firm’s insight on the markets. Not investment advice. See additional disclaimer here.
Note: Posts on this site are for education purposes only. They provide one firm’s insight on the markets. Not investment advice. See additional disclaimer here.
Note: Posts on this site are for education purposes only. They provide one firm’s insight on the markets. Not investment advice. See additional disclaimer here.
‘…. and reminds you, she was only in it, for the money ….’ Steve Goodman
Seems like any time gold or silver blips higher, the shills come out; a new book to sell, more metals to peddle.
Obviously, what’s presented on this site, is neither; we’re searching for the truth, market truth, nothing else.
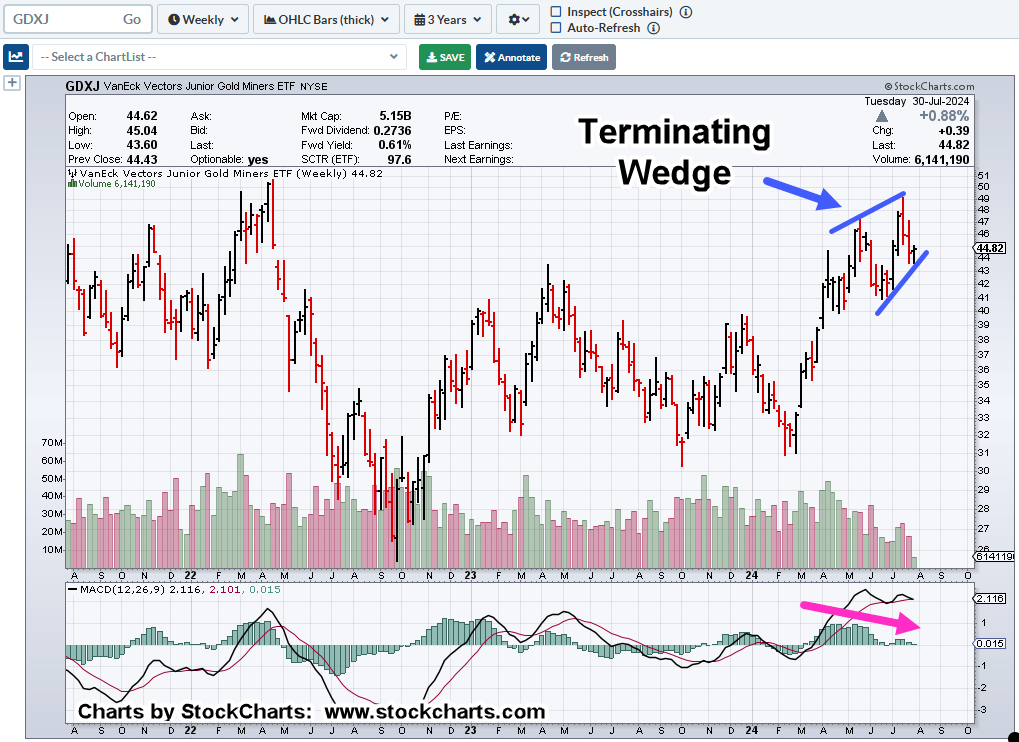
When looking at Junior Mining (ETF) Index, GDXJ, once again, it’s at The Danger Point®.
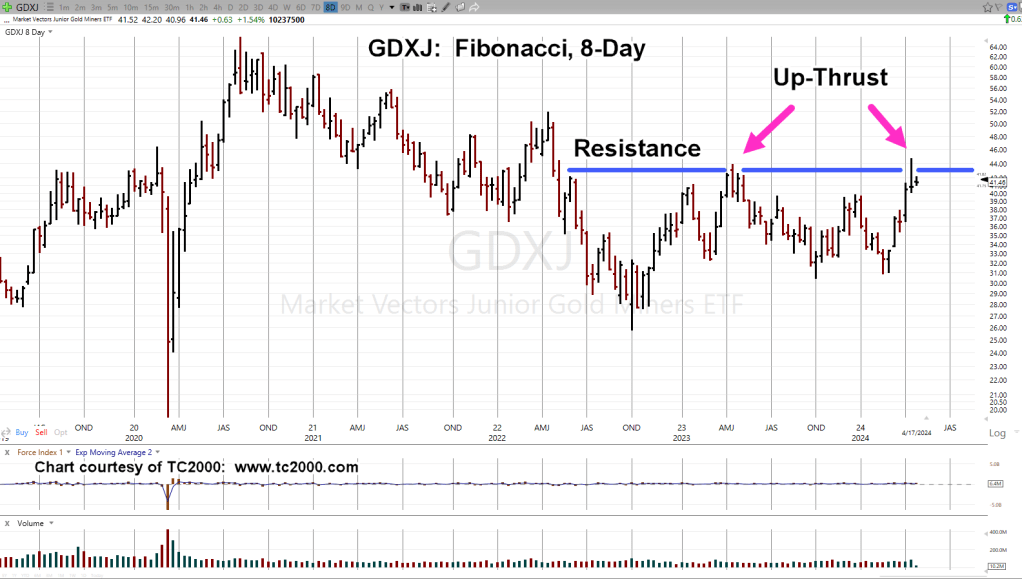
Junior Miners, GDXJ, Fibonacci 8-Day
The 8-Day chart gives us a clear view of the action.
There was an up-thrust during the week of April 14th, 2023.
Now, a Fibonacci 55 (-2) weeks later, another one during the week of April 12th.
Last Time, Is Not, This Time
The up-thrust in April ’23, resulted in a steady but choppy downside action until the bottom, February, this year.
Using Prechter’s ‘rule of alternation’, whatever happens from here, it’s not likely to be what happened last time.
So, essentially, we have two potential outcomes; strengthening with continued upside, or a swift decline back to support levels (not advice, not a recommendation).
Note: Posts on this site are for education purposes only. They provide one firm’s insight on the markets. Not investment advice. See additional disclaimer here.
It’s all quiet on the biotech front but for those paying attention, the temperature’s rising.
XBI (sector ETF), penetrated support and is now testing that breakdown.
At this juncture, anything can happen. A new lease on life, and we get a reversal higher.
However, probabilities argue against that scenario; multiple posts, here, here, here and here, present the case for significant downside (not advice, not a recommendation).
Going to the price action, we’ll use a 3-Day chart.
Biotech XBI, 3-Day
You might ask, ‘Who uses a 3-Day chart?’, ‘I don’t know anyone that does.’
Well, this may be the only place and that’s the point. 🙂
The 3-Day, for this market, at this juncture, shows support/resistance areas more clearly.
Notice on the current bar how the close (as of 3:15 p.m., EST) is below resistance, the blue line.
Then, look how the prior bar closed above the resistance area. The attempt to test this area (resistance breakout) and make it support has failed (thus far).
As a reminder, it’s the failed moves that get the attention of The Street.
Note: Posts on this site are for education purposes only. They provide one firm’s insight on the markets. Not investment advice. See additional disclaimer here.