This article, just out, is one more data-point on where the next choke-hold will be applied … literally.
If you think about it, this could be the way precious metals are made irrelevant … just long enough for the ‘stackers’ to sell it all for food.
Stay Tuned
Note: Posts on this site are for education purposes only. They provide one firm’s insight on the markets. Not investment advice. See additional disclaimer here.
As the link above says, it’s almost ‘impossible’ to substitute.
Silver goes into nearly everything electronic.
Depending on whom you believe, the mainstream says the Future’s So Bright … right?
However, the charts say we may be headed much lower.
Remember the silver ‘short-squeeze’ and the little guy putting-it to ‘The Man’?
At this point, the only silver put around is on the little guy.
The Man’s going merrily along; short the sector that was so recently hyped with gold to “$3000 In Months, Not Years”
In Steven Van Metre’s latest update, he said no fewer than three times, the Fed ‘does not print money’.
It’s a false belief (by the public) they’re not about to change.
At the end if his video, he promised a report … or to make accessible his research on how that (not printing) is so.
Bringing us to the market at hand.
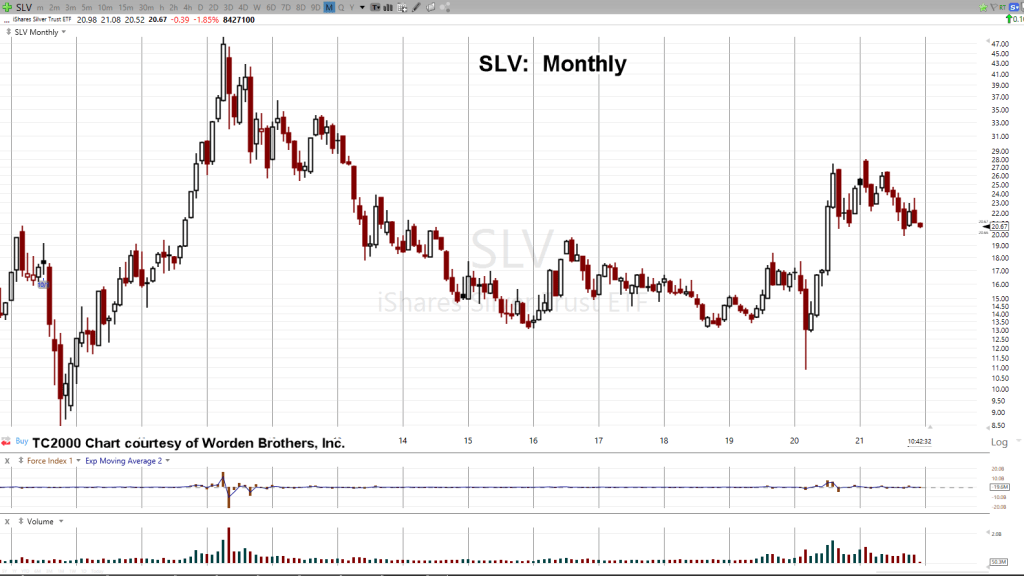
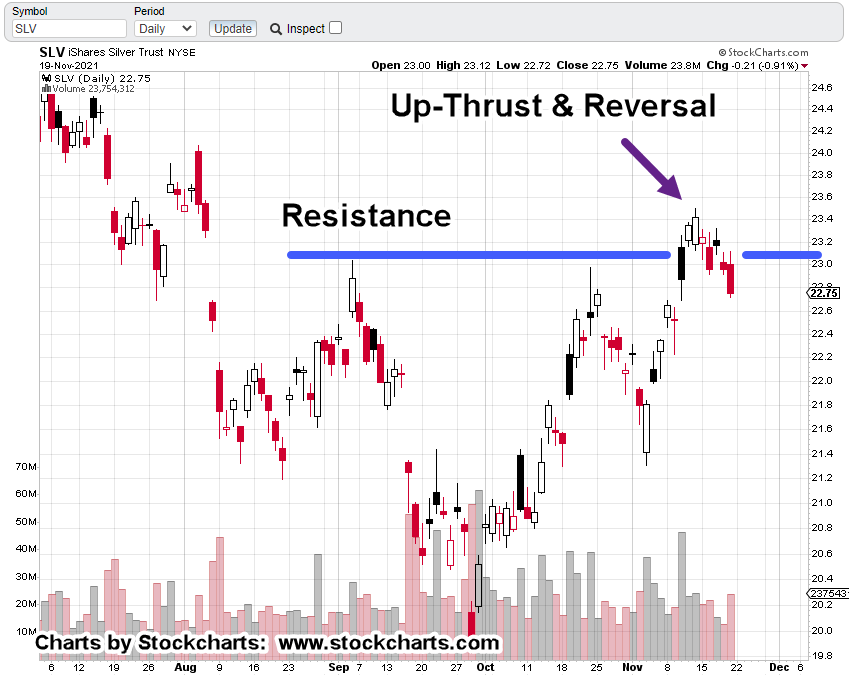
Silver (SLV)
Monthly un-marked chart.
The main thing to note above, SLV, is not at new highs.
In fact, at today’s price, SLV is down over 57%, from its all-time high set in April of 2011.
That in itself, should say there’s something wrong with the inflation, hyper-inflation, narrative.
Using a standard Fibonacci projection tool and tagging the 2011 high, the 2020 low, and the 2021, retrace high, we get the following:
It’s a little hard to see … so we’ll zoom in on the right side.
The 50%, Fibonacci projection, is somewhere between SLV: 9.00, and 9.50.
The premise for declining past 38% (around 13.70) and getting at least to 50%, is predicated on the collapse of the economy and subsequent evaporation of silver demand … at least from an industrial standpoint.
The precious metals ‘stacker’, discussed below, might become more interested in obtaining food than continuing to stockpile something that in times of famine, has very little use.
As Bjorn says in ‘famine’, come this spring, when the masses realize there will be no (or very little) food and/or you need ‘papers’ to buy food, market pandemonium (if not already) is the likely result; precious metals included.
When To ‘Stack’
So, when will be the time to acquire precious metals (not advice not a recommendation).
It’s deceptively simple; ‘When you don’t want to’.
The time to acquire an asset, is when nobody else wants it … including you.
Positioning short the gold miners GDX, was done when everybody and their dog was a manic bull; screaming an upside breakout was “imminent”.
As Prechter said, positioning opposite the herd involves overriding the limbic system of the brain.
It’s an intellectual (logic-only, thinking) process.
However, overriding the lower brain, i.e., going against the herd, is physically painful.
Excruciating, is a better description.
He went on to say, some of the best traders/speculators he ever knew, were former Marines.
Positioning
Coming up (most likely tomorrow) will be a chart showing positions opened in GDX inverse fund DUST (not advice not a recommendation).
There’s no obligation on this site’s part to reveal that information.
However, it will help explain how the market itself directed trading actions.
It will also show how the on-going reversal corrected several entry errors on my part.
Stay Tuned
Note: Posts on this site are for education purposes only. They provide one firm’s insight on the markets. Not investment advice. See additional disclaimer here.
The latest update from Steven Van Metre, has comments from the Fed that seem like they’re from another world, another time.
Evidently, the economy’s so strong … so good, that we might taper more aggressively and then … raise rates.
At this point, ‘what difference does it make?’
They’ve probably already cashed-out (like last time) and now stand on the sidelines.
Meanwhile back at the proletariat, we’re deciphering the market’s next moves … Fed press releasees notwithstanding.
Is Gold (GLD) The Black Swan ?
Frist off, there are several YouTuber’s that are providing an excellent service; letting us know the real state of the economy.
They are invaluable; thus, receiving their fair share of hate from those that don’t want to hear, see, or smell, ‘bad news’.
All of them willingly admit, they’re not experts when it comes to the markets … fair enough.
However, in Jerimiah Babe’s latest update, he may have unwittingly revealed a (or the) black swan.
Gold and the gold market.
JB’s offered the anecdote of attempting to purchase more gold at the dealer. For the first time ever, he was limited on the amount available.
From a market standpoint, the public, is all-in.
Even as we speak, gold (GLD) and the miners, GDX, GDXJ, are in a vicious downside reversal.
At this juncture, it looks like an upward test of resistance (discussed yesterday) is nowhere in the cards.
Price action for the most part, is straight down.
Which brings us to the charts.
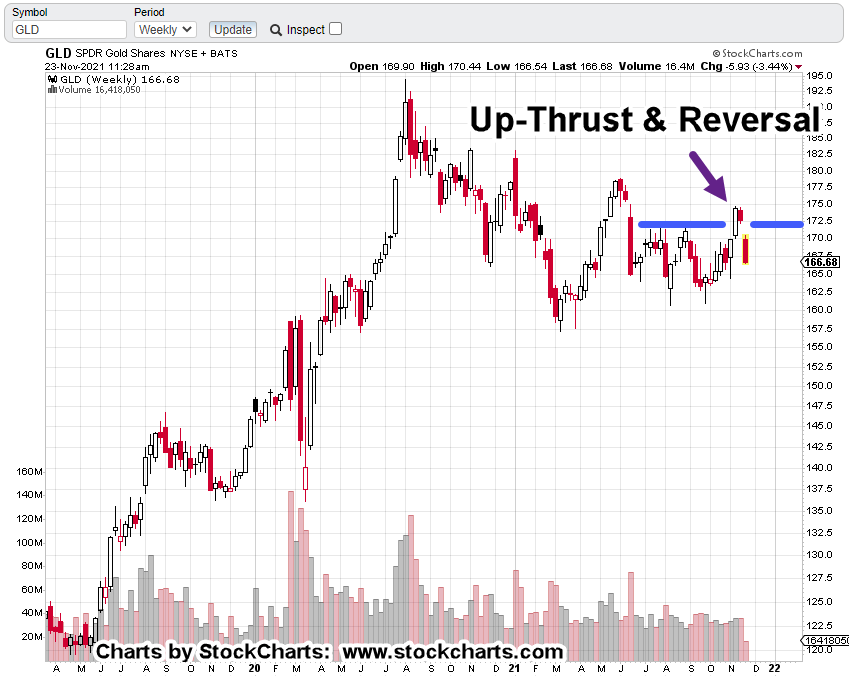
GLD, Weekly Chart:
Marked up with resistance and the up-thrust reversal.
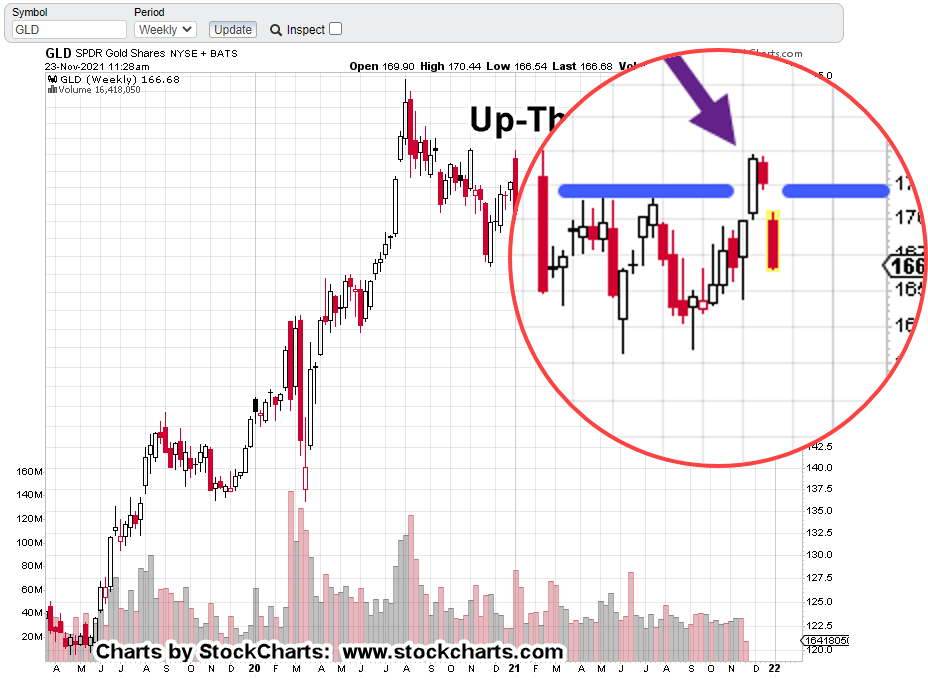
Zoomed area of the reversal
Personal Opinion:
Because the gold hype by the financial press was so incessant for so long (which by the way, has strangely ‘disappeared’), this reversal may be something that lasts much longer than anyone would expect (not advice, not a recommendation).
Downside Targets:
The weekly GLD chart below has a Fibonacci projection tool overlay.
A 161.8%, projection would take GLD down to 119 – 120.
Are the gold bulls prepared for an extended downside rout in the metals?
Summary:
Early morning food production.
It might not look like it’s connected to the markets but it is.
Market analysis presented on this site, helps steer actions needed to separate from (or reduce reliance on) the system.
Properly executed, trading is one avenue to provide income that’s necessary to eliminate the need for a corporate employer (not advice, not a recommendation).
Market analysis also helps identify what’s likely to come next.
But, I digress.
Getting back to the coop; four eggs a day … equates to over two dozen a week. Reliance on the grocery store (at least for eggs) has effectively been eliminated.
About a year’s worth of feed has been stockpiled.
Let’s put it a little differently; a year’s worth of feed has been ‘stacked’.
Personally, I like gold and silver as much as the next guy.
However, those in charge of this collapse have already stated, food will be used as the leverage weapon.
But hey, we shouldn’t have to worry about any of that, because, ‘The future’s so bright …’
Note: Posts on this site are for education purposes only. They provide one firm’s insight on the markets. Not investment advice. See additional disclaimer here.
Adverse moves in gold (GLD) like we have right now, especially after months of incessant hype, puts those who bought into the narrative on the wrong side; stunned, unable to move.
There’s a small chance, this could be a shakeout before going higher. Anything can happen.
However, if we look at the chart of GLD, it’s a grim situation for the bulls.
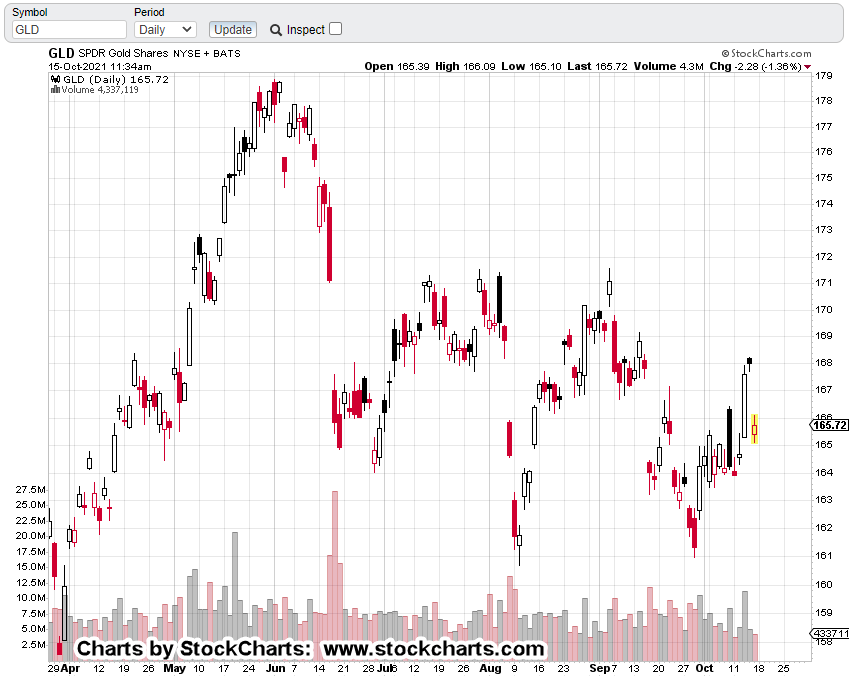
Gold (GLD)
Daily chart, GLD:
This wasn’t just a one-day push above resistance and then reversal.
GLD, spent a Fibonacci 8-Days struggling to break out before this morning’s collapse.
Stunned bulls may think it’s a buying opportunity. If so, there’s likely to be some kind of underside test of resistance.
However, that’s not guaranteed. Moves like this tend to offer no relief and just grind their way lower.
Positioning:
At this juncture, we’ve got a nasty adverse move; putting the short position (DUST) well in the green (not advice, not a recommendation).
Any upward test of GLD, and the miners, GDX, GDXJ, is likely to reveal new support/resistance boundaries and possibly trend-lines.
If so, we’ll have something to monitor for a potential exit signal.
Note: Posts on this site are for education purposes only. They provide one firm’s insight on the markets. Not investment advice. See additional disclaimer here.
Note: Posts on this site are for education purposes only. They provide one firm’s insight on the markets. Not investment advice. See additional disclaimer here.
This trade could still fall apart for some unknown reason.
If it looks like the bulls are somehow re-gaining control, it will show up in the price action and we’ll exit accordingly (not advice, not a recommendation).
Stay Tuned
Note: Posts on this site are for education purposes only. They provide one firm’s insight on the markets. Not investment advice. See additional disclaimer here.
Pre-market action in miners GDX, shows a slightly higher open with inverse fund DUST below yesterday’s low.
Is the short set-up busted?
In the markets, anything can happen but we don’t know who’s really in control … yet.
Even as the dollar powers higher, gold bulls could overpower deflationary conditions pushing gold and the mining sector up as well.
To do that, they’re going to need to overcome some significant resistance obstacles.
Let’s take a look at just a couple.
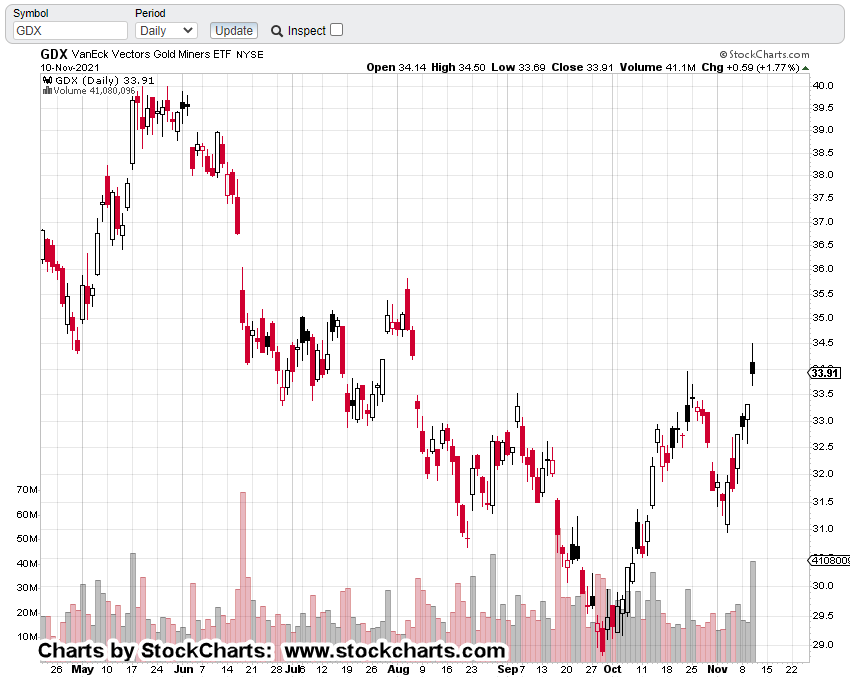
Senior Miners GDX
The un-marked chart:
The mark-up:
The mark-up shows the first two layers of resistance. The blue line is the Up-thrust (potential short) condition.
The dashed black line is not so easily discernable. It was formed way back in late July and early August.
The next two charts zoom into those areas of interest; providing evidence, getting above these levels may require a sustained effort by the bulls:
Summary:
The ‘inflation’ news is already out.
Price action in today’s session may let us know if we’re in a drawn out fight lasting day to weeks; or will the bulls reach exhaustion during the session.
Note: Posts on this site are for education purposes only. They provide one firm’s insight on the markets. Not investment advice. See additional disclaimer here.
As counter-intuitive as it sounds, for there to be a significant downside reversal in gold (GLD), the vast majority if not nearly all traders, speculators, and investors need to be on the wrong side of the trade.
Getting that crowd positioned without them realizing it, or being plain hypnotized like our asylum escapees, the gold bulls, helps get articles like this accepted by the masses.
The daily chart of gold proxy GLD, shows the potential target area for reversal.
This area has been a reversal target for months … since mid-September.
Working the markets in this way, that is, identifying a potential future condition for trend change, allows one to think about how it’s all going to go down.
Of course, consistent, incessant, propaganda along with bullish (asylum) hysteria is a must. 🙂
Just to be fair, sometimes and on a rare occasion, the crowd is right.
With that in mind, we’ll have to see how GLD price action behaves if/when it breaks through resistance.
Note: Posts on this site are for education purposes only. They provide one firm’s insight on the markets. Not investment advice. See additional disclaimer here.
The currently held belief is dollar collapse and gold to $3,000/oz.
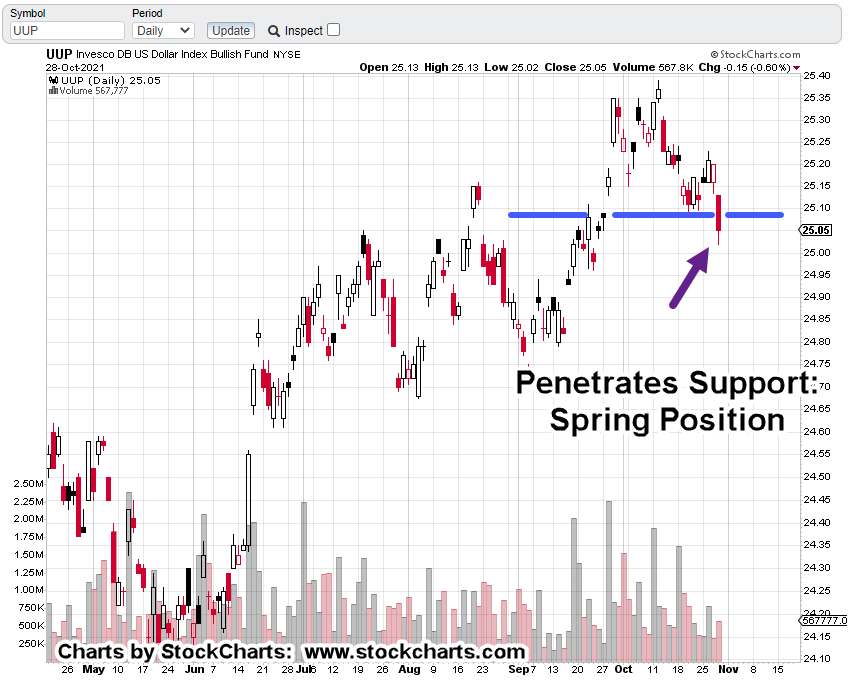
Dollar (UUP) Analysis:
The daily chart of UUP may be painting a different scenario:
The dollar’s already in an up-trend. It just established support at the 23.6%, Fibonacci level. There was a bounce higher and then yesterday, penetration below support.
Now, in the pre-market, UUP is currently trading at 25.14 – 25.16, which is at or even above the support level.
A dollar reversal higher at this point, being a very shallow 23.6% retrace thus far, would potentially spell big trouble for gold and the miners.
Note: Posts on this site are for education purposes only. They provide one firm’s insight on the markets. Not investment advice. See additional disclaimer here.
First, this morning’s action in gold (GLD) tells us, it’s not a bull market.
The asylum escapees (gold bulls) from yesterday, might paint today’s action as a buying opportunity.
Well, it could be a buying opportunity for short term trades (not advice, not a recommendation) but that’s not what this site is about.
Bull markets do not let you get aboard comfortably.
Case in point:
For those old enough to remember, harken back to the bull market launch of 1995.
Remember that?
It seemed like every day was up into new highs with nary a retracement until a year and a half later.
No, there’s something else going on with gold.
It may indeed continue to move lower from here. However, there’s a price action feel that’s not right.
GLD:
Potential Coup D’état Set-Up ?
Those who own the gold market(s) know full well, there’s a bunch of rabid ‘collapse’ types who believe the metal’s their salvation ticket out of events to come.
Those in control, need to get as many as possible on the wrong side of the trade before there can be a sustained long-term (or fast and sharp) down move.
Such a move, if it goes low enough and fast enough, would likely take out the majority of the ‘stacking’ community.
Looking at the un-marked chart of gold (GLD), just where would that location be … where everyone, except the few, are positioned incorrectly?
As discussed previously, the area shown below would be a good location for an up-thrust (reversal) condition.
In addition, that location’s between the 38% and 50%, retrace level(s) from August 2020, to March 2021.
One can speculate on just what would cause or enable a last-gasp push higher above the GLD 171, level.
Well, for starters, how about a massive volcanic eruption that results in long-term destruction on both sides of the Atlantic.
As Dan (I Allegedly) says with his post just out, ‘the economy is in a perfect storm’.
Note: Posts on this site are for education purposes only. They provide one firm’s insight on the markets. Not investment advice. See additional disclaimer here.