Gold Bulls … What Happened ?

Last Week, It All Looked So Good

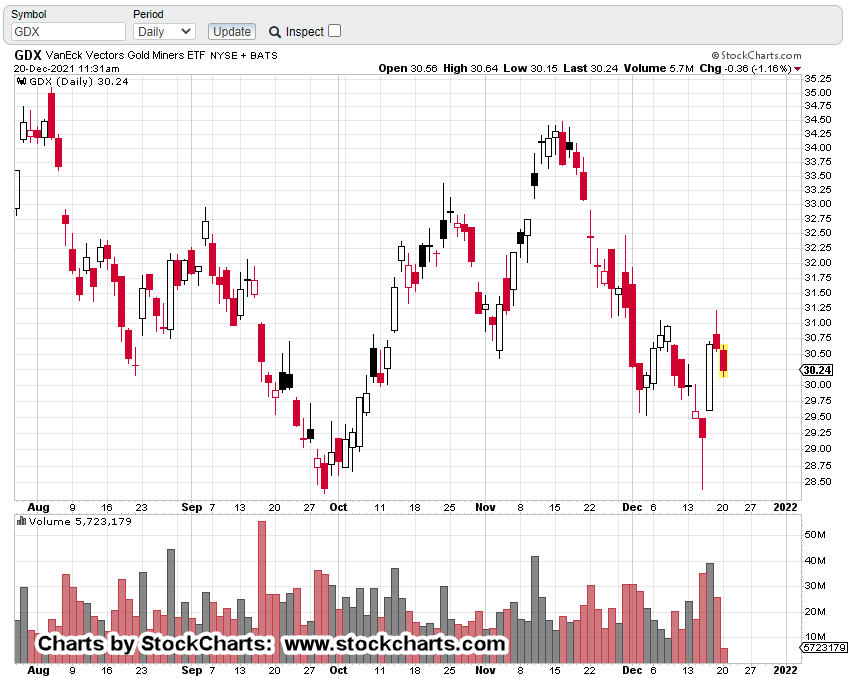
Dazed and confused has got to be the current state of the gold bulls.

Just when things look like they’re getting underway to the upside, there’s another whack lower.

This morning’s action was no exception.

Before anyone starts screaming “manipulation”, the potential for this reversal (i.e., ‘the first correction’) has been discussed on this site for weeks.

Just yesterday was this:

However, the most likely outcome at this point, is the market pivots straightaway or hesitates for several days; just long enough for both sides (bulls/bears) to start scratching their heads.

Well, “straightaway”, it is.

Yesterday’s update, also ended with this:

“Next up, scheduled for tomorrow and depending on price action, we’ll discuss how the upward retrace in GLD, may actually be a test of the mid-November up-thrust“.

And a test it is … bringing us to the chart at hand, GLD

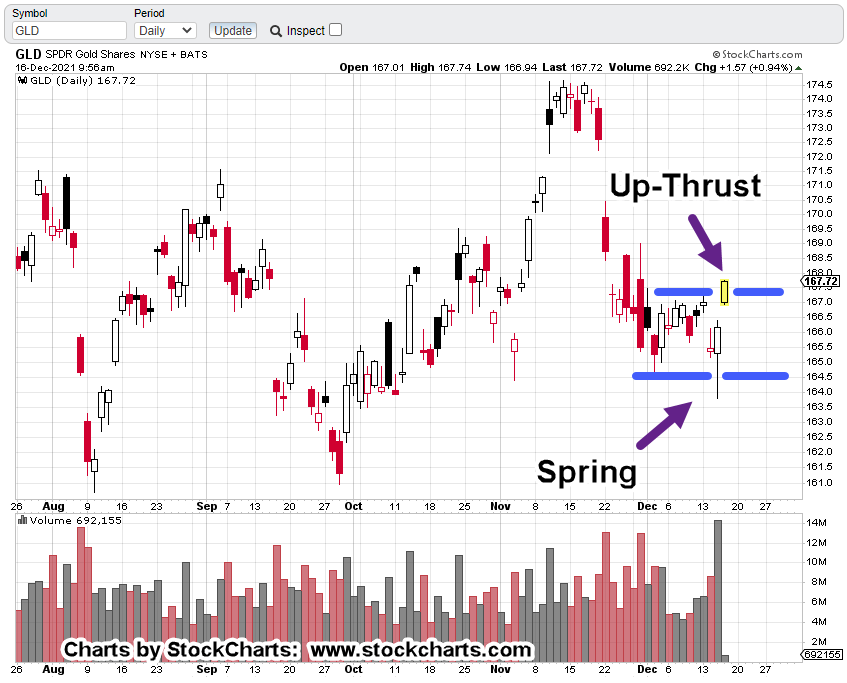
Gold, (GLD) Daily Chart

The un-marked chart.
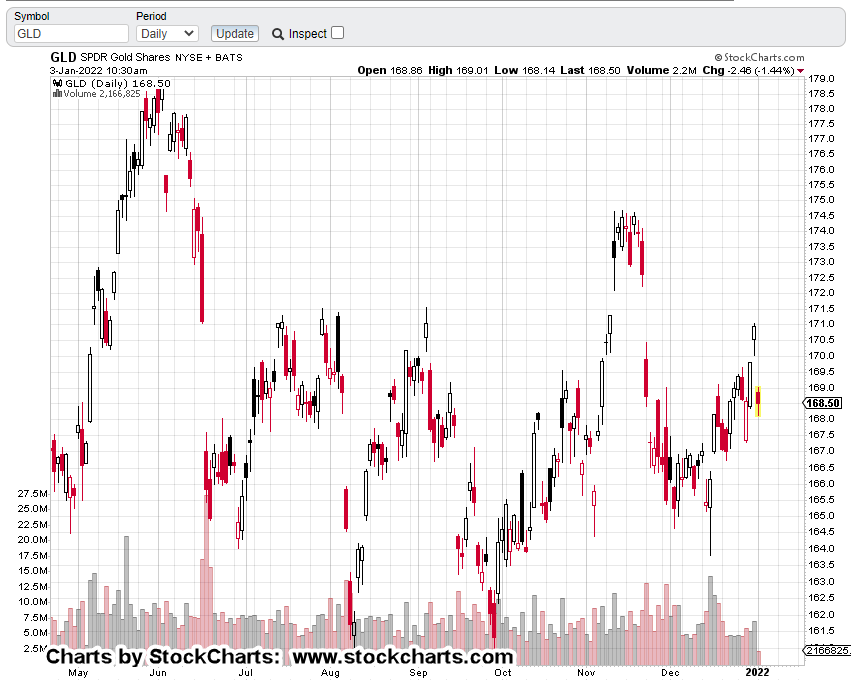
We’re going to keep the chart ‘as-is’ this time and not invert.

Mark-ups are added showing the extent of the set-up; that last Friday, including Sunday’s overnight futures, were a test of the up-thrust:

It’s A Big Move

We’re looking at price action that took over four months to create a set-up (mid-November up-thrust).

Then, price action posted for nearly two weeks within the set-up before collapsing on November 22nd, last year.

Remember there was absolutely insane gold bull hysteria during that time … a very important nuance.

Now, we’ve got what looks to be nearly six weeks of testing that culminated last Friday (and Sunday, overnight).

If that weren’t enough, over those six weeks, the Senior Miners, GDX, has thinned-out. Thinning-out typically occurs at the very last stages of a directional move.

Summary:

As stated yesterday, if we got a downside pivot in GDX (DUST moving higher), the market may allow an opportunity to re-establish the original position size … maybe more.

At this juncture (mid-session), it’s doing just that.

Early this session, the DUST position was increased by about 3.2% (not advice, not a recommendation).

Channels & Trendlines:

Scheduled for tomorrow, is a discussion on what to expect on a go forward basis.

Will action confirm a potential right-side trend or begin to move deeper into the trading channel identified in a previous post.

Stay Tuned

Charts by StockCharts

Note:  Posts on this site are for education purposes only.  They provide one firm’s insight on the markets.  Not investment advice.  See additional disclaimer here.

The Danger Point®, trade mark: No. 6,505,279
Fibonacci Fingerprint

Senior Miners GDX

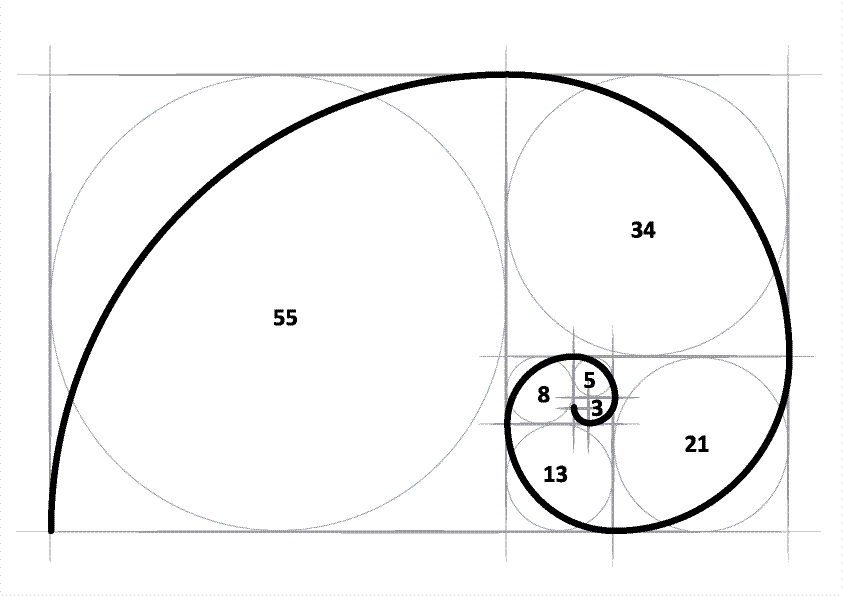
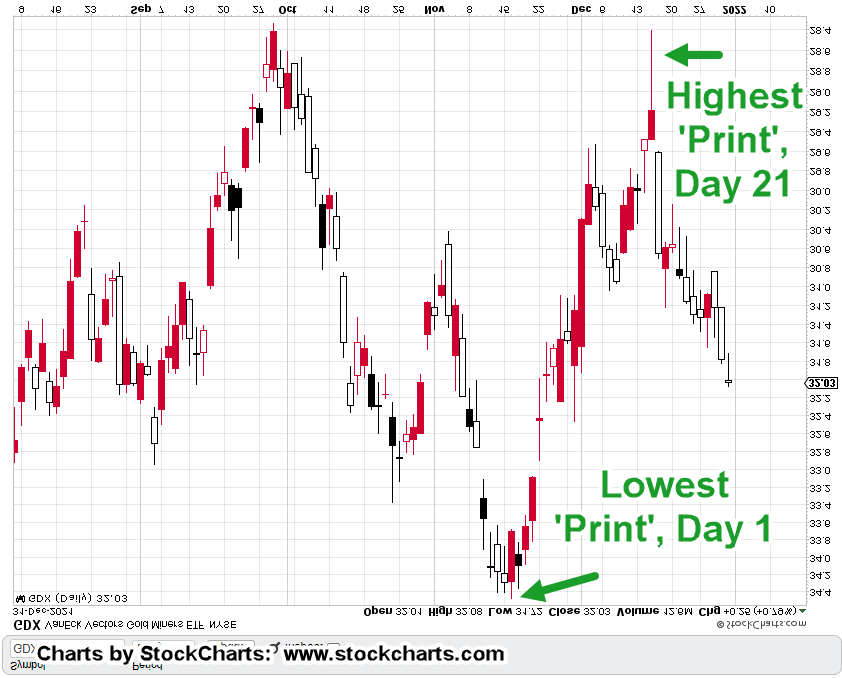
With mixed signals, confusion in the economy and markets, one has to wonder if anybody’s noticed the Fibonacci sequence in Senior Miners, GDX?

As soon as such things get ‘figured out’, time correlations diffuse and evaporate; just long enough to throw off attention and re-emerge at some distant date.

However, as yesterday’s update inferred, along with a compelling trading channel, it begs the question; is this juggernaut so big that even if it’s ‘discovered’, it won’t make a difference?

Of course, the market itself is the final arbiter.

However, the coming week may prove to be interesting. If the time correlation remains intact, expectations (shown below) are for GDX to pivot lower early in the week.

Senior Miners: GDX

We’ll start with the un-market daily chart of GDX and then invert (to approximate DUST) for the subsequent analysis.

Now, inverted

The first Fibonacci sequence, ‘Day 1 – Day 34’, defines the channel width (shown in this update) and the subsequent retrace to the December 15th, apex/reversal; Day 55.

The next chart shows that embedded within the sequence above, is another sequence; from the November 16th low, (inverted chart) to the same December 15th, top.

Putting both together, we have the following.

However, that’s not all.

The time to retrace from December 15th to Friday’s close is/was 12-days … just one day short of a Fibonacci 13.

Is the market going to ‘blip’ this Monday, print a new low (on the inverted) just to make it absolutely perfect or is the whole set-up going to fall apart?

Either one can happen.

However, the most likely outcome at this point, is the market pivots straightaway or hesitates for several days; just long enough for both sides (bulls/bears) to start scratching their heads.

Summary

We’re still short this sector, identified as trade number DUST-21-01, (not advice not a recommendation) but the actual position size has been reduced.

‘Reduced’ is not the same as ‘closed’.

The reduction in size, which was about 8.8%, of the total position, was entirely the result of maintaining margin requirements.

If the trade falls apart, obviously the correct action would be to close.

However, if GDX pivots to the downside (as expected), there may be a window of time allowing position size to be increased back to the original or more if the market allows (not advice, not a recommendation).

Gold (GLD): Testing The Up-Thrust

Next up, scheduled for tomorrow and depending on price action, we’ll discuss how the upward retrace in GLD, may actually be a test of the mid-November up-thrust.

Stay Tuned

Charts by StockCharts

Note:  Posts on this site are for education purposes only.  They provide one firm’s insight on the markets.  Not investment advice.  See additional disclaimer here.

The Danger Point®, trade mark: No. 6,505,279


Time Tunnel … GDX

Rendezvous With The Future?

Are gold and the miners destined to collapse?

Are the miners on some choreographed mission to take out themselves, the gold bulls, and ‘stackers’ in one fell swoop?

At the bottom (if there is a bottom) will Newmont, be the sole-survivor or will some other mining entity emerge as the next leader?

Year 2022: When It All Hits

As Bjorn Bull-Hansen has suggested in this post, we’re potentially just months (maybe weeks) away from a mass-awakening.

That is, there’s no, or very little food.

What food there is, seems to get mysteriously wiped-out by some never-before-seen weather event.

It turns out that precious metals and the grains, i.e., wheat, soybean, and corn are at this juncture, inversely correlated.

Gold & Grains: Inverse Correlation

What kind of nonsense is this?

I thought we were supposed to be in a hyper-inflation event. I mean, the financial press is aghast about it. The YouTuber’s have jumped on and provided their own non-thinking “me too” assessment.

How can it possibly be any different?

The official narrative has been sanctioned by the press and YouTuber’s alike. It’s a consensus!!!

Let’s put it this way, if your (or my) favorite YouTuber is not being harassed, shut down or otherwise ‘cancelled’, are they really offering any useful information?

So, what gives?

How can gold, precious metals and the miners be inversely correlated with grains and/or corn?

Well, ok. Let’s take a look.

Below is an un-marked daily chart of gold proxy, GLD.

Can you pick out the ‘Derecho of 2020?

Let’s put in a big arrow showing when that crop-destroying inland hurricane (just before harvest … how convenient) showed up:

Below is a daily chart of tracking fund CORN; showing the correlation.

The markets in corn and gold never looked back.

Now we have this report from ice age farmer, just out. Trucking shipments between U.S. and Canada could be reduced by 15% or more.

As a result, food shipments are likely to be impacted starting this month.

Sustainable, Self-Implosion

If the negative correlation between gold and the grains wasn’t enough, we also have the controlled demolition of ‘sustainability‘ being put in place as well.

Tony Heller was part of the YouTube purge a few years back. He wound up being one of the first major hitters moving to NewTube.

Sporting no fewer than five science degrees … one of them being Master of Electrical Engineering from Rice University, he has systematically dismantled the propaganda and cult of climate change.

As with our second link above (repeated here) the only climate change of note, is the one being sprayed in. 🙂

So, most if not all major corporations are implementing plans, that by definition (unless reversed) will ultimately result in their own collapse.

After all, if you’re implementing plans and actions to address something that’s not there, what are you doing about any real tangible problems in the company?

Back to the topic at hand.

Senior Miners, GDX.

As stated in the first paragraphs above, GDX seems to be on some kind of time-tunnel mission.

Yesterday, it was shown how GDX is in a huge trading channel … with Friday’s price action potentially confirming the right side.

Next up, scheduled for tomorrow are specific and repeating Fibonacci time correlations between GDX inflection points and channel widths.

Stay Tuned

Charts by StockCharts

Note:  Posts on this site are for education purposes only.  They provide one firm’s insight on the markets.  Not investment advice.  See additional disclaimer here.

The Danger Point®, trade mark: No. 6,505,279

Newmont: Textbook Test

Is It Too Perfect ?

NEM: Daily Close

‘If on the next retrace, volume contracts ….’

That’s the training given by the late David Wies years ago concerning springs and up-thrusts.

His inference, if the volume contracts on the pull-back, the set-up has been tested; resumption of the reversal (up or down) is now expected to continue in earnest.

More analysis to follow but that’s where Newmont looks to be at this juncture.

Both gold (GLD), Newmont (NEM), and the miners (GDX), are at the danger point.

At this juncture, price action distance to trade failure or continued sucess is quite small (not advice, not a recommendation).

Stay Tuned

Charts by StockCharts

Note:  Posts on this site are for education purposes only.  They provide one firm’s insight on the markets.  Not investment advice.  See additional disclaimer here.

The Danger Point®, trade mark: No. 6,505,279

Gold Bulls … Trapped, Again ???

Turn The Screws

Thumbscrew

Having been on the wrong side of major moves numerous times, I have first-hand experience on what’s likely to happen next.

If the bulls are trapped for a second time, those in control, the bears, are going to put the screws to those on the wrong side (not advice, not a recommendation).

It could be a straightforward downward thrust or a slow capital draining grind.

We won’t know how bad it’s going to be (for them) until it’s over; Keeping in mind at all times, anything can happen.

Rule Of Alternation

Yesterday’s update said the following:

“Price action permitting, we’ll discuss how this first correction may be a brief one as opposed to a drawn-out choppy affair.”

Price action in GDX, has posted a new daily low (below last Friday’s low); a potential indication we could be starting the next leg lower.

The basis of that assessment is from a technical discussion published by Robert Prechter, Jr., in the early 2000s (’02, ’03, if memory serves) as ‘the rule of alternation’.

Basically, what happened last time, won’t happen this time.

Senior Miners, GDX

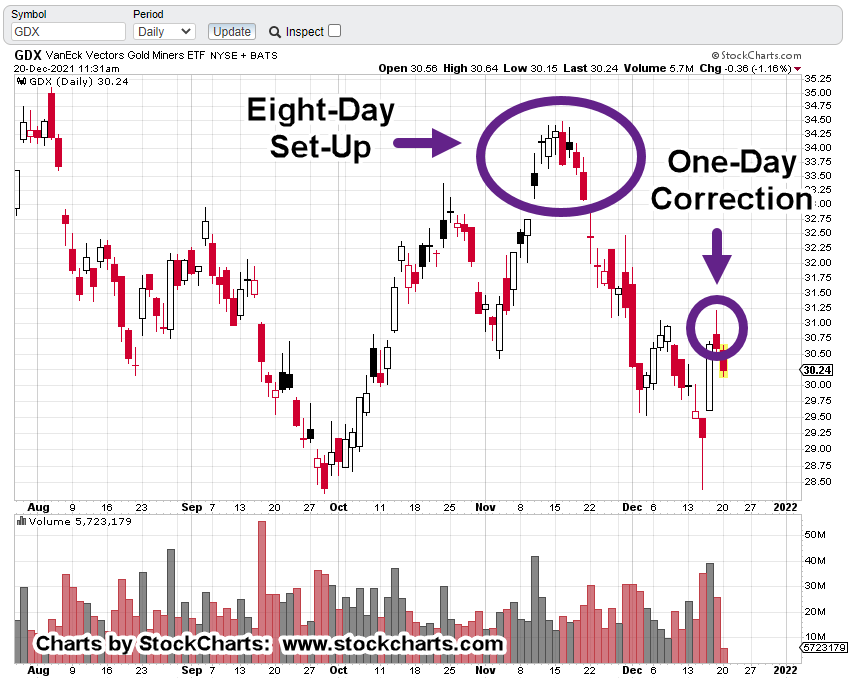
The daily chart shows the eight-day up-thrust, along with current action.

The mark-up makes it clear

It was eight days above resistance battling it out between bulls and bears.

Now, we’ve had one day above resistance (level posted on, 12/7) followed by a new daily low.

Correction Complete ?

The following (DUST-21-01), is the trade sequence currently being used.

Based on the above analysis, we’re going to tentatively call ‘The first correction’ as complete (not advice, not a recommendation).

Trade: DUST-21-01

  1. The Set-Up: Complete
  2. The ‘test’ or ‘gut-check’: Complete
  3. The first ‘correction’: Complete
  4. Continuation or Failure
    1. Trend identification
    2. Potential channel(s)
  5. Exit process
    1. Scale out
    2. Full exit
  6. Post trade evaluation

Looking For The Trend

Next up in the trade sequence, is identification of a trend or trends … if any.

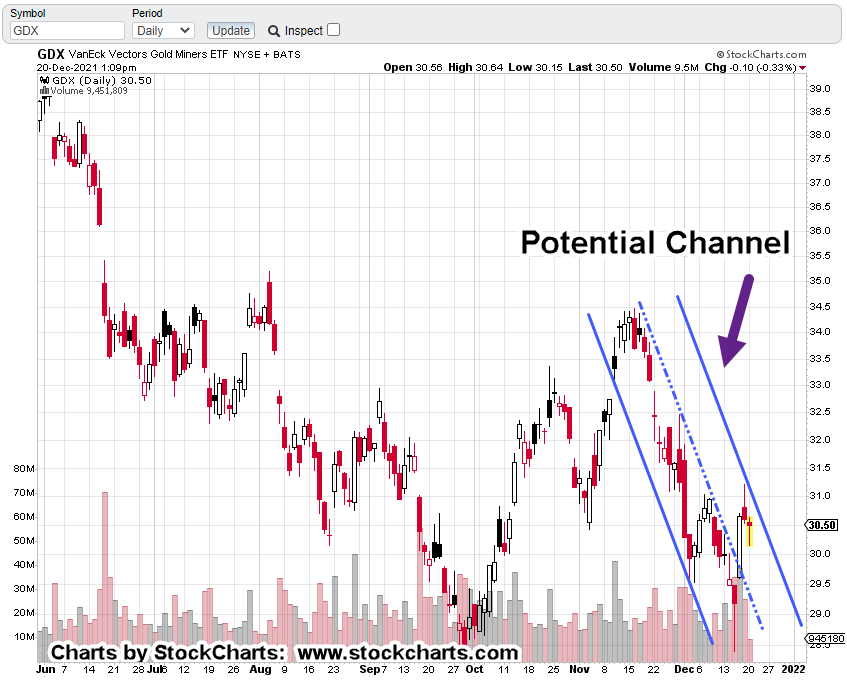
For now, we have the potential channel shown below.

Now comes the part most traders/speculators find difficult; That is, wait.

As Livermore said in Reminiscences, (paraphrasing): ‘It wasn’t the thinking that made me money … it was the waiting’ (not advice, not a recommendation).

Stay Tuned

Charts by StockCharts

Note:  Posts on this site are for education purposes only.  They provide one firm’s insight on the markets.  Not investment advice.  See additional disclaimer here.

The Danger Point®, trade mark: No. 6,505,279
Gold Natives … Getting Restless

Latest Reversal … Exposes The ‘Experts’

When the tide goes out, that’s when you find out who’s been swimming naked.’

No fan, and no endorsement of Buffett but the quote is applicable.

If yesterday’s Newmont analysis holds, meaning, it’s the last stand before another leg-lower, gold bulls might start acting irrationally.

Is it even possible to be more irrational?

Remember their manic prediction of $3,000/oz, gold in months, not years?

Barring a major reversal, the tide’s going out.

From the comments section of this ZeroHedge article, some in the herd are figuring it out as well.

As one of them says … ‘another year to wait before the Great Pumpkin’ (i.e., gold moving higher).

As this post is created, comments continue to pour-in.

Gold bulls are frustrated, confused, pontificating, crypto loving/hating, central bank blaming, it’s all there.

Thus far, there’s not one comment on what price action is actually doing.

Public Service Announcement

This whole business with the financial media and its attendant hucksters (recent examples, here and here) is actually a fantastic public service.

For anyone who’s still able to think (an act of rebellion in itself), it’s clear, or should be, if you’re on TV, or the mainstream media, you’re a shill until proven otherwise.

The good part?

All of this media, podcast, carpetbagging and corruption, plays right into the hand of Wyckoff analysis.

Wyckoff focused on what is … not what should be.

Even back in the early 1930s, he was adamant about ignoring the financial press. ‘You’ll never be successful’, he said if you listen to the hype.

Mixed Messages

On cue to support that statement, is Dan, from i-Allegedly; he reports ‘we’re getting mixed messages‘ in the economy.

Proving the point.

The (Trade) Plan Forward

With the caveat, anything can happen; gold could rally in a couple hours when the futures open, the short via DUST (not advice, not a recommendation), is as follows:

  1. The Set-Up: Complete
  2. The ‘test’ or ‘gut-check’: Complete
  3. The first ‘correction’: On-going
  4. Continuation or Failure
    1. Trend identification
    2. Potential channel(s)
  5. Exit process
    1. Scale out
    2. Full exit
  6. Post trade evaluation

What’s In A Name ?

Even if the trade fails at the next session, it would still provide valuable information.

With that in mind, no matter what happens it’s likely to be referenced in the future; so, it needs a name (or number).

Taking a cue from prior engineering work (creating numbering schemes), the current trade will be identified now, and in future posts, as: DUST-21-01.

Seems straightforward.

The ‘First’ Correction

No. 3, above is titled ‘The first correction’.

This labeling is borrowed from a trade discussed by William Doane, in Dr. Elder’s book: Entries & Exits.

Price action permitting, we’ll discuss how this first correction may be a brief one as opposed to a drawn-out choppy affair.

Stay Tuned

Note:  Posts on this site are for education purposes only.  They provide one firm’s insight on the markets.  Not investment advice.  See additional disclaimer here.

The Danger Point®, trade mark: No. 6,505,279

Newmont Holds The Key

‘Last Man Standing’

Founded by William Boyce Thompson in 1916, Newmont (NEM) was around over a century ago during Livermore and Wyckoff’s day.

Thompson is center in the photo with President, Warren G. Harding at left.

Wyckoff and Thompson were interconnected.

In Wyckoff’s autobiography, he writes about working for Thompson’s firm (Thompson, Towle & Co.) in 1910.

During that time, he describes no fewer than two stock ‘manipulation’ schemes; one by renowned James R. Keene and the other by Thompson himself during a deal-gone-bad with the Guggenheims.

Also in 1910, Wyckoff published his seminal work: Studies In Tape Reading. If there’s any one book to read concerning how markets work, ‘Studies ..’ is that book.

Wyckoff had first-hand exposure into market operations by the wealthy and super wealthy. More importantly, he saw how those transactions showed themselves on the tape.

Last check, a first edition ‘Studies’ went for around $3,500. A quick search as of this post, turns up nothing currently available.

For those who complain ‘it’s rigged’, to that we can say, ‘it’s always been rigged’.

Determine what those ‘rigging’, are trying to accomplish and you may have a trade.

Now, to the market at hand: Newmont Mining.

It’s the key; the largest cap equity in the Senior Mining Index (GDX).

Newmont, NEM

The daily chart:

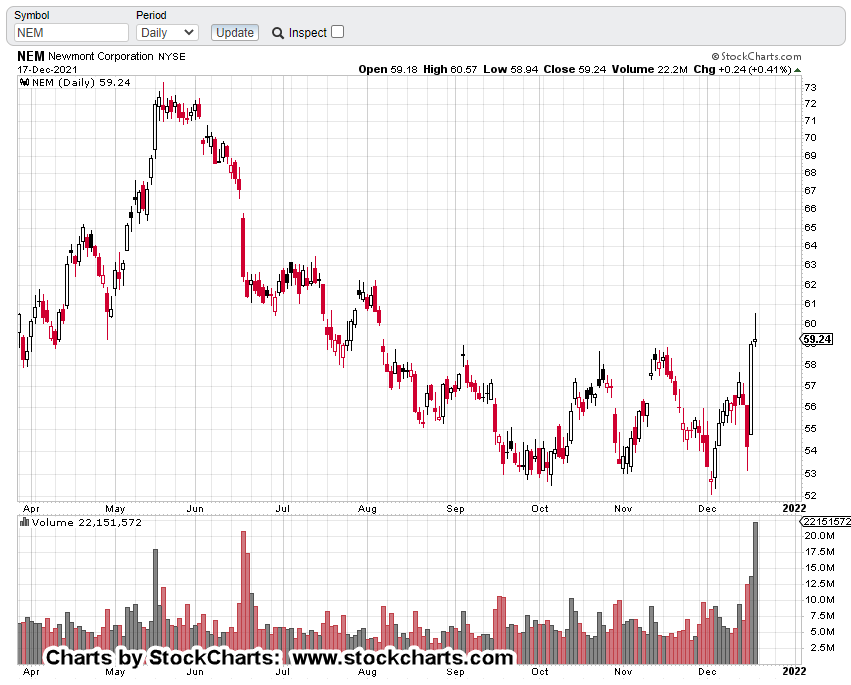
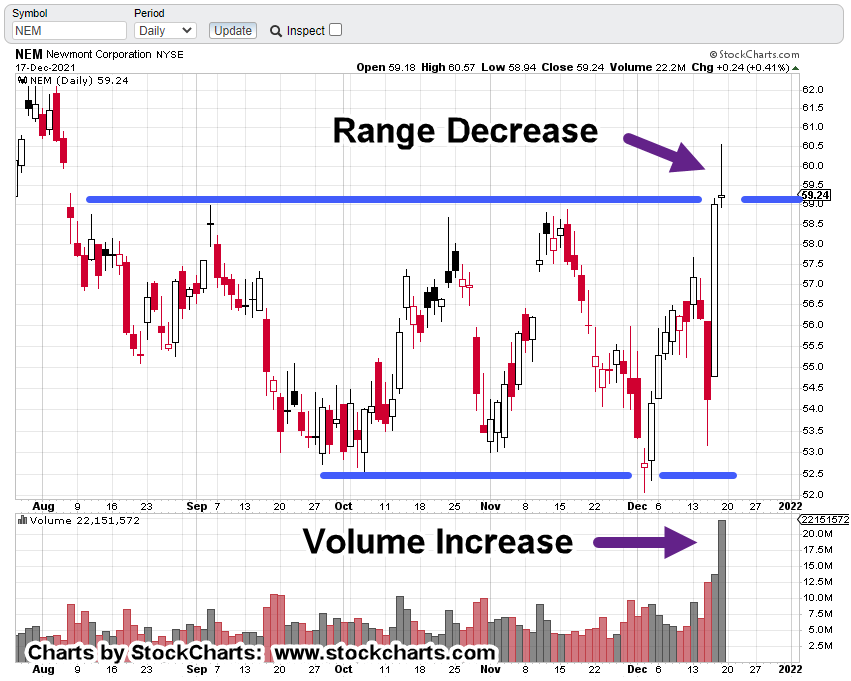
For those who have been with this site for a while, you may instantly see the set-up: Spring to Up-Thrust.

The marked-up chart makes it clear.

Moving in a little closer for additional clues:

We can see from the volume itself, there were a huge number of transactions this past Friday.

NEM penetrated long established resistance.

In so doing, it set off a massive number of orders: Buy orders, sell orders, sell-short.

Senior Mining Index: GDX

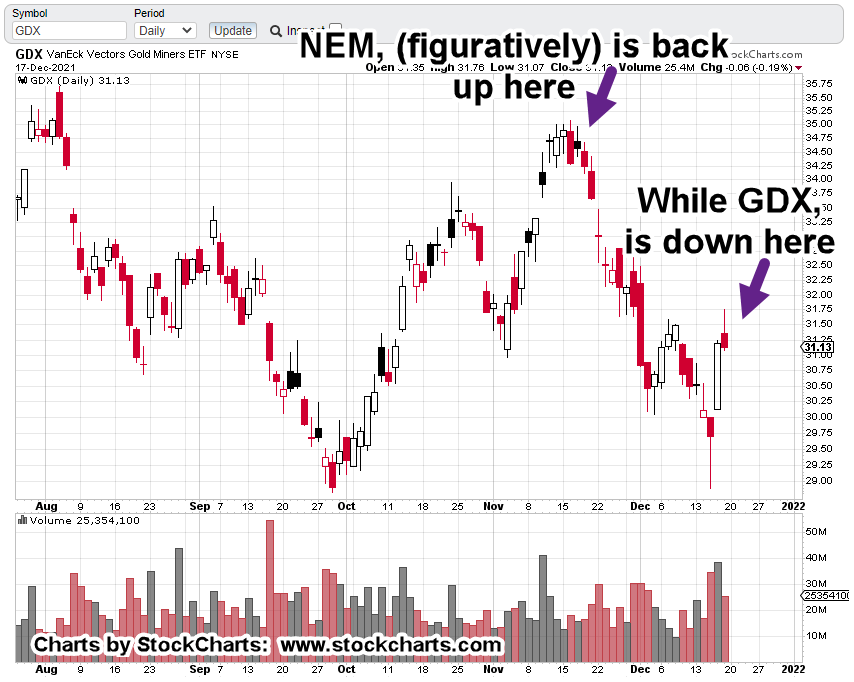
The other part of the story and the one that weights it to the bears:

While NEM, is at multi-month highs, senior miners GDX, is nowhere near its highs.

Daily chart, GDX:

What does that mean?

It means the market is ‘thinning-out’

The professionals and maybe some investors alike, are abandoning the non-performing lesser cap equities; pouring funds into the last man standing NEM, in hopes that it will keep moving higher.

It’s desperation and signals market weakness.

As always, anything can happen and bulls may somehow take control.

However, from the charts themselves, hyper-stretched major indices coupled with insiders bailing out the most in history, uneducated ‘retail’ willingly stepping up to hold the bag, it does not look good for any bulls … gold or otherwise.

Summary:

We could find ourselves in a situation similar to the oil market in mid-2014 where it spontaneously deflated for eighteen months … nary a blip higher all the way down.

With that, we’re maintaining short via DUST (not advice, not a recommendation).

Stay Tuned

Charts by StockCharts

Note:  Posts on this site are for education purposes only.  They provide one firm’s insight on the markets.  Not investment advice.  See additional disclaimer here.

The Danger Point®, trade mark: No. 6,505,279

Gold … Before The Open

Is Today The Day ?

Is today the day we find out who’s really in control?

The day where it’s either inflation or deflation?

It’s about 30-minutes before the open.

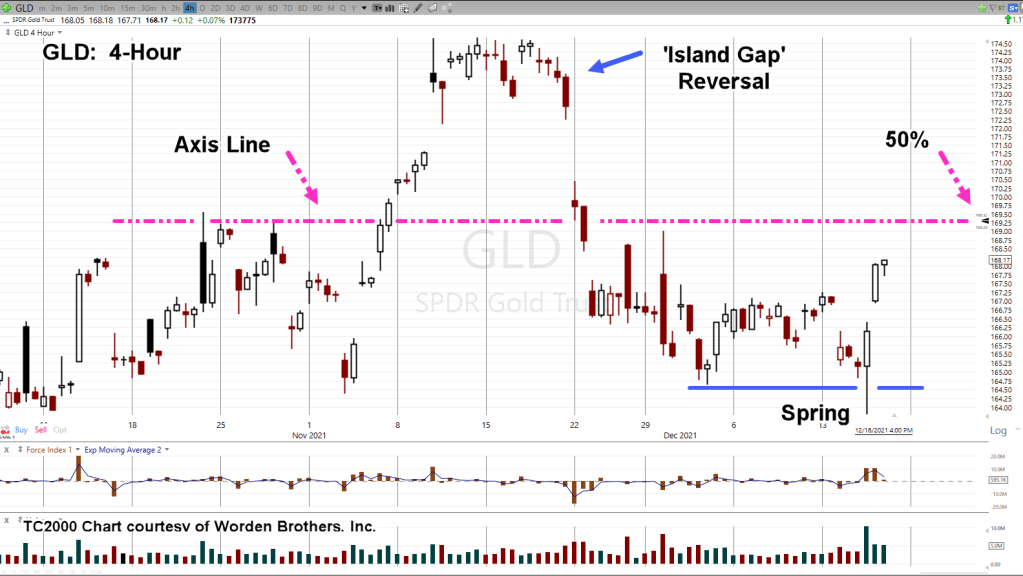
Pre-market action has gold (GLD), right at the Fibonacci 50% retrace level shown in the 4-Hour chart.

Gold (GLD) 4-Hour

Looking at the chart we see the following:

The up-thrust from November, was an island gap reversal (bearish).

During the Fed announcement (Wednesday, the 15th), price action penetrated weekly lows and set up a spring condition (bullish).

We’re at Fibonacci Day 3, of the spring and current trading at 50% retrace in the pre-market (neutral).

Pre-market trading is at an axis line which also indicated prior resistance on November 30th (bearish).

If price action opens or trades at the 50% level, it would also up-thrust the November 30th print high; therefore, creating a potential reversal condition (bearish).

Summary:

There’s a lot going on in the gold market.

The ‘man on the street’ YouTubers are screaming inflation and the need to “exit the system”.

That’s a great idea (exit). Just exactly how does that work anyway? A topic for another time.

Meanwhile, here we are.

We’re doing what price action’s telling us to do. That is, stay short until proven wrong (not advice, not a recommendation).

That proof, for bulls or bears could come today.

Stay Tuned

Note:  Posts on this site are for education purposes only.  They provide one firm’s insight on the markets.  Not investment advice.  See additional disclaimer here.

The Danger Point®, trade mark: No. 6,505,279
Gold … Here We Go Again …

Repeating Pattern(s)

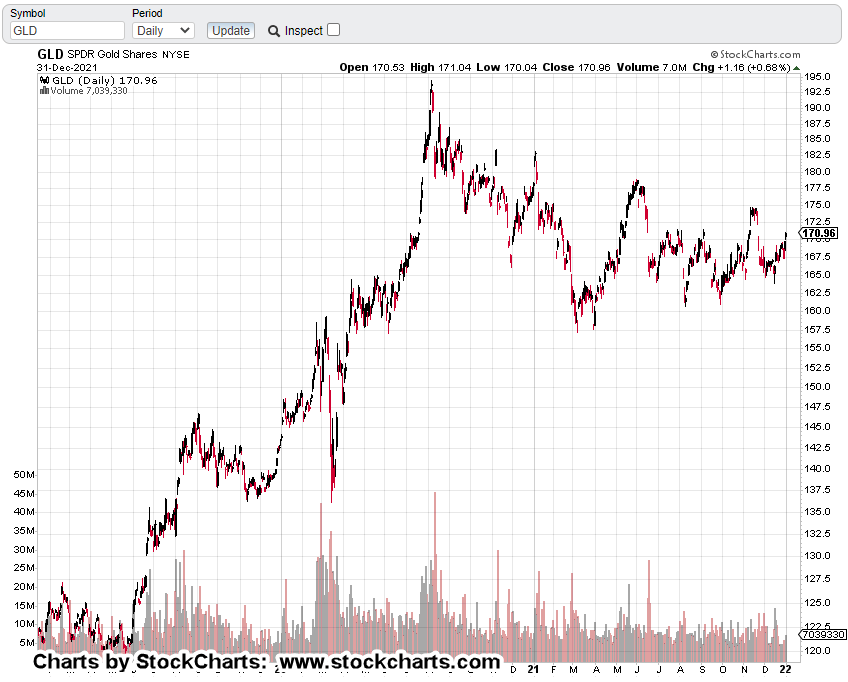
“Spring to Up-Thrust”

That’s where we are now.

Yesterday’s update was out before gold (GLD) penetrated weekly lows.

Those who don’t understand the markets, will say it’s the Fed.

Those who do understand the markets (the trading pros) won’t say but keep it to themselves.

They’ll let the gold bulls think their day has come. We have hyperinflation at last!

As always, it could be true.

The more probable, price action based outcome; we’re in yet another push past resistance to trap the bulls.

Gold (GLD)

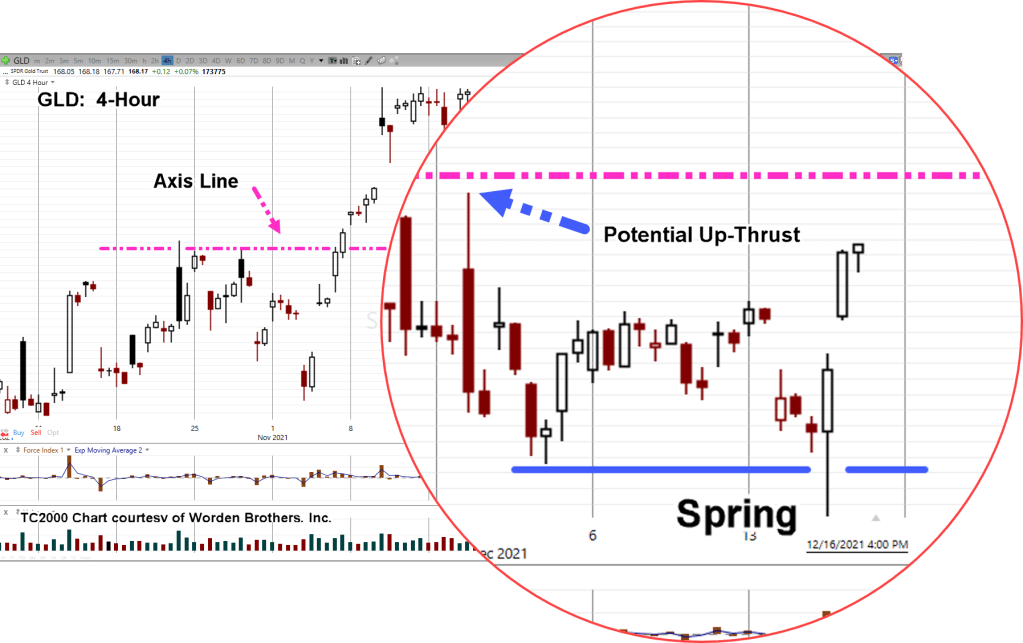
As of this post (about an hour into the session) the daily chart is in up-thrust position and 38%, retrace level simultaneously.

Zoom-in

So, it’s yet another danger point. If bulls are to take control, this is the spot.

If they fail, they are trapped yet again; if so, the next down-leg may be brutal indeed.

Positioning:

Maintaining short via DUST (not advice, not a recommendation) with ‘cover-shorts-finger’ close the trigger.

Stay Tuned

Charts by StockCharts

Note:  Posts on this site are for education purposes only.  They provide one firm’s insight on the markets.  Not investment advice.  See additional disclaimer here.

The Danger Point®, trade mark: No. 6,505,279

Producer Prices … ‘Explode’

Yet, Gold Heads Lower ?

It just doesn’t add up.

U.S. producer prices explode to record high and gold heads lower.

Is anyone paying any attention?

Apparently, not.

Today’s trip to the office supply store, had those employees and some customers alike, still putting toilet paper on their face in an attempt to ward off goblins … unseen.

Meanwhile, down in Kiwi-Land, looks like the Prime Minister has declared the coast is clear for orgies up to 25-people.

Talk about, “In the days of Noah …” but, I digress.

Gold (GLD), posted lower and the miners GDX, did as well.

The nuance with the miners, we may have just seen a pivot lower … increasing the rate of descent.

Senior Miners, GDX

We’ll use the same chart scaling from yesterday’s update.

Looking closely, today’s bar pulled away from the right-side trend-line just a bit.

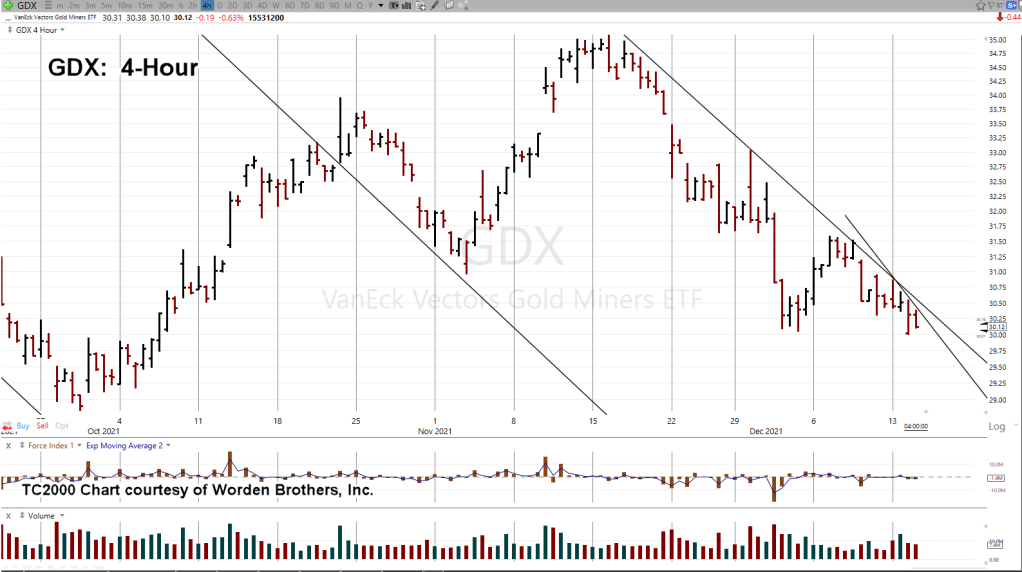
Next, the same chart but on a 4-Hour time-frame

Note how a new (increased angle) trendline can be drawn.

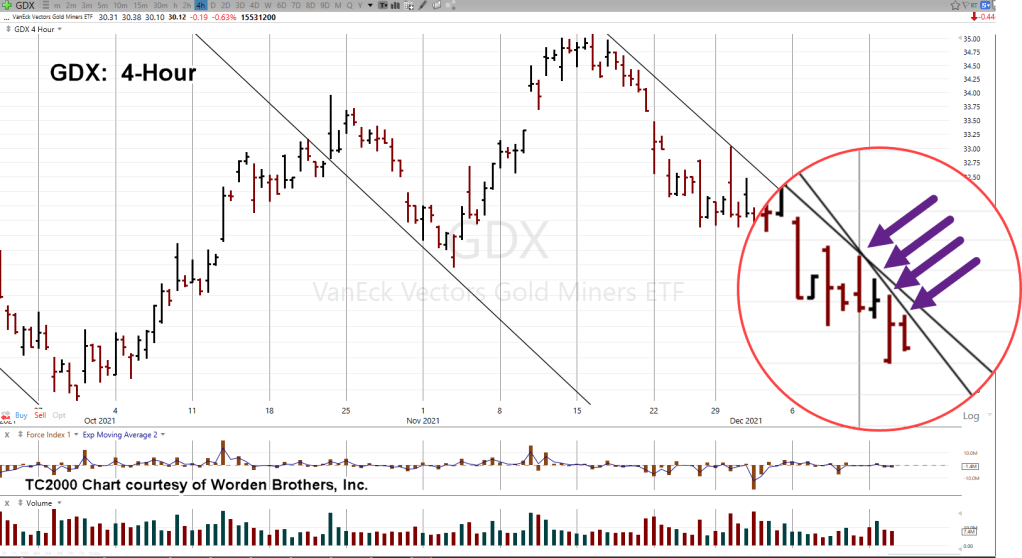
The next chart zooms-in

There have been four, four-hour hits on the new more aggressive downtrend line.

That new line (thus far) is declining at about -94%, on an annualized basis.

Summary

If this is a more aggressive pivot lower, it’s very early in the trend. The next session can easily negate the trend or just as easily, provide confirmation.

Maintaining short via DUST (not advice, not a recommendation).

Stay Tuned

Note:  Posts on this site are for education purposes only.  They provide one firm’s insight on the markets.  Not investment advice.  See additional disclaimer here.

The Danger Point®, trade mark: No. 6,505,279