Steven Van Metre, in his Sunday Night Charts (time stamp 12:20), shows the precarious situation of GDX.
There’re about 90-minutes left to go in this session.
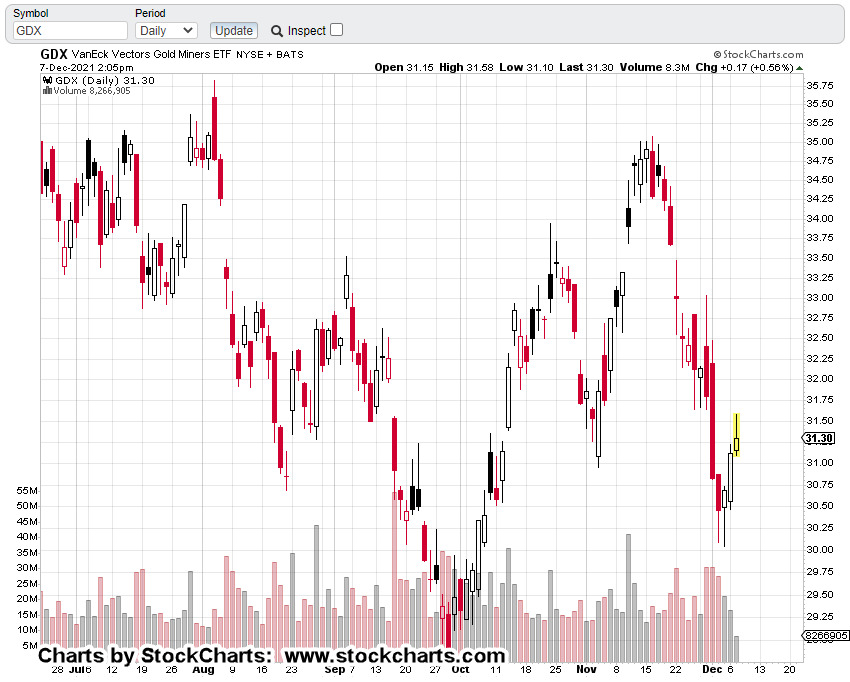
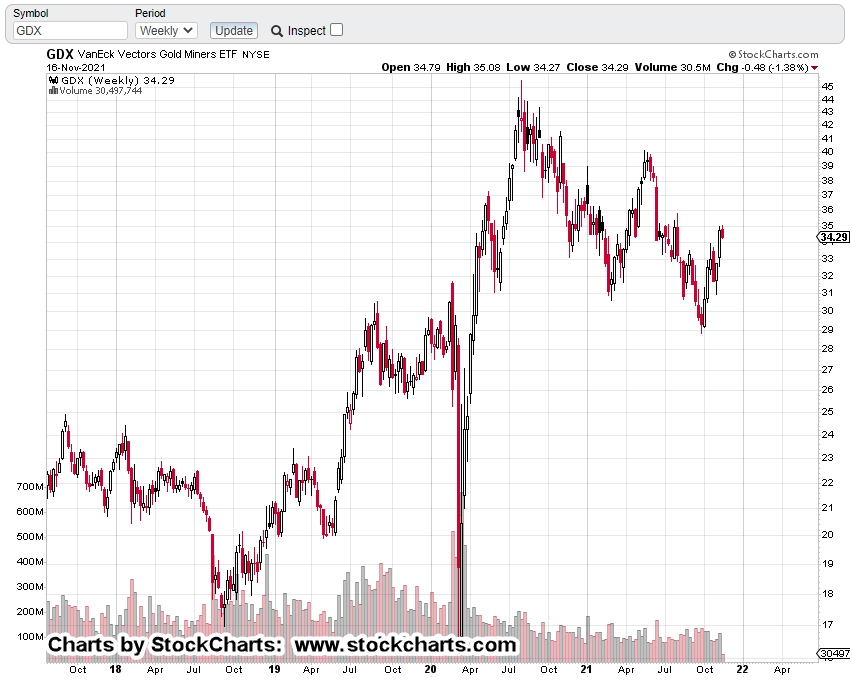
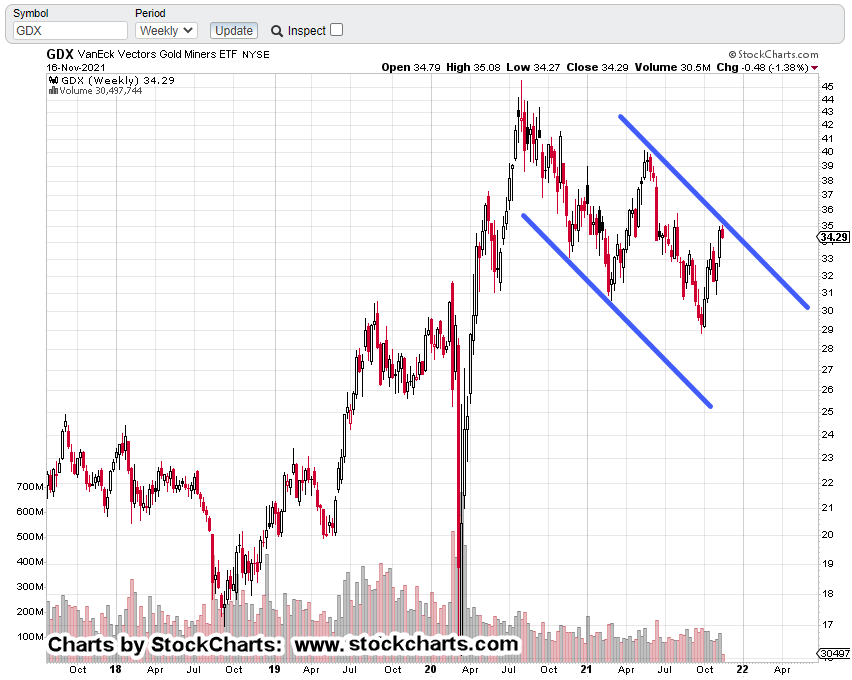
It looks like GDX is/has tested underside resistance and down-trend simultaneously. For GDX to break higher, it would have to get through that resistance.
As always, anything can happen but we need to remind ourselves, the gold bulls are already trapped … having bought at the mid-November breakout.
If still holding, they’re now deep in the red.
Under such conditions, each down move serves to set the (bear) hook even more.
If we use this just released article from ZeroHedge, we’re nowhere near any kind of capitulation and upside reversal.
Senior Miners, GDX
The un-marked daily chart
And now …
With zoom
We’re at a confluence of resistance; the downtrend and the underside of price action.
Let’s keep in mind, the overall markets (S&P, Dow, Nasdaq) are still oscillating around their all-time highs. Volatility has increased as the trend appears to be changing.
Gold and the miners are nowhere near all-time highs.
A century ago, Wyckoff showed how to spot markets that would decline the fastest and farthest under bear market conditions (not advice, not a recommendation).
It’s not the high-flyer we’re looking for … no, it’s the laggard.
That’s the one to pick.
It’s already weak and once the buoyancy of the general market evaporates, the bottom may fall out.
Note: Posts on this site are for education purposes only. They provide one firm’s insight on the markets. Not investment advice. See additional disclaimer here.
To date, there’ve been 232 transactions in the firm’s main trading account.
Each one has its own story.
The big one for now, is shorting the gold miners GDX, via DUST (not advice, not a recommendation).
We’re going to pull out the ‘card catalog’ on that one and take a brief look.
As a reminder, this post identified the breakout target for gold (GLD), months before it actually happened.
Also, in a prior post, it was discovered the miners had 3:1 downside response to recent down moves in gold.
Therefore, at this point in time, using leveraged inverse fund DUST, at -2X, the miners, gives an estimated, 6:1, market exposure.
Short entries were opened (shown below) once the gold market and miners broke to the upside.
Hysteria First
Those who’ve been here a while, already know part of the short set-up, was the necessary hysteria needed to get nearly everyone on the wrong (bullish) side.
Senior Miners, GDX
Just for reference, the daily chart of GDX, is below.
I suppose it must have been from behind enemy lines, with one of the gold updates warning us about archrival, Russia.
As we can see from the price collapse, the Russians must have found our gold bulls. 🙂
Meanwhile, Back At DUST
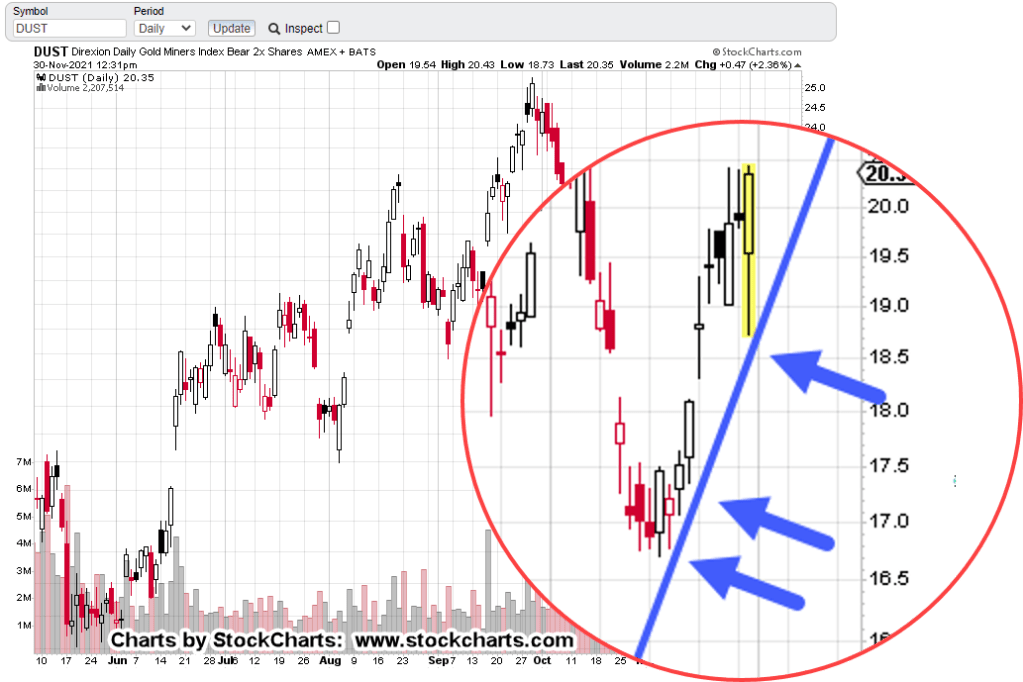
The daily chart of leveraged inverse DUST, shows trade entry locations to date (not advice, not a recommendation).
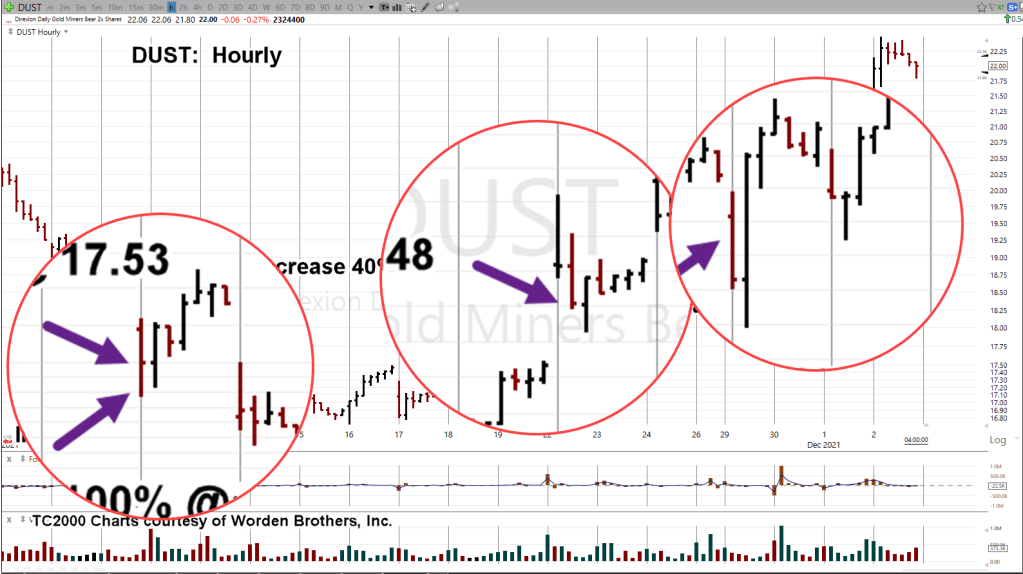
The hourly chart below, gives a closer look.
The next chart is a zoom-in of the entries.
Positioning in this market for now, is essentially complete.
At this point, it’s time to monitor and track for any potential trend reversal or trendline break.
Early Or Late
Years ago, sometime around late 2007, or early 2008, Robert Prechter Jr., said concerning his trades, he tends to be a little bit early.
That implicitly means he might suffer through adverse action including loss-exit, if action goes counter enough.
There’s no perfect entry. Early or late, take your pick.
Fixing Entry Errors
As can be seen on the hourly chart, every trade entry was on a red (declining price) bar.
The risk is, price action will just keep on going red.
The benefit is a big one; I’m not chasing the market.
If I’m chasing, it means I’m not on my game or I never had a game or worse, a coward that can’t pull the trigger on a trade without more ‘confirmation’.
David Weis covers in his video, how to properly get aboard a market that’s already underway.
After the initial entries, DUST banged around the bottom (GDX at the top) for eight trading days.
In retrospect and looking at the chart, the adverse action was not much lower but it did not feel like it at the time.
Because of the months of planning, there was an inference the size of this reversal would be significant.
So far, it is.
In the process of reversing, price action itself has fixed trade entries made a little too early.
Summary
Future updates will show potential trend and/or channel action as well as Fibonacci time correlation.
At this point, the DUST trade is well underway.
A reasonable stop area would be in the vicinity of DUST 19.37 (not advice not a recommendation).
Stay Tuned
Note: Posts on this site are for education purposes only. They provide one firm’s insight on the markets. Not investment advice. See additional disclaimer here.
Note: Posts on this site are for education purposes only. They provide one firm’s insight on the markets. Not investment advice. See additional disclaimer here.
The latest update from Steven Van Metre, has comments from the Fed that seem like they’re from another world, another time.
Evidently, the economy’s so strong … so good, that we might taper more aggressively and then … raise rates.
At this point, ‘what difference does it make?’
They’ve probably already cashed-out (like last time) and now stand on the sidelines.
Meanwhile back at the proletariat, we’re deciphering the market’s next moves … Fed press releasees notwithstanding.
Is Gold (GLD) The Black Swan ?
Frist off, there are several YouTuber’s that are providing an excellent service; letting us know the real state of the economy.
They are invaluable; thus, receiving their fair share of hate from those that don’t want to hear, see, or smell, ‘bad news’.
All of them willingly admit, they’re not experts when it comes to the markets … fair enough.
However, in Jerimiah Babe’s latest update, he may have unwittingly revealed a (or the) black swan.
Gold and the gold market.
JB’s offered the anecdote of attempting to purchase more gold at the dealer. For the first time ever, he was limited on the amount available.
From a market standpoint, the public, is all-in.
Even as we speak, gold (GLD) and the miners, GDX, GDXJ, are in a vicious downside reversal.
At this juncture, it looks like an upward test of resistance (discussed yesterday) is nowhere in the cards.
Price action for the most part, is straight down.
Which brings us to the charts.
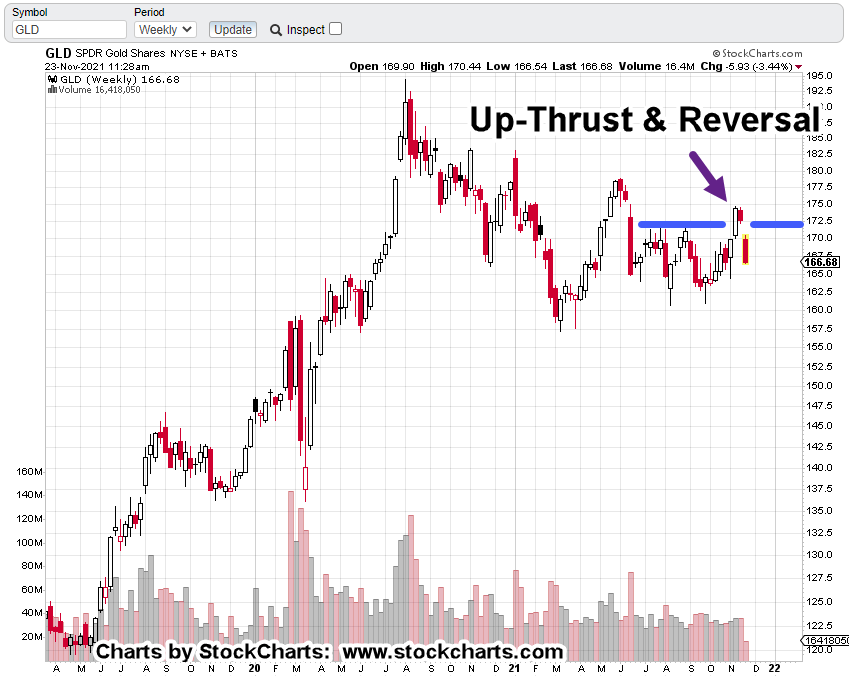
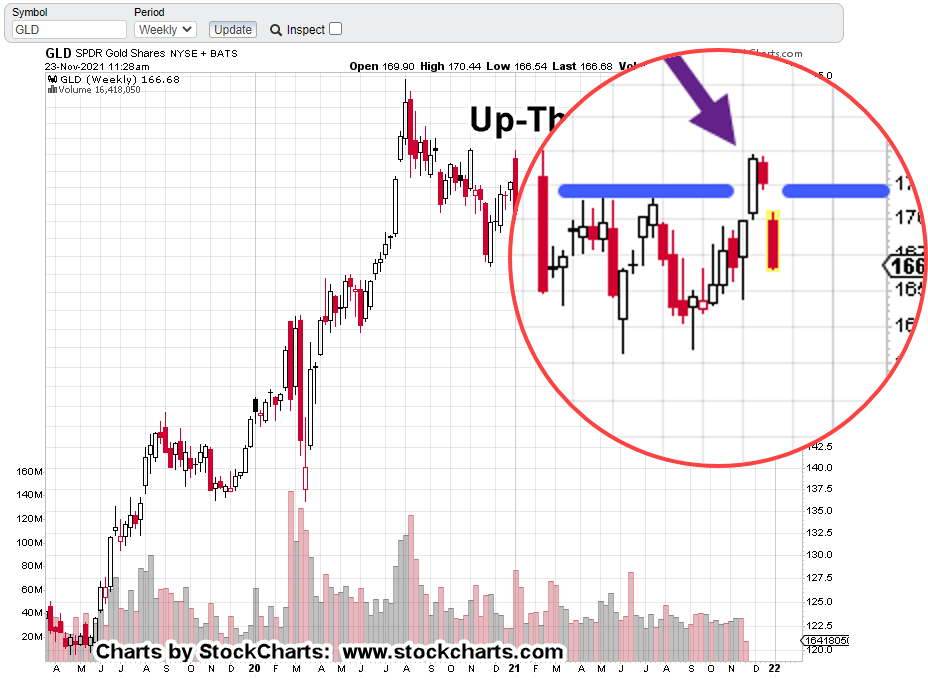
GLD, Weekly Chart:
Marked up with resistance and the up-thrust reversal.
Zoomed area of the reversal
Personal Opinion:
Because the gold hype by the financial press was so incessant for so long (which by the way, has strangely ‘disappeared’), this reversal may be something that lasts much longer than anyone would expect (not advice, not a recommendation).
Downside Targets:
The weekly GLD chart below has a Fibonacci projection tool overlay.
A 161.8%, projection would take GLD down to 119 – 120.
Are the gold bulls prepared for an extended downside rout in the metals?
Summary:
Early morning food production.
It might not look like it’s connected to the markets but it is.
Market analysis presented on this site, helps steer actions needed to separate from (or reduce reliance on) the system.
Properly executed, trading is one avenue to provide income that’s necessary to eliminate the need for a corporate employer (not advice, not a recommendation).
Market analysis also helps identify what’s likely to come next.
But, I digress.
Getting back to the coop; four eggs a day … equates to over two dozen a week. Reliance on the grocery store (at least for eggs) has effectively been eliminated.
About a year’s worth of feed has been stockpiled.
Let’s put it a little differently; a year’s worth of feed has been ‘stacked’.
Personally, I like gold and silver as much as the next guy.
However, those in charge of this collapse have already stated, food will be used as the leverage weapon.
But hey, we shouldn’t have to worry about any of that, because, ‘The future’s so bright …’
Note: Posts on this site are for education purposes only. They provide one firm’s insight on the markets. Not investment advice. See additional disclaimer here.
Adverse moves in gold (GLD) like we have right now, especially after months of incessant hype, puts those who bought into the narrative on the wrong side; stunned, unable to move.
There’s a small chance, this could be a shakeout before going higher. Anything can happen.
However, if we look at the chart of GLD, it’s a grim situation for the bulls.
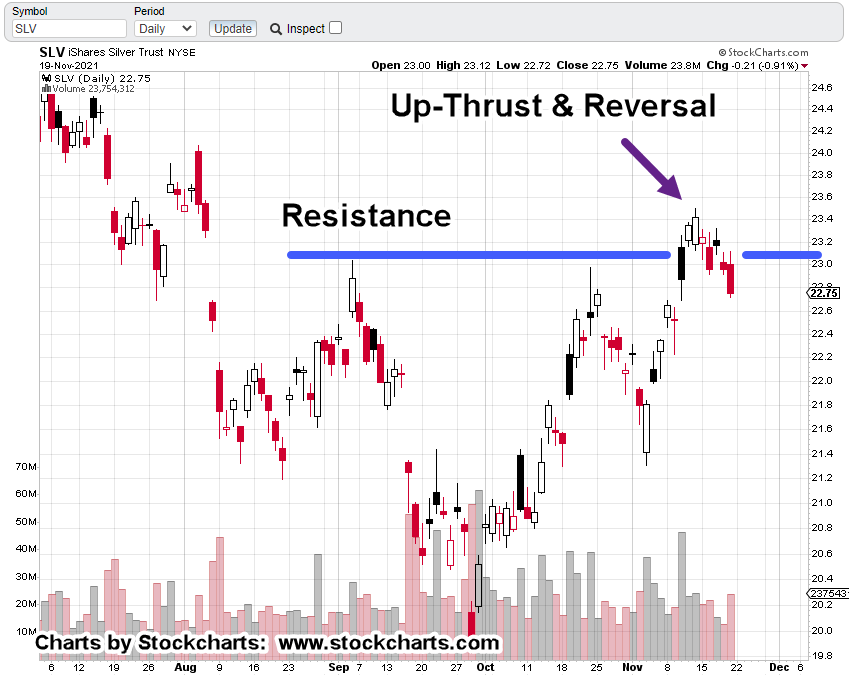
Gold (GLD)
Daily chart, GLD:
This wasn’t just a one-day push above resistance and then reversal.
GLD, spent a Fibonacci 8-Days struggling to break out before this morning’s collapse.
Stunned bulls may think it’s a buying opportunity. If so, there’s likely to be some kind of underside test of resistance.
However, that’s not guaranteed. Moves like this tend to offer no relief and just grind their way lower.
Positioning:
At this juncture, we’ve got a nasty adverse move; putting the short position (DUST) well in the green (not advice, not a recommendation).
Any upward test of GLD, and the miners, GDX, GDXJ, is likely to reveal new support/resistance boundaries and possibly trend-lines.
If so, we’ll have something to monitor for a potential exit signal.
Note: Posts on this site are for education purposes only. They provide one firm’s insight on the markets. Not investment advice. See additional disclaimer here.
Note: Posts on this site are for education purposes only. They provide one firm’s insight on the markets. Not investment advice. See additional disclaimer here.
This trade could still fall apart for some unknown reason.
If it looks like the bulls are somehow re-gaining control, it will show up in the price action and we’ll exit accordingly (not advice, not a recommendation).
Stay Tuned
Note: Posts on this site are for education purposes only. They provide one firm’s insight on the markets. Not investment advice. See additional disclaimer here.
The first part describes some technical details that are all true … after that, well, you decide.
Turns out, gold is going to skyrocket because of Russia !
I suppose, anything can happen.
We get fundamentals and anecdotal data as the reasoning for a Russia driven up-side breakout.
The problem with fundamentals is, they don’t work.
They never have worked.
Wyckoff discovered this a century ago when he said (from his autobiography) that ‘stocks move based on a power of their own. That power, has nothing to do with fundamentals.’
Trading genius Ed Seykota repeated that truth during his interview for ‘Market Wizards’.
He called them ‘funny mentals’ and went on to say he nearly, if not always lost money using them.
This article’s so good that I have to pay to read it.
From reading the shaded area, we can infer a similar (bullish) discussion to the first link above.
Sorry, not interested.
Summary
This time really could be different. Gold could launch into a sustained upward breakout.
However, the charts (GDX, GDXJ) at this juncture, are saying ‘not yet’.
Maintaining short (not advice, not a recommendation) via DUST … which is now in the green.
Stay Tuned
Note: Posts on this site are for education purposes only. They provide one firm’s insight on the markets. Not investment advice. See additional disclaimer here.
Now, that news is just starting to hit the mainstream.
They pretend like they’re not sure what’s it’s all about. So, let’s help them out with some facts.
Embedded within the article at this link, is an actual list of ‘strange anomalies’ that are occurring amongst the most athletically conditioned in the world.
If it’s happening with the athletes, it’s happening in the rest of the population.
Summary:
Early this session, Gold (GLD) and the miners, GDX, GDXJ have, or are testing their highs with inverse funds DUST and JDST testing the lows.
If this is a major transition from up to down for gold and the miners, this type of back and forth is normal.
Positions:
We’re still at the danger point but action can’t stay at these levels for too long. If it does, that would imply the bulls are gaining control and going to move the market to much higher levels.
Obviously, since we’re short (not advice, not a recommendation) via DUST, we’re on the other side of the gold bull trade.
A reasonable stop for DUST would be at, near, or just below yesterday’s low of 16.72 (not advice, not a recommendation).
As of this post, with DUST currently trading at DUST, 17.11, my firm’s position is down a modest – 1.82%.
Note: Posts on this site are for education purposes only. They provide one firm’s insight on the markets. Not investment advice. See additional disclaimer here.
We’ll get straight to it … Gold futures, GCZ21 (December) look like they have posted an up-thrust and reversal in the early hours.
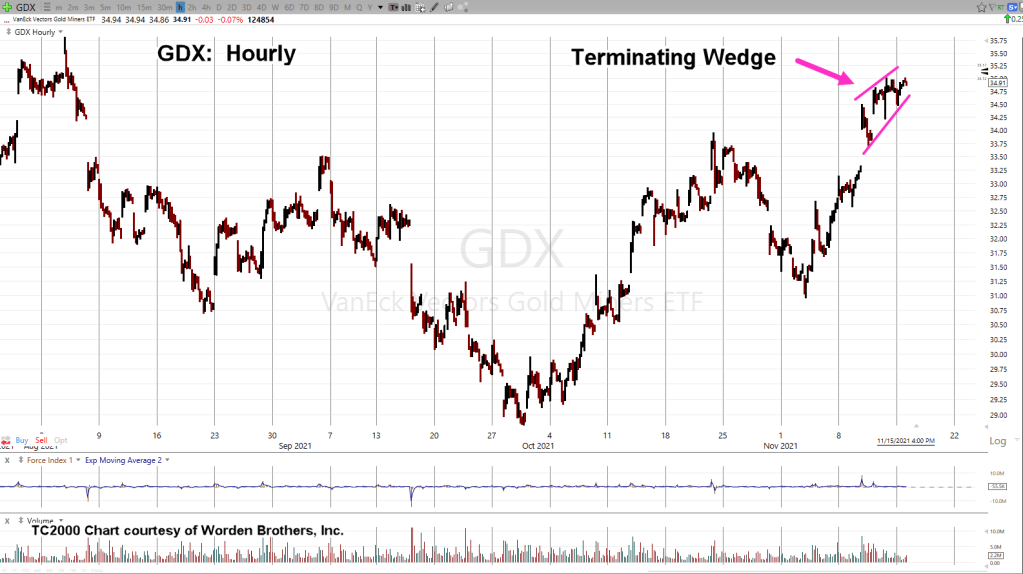
The Miner’s chart above, GDX has a potential terminating wedge as shown. The chart below zooms in on that area:
Pre-market action thirty minutes before the open has GDX about to open slightly higher.
If we’re in a reversal condition, the expectation is for the higher open to be retraced within the first 4-hours of the session … preferably within the first hour.
If price action persists higher, it’s an indication there is more oscillation to come and it’s probably time to stand aside (exit) a short position (not advice, not a recommendation).
Stay Tuned
Note: Posts on this site are for education purposes only. They provide one firm’s insight on the markets. Not investment advice. See additional disclaimer here.