Contact Points

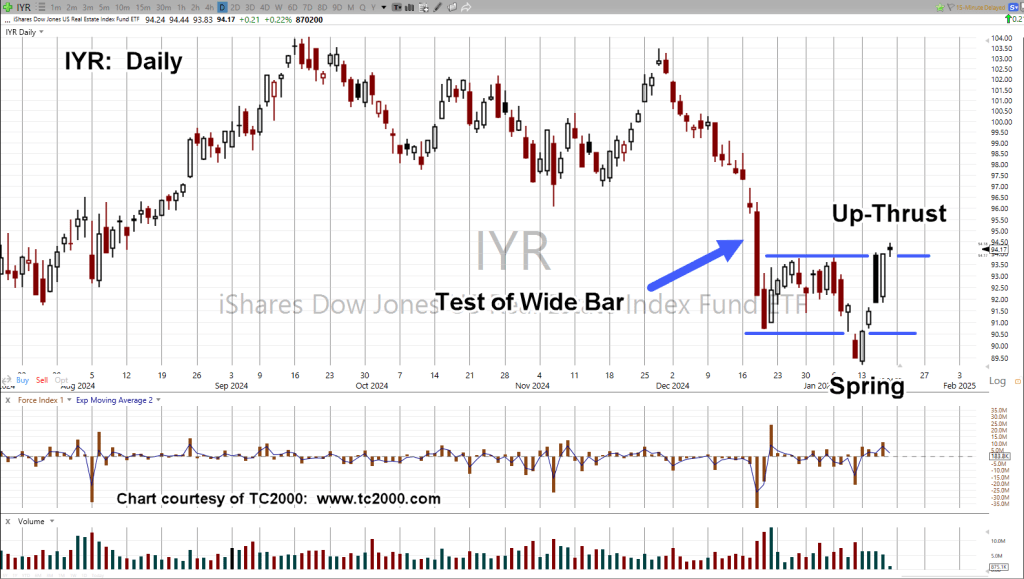
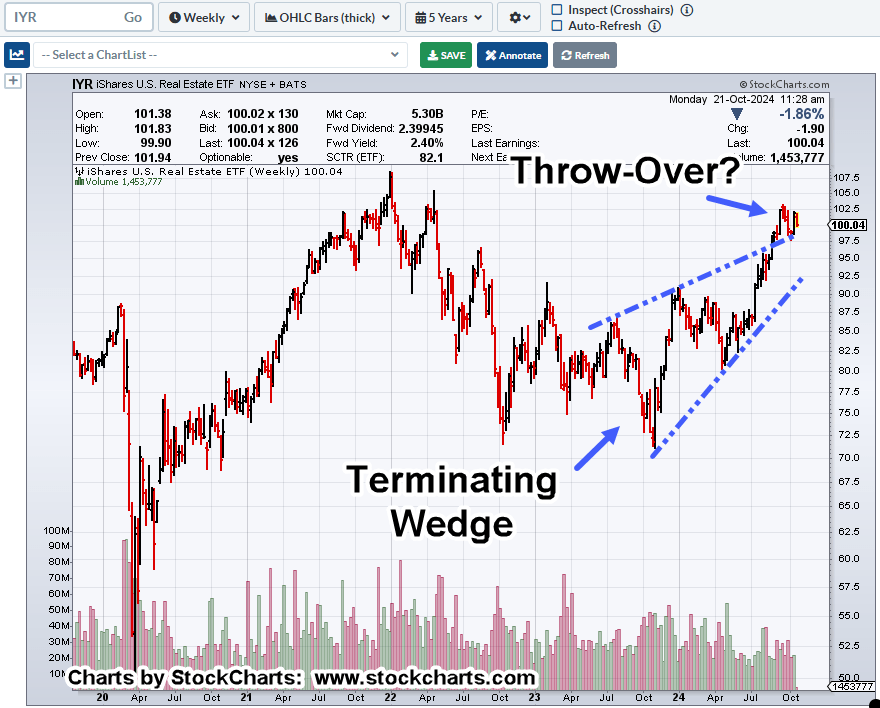
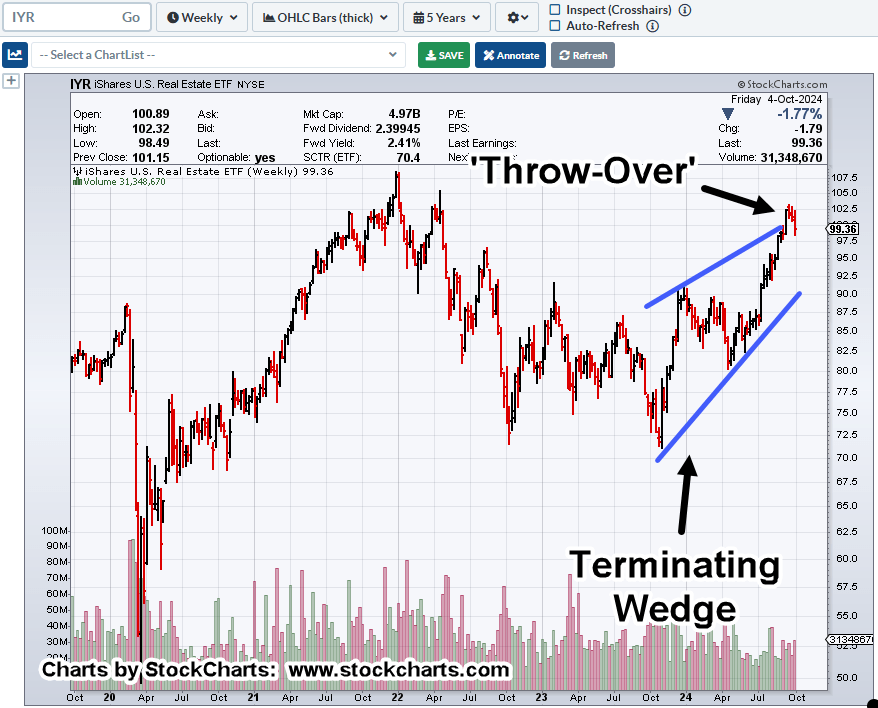
The last update showed the possible (downside) reversal set-up for real estate sector, IYR.
This update shows the largest cap equity in that sector (source, TC2000), ProLogis, PLD, and its current position.
ProLogis, PLD, Weekly
We’ve had essentially sideways action for over two years; trading between (approx.) 90 – 130.
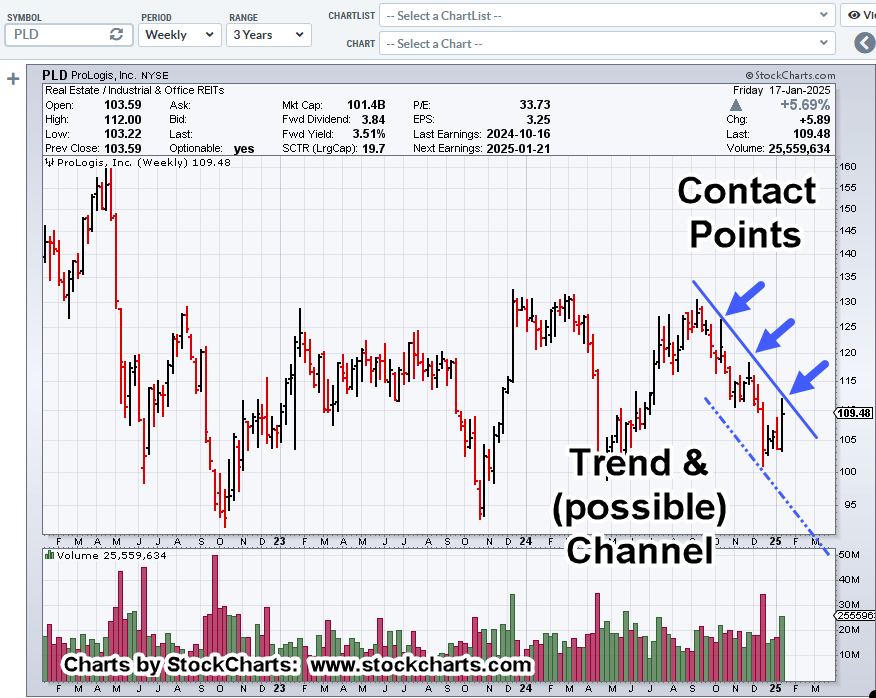
In the past three months, price action has established what looks to be a downtrend and possibly a trading channel (not advice, not a recommendation).
Note the relatively heavy (upside) volume from last week, the green bar.
In Wyckoff terms, that volume is potential ‘effort vs. reward’, or exhaustion if PLD, continues lower from here.
Stay Tuned
Charts by StockCharts
Note: Posts on this site are for education purposes only. They provide one firm’s insight on the markets. Not investment advice. See additional disclaimer here.
The Danger Point®, trade mark: No. 6,505,279