To Survive, Prosper, You Need To Have The ‘Stomach’

There’s nothing like the Vietnam war to remind us, the enemy on their home turf has the advantage and can exercise a war of attrition.
Similar to the Soviets in Afghanistan; the natives, the Mujahideen, wearing down the invading army month after month and year after year.
The Oligarchs and The Proletariat
Day after day, another food processing plant burns down; another fertilizer train mysteriously derails, a natural gas facility unexpectedly blows up.
‘So it goes’, as Vonnegut wrote.
Americans, except for a few, don’t have the stomach for discomfort. The Depression-era generation is long gone.
However, this site, is for that small few.
As can be seen with the above ‘events’, we’re in a long-term chess game. Adding a potential twist is this video at time stamp 12:50; seeds may now be dead-on-arrival.
Is the typical money management firm, or market analysis YouTuber, taking all of this into account?
Or are they still talking about ‘due diligence’, ‘fundamentals’ and what The Fed ‘has to do’?
A good number, if not the vast majority of these firms, may be on a course for self-destruction.
More chaos to come as that industry gets crushed.
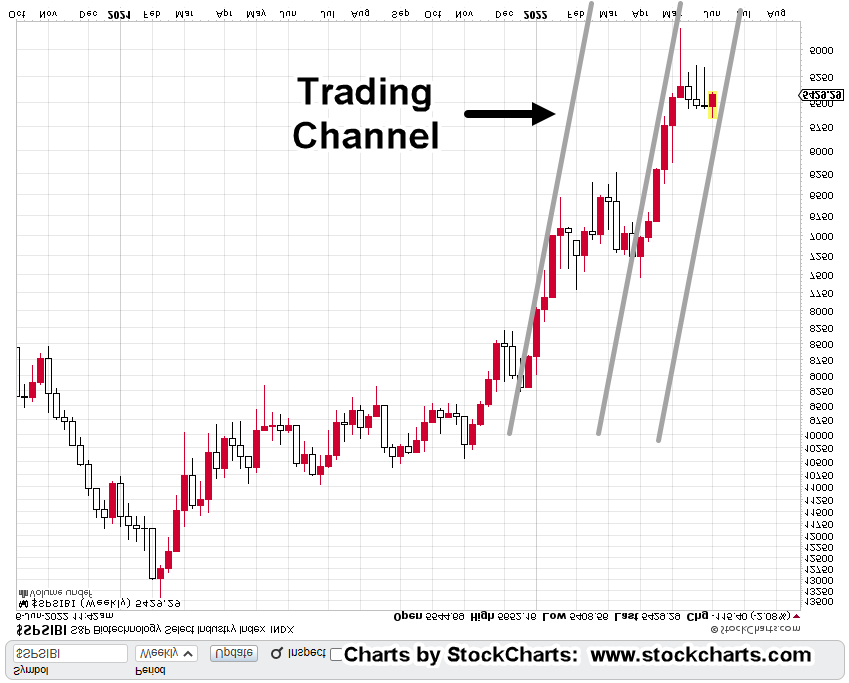
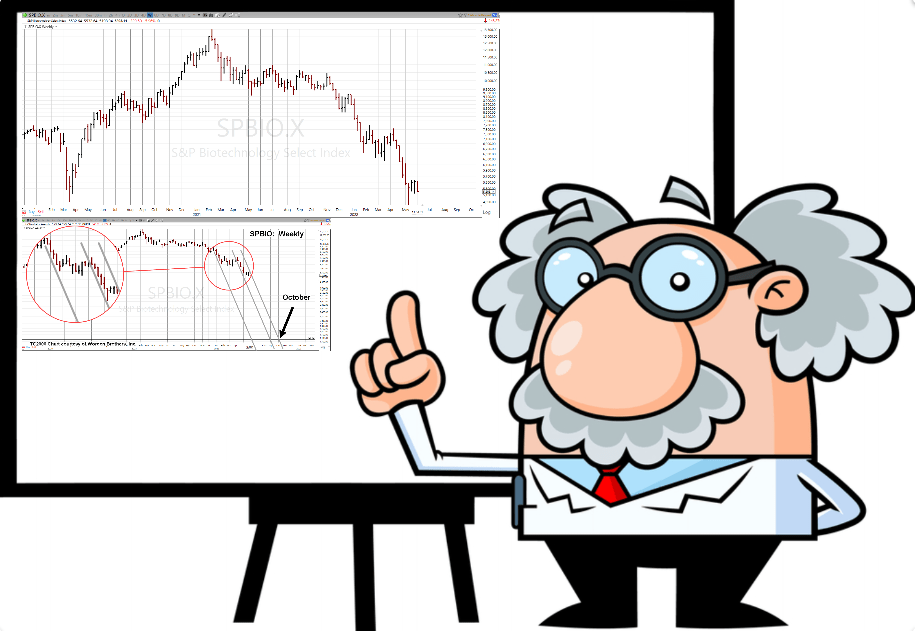
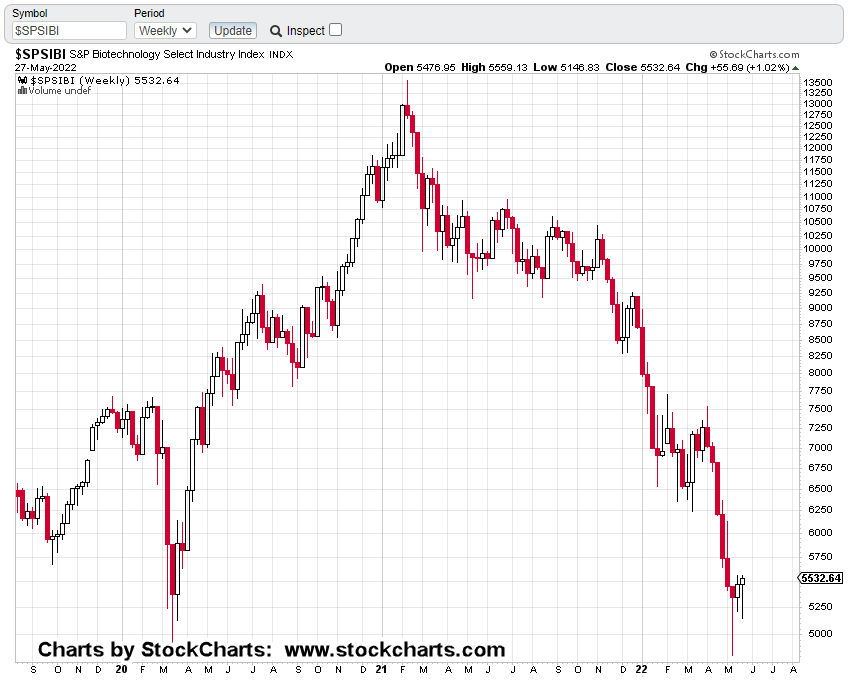
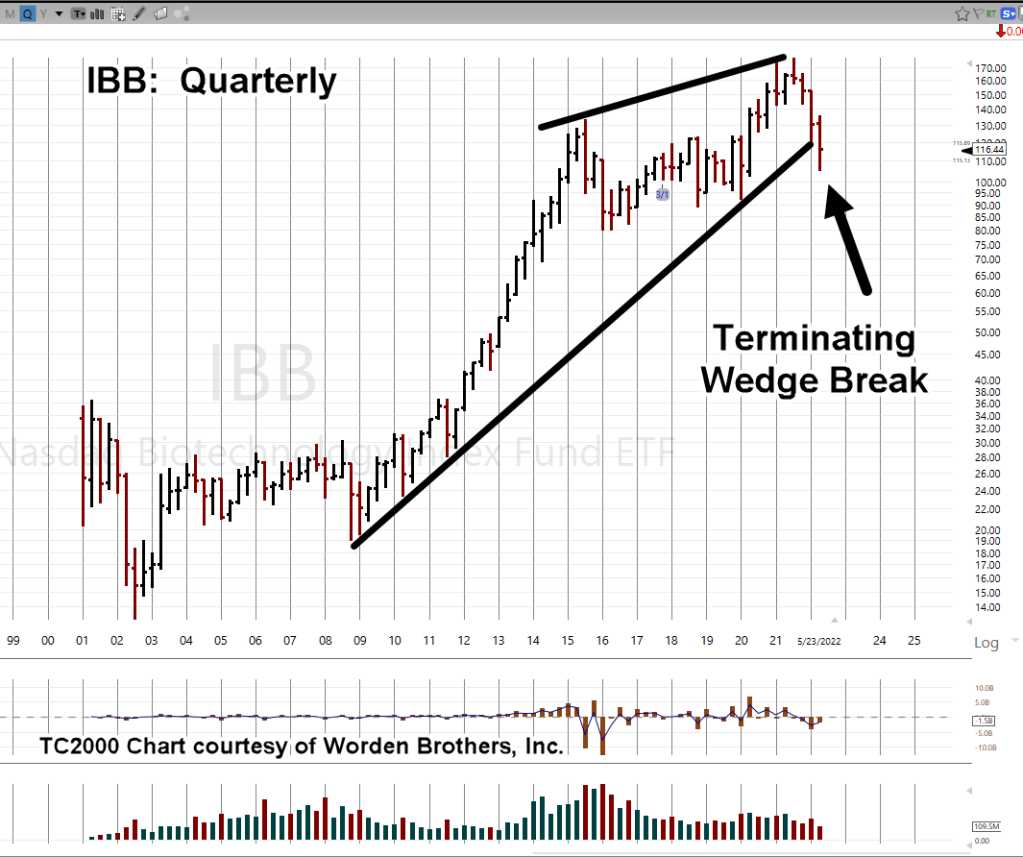
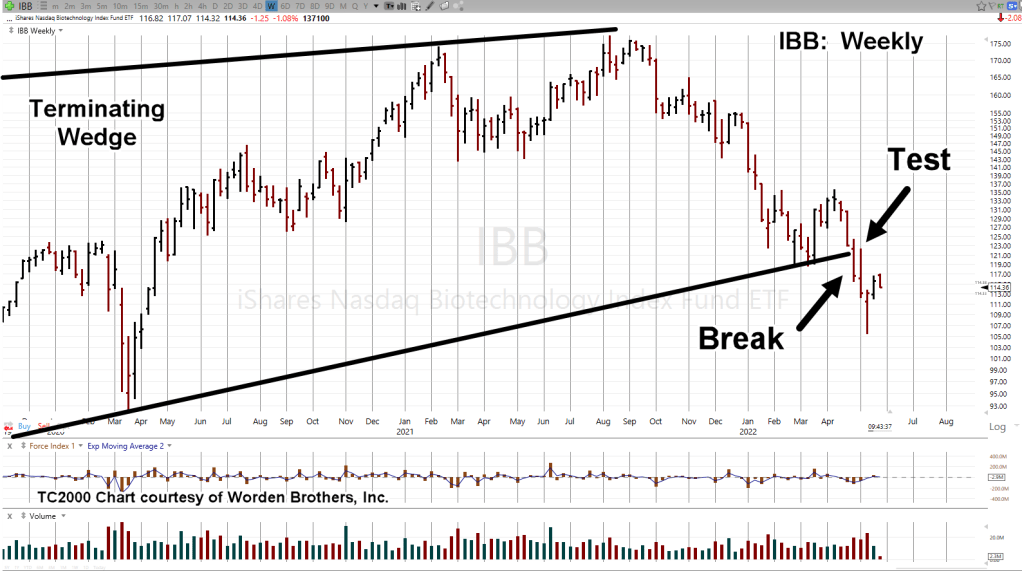
With that, let’s review why there’s been so much focus on biotech and specifically, SPBIO.
The Major Indices or ETFs
As of yesterday, Friday, this is where the major indices stood in relation to all-time highs or ‘recovery’ highs.
Listed from smallest percentage loss to the largest.

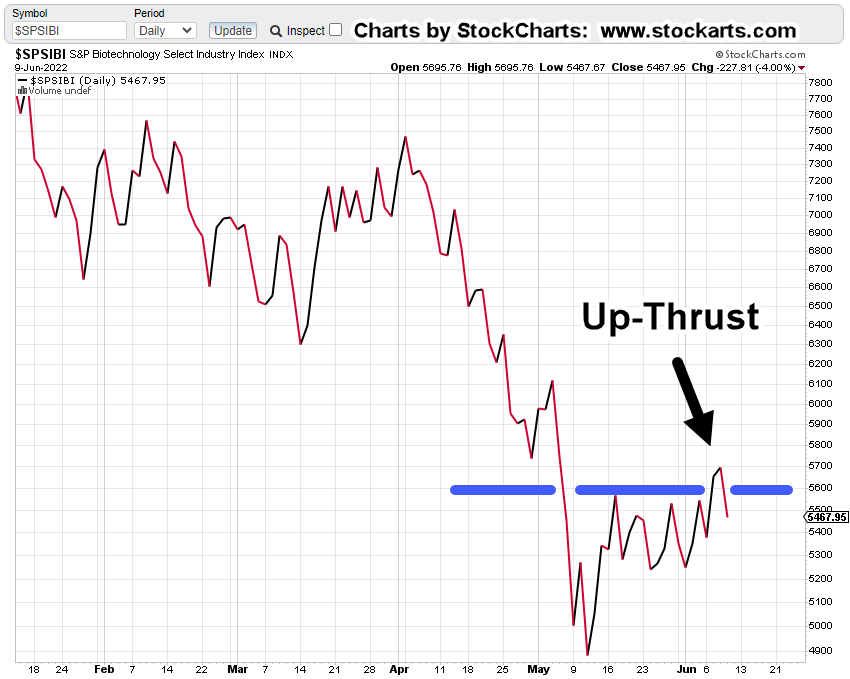
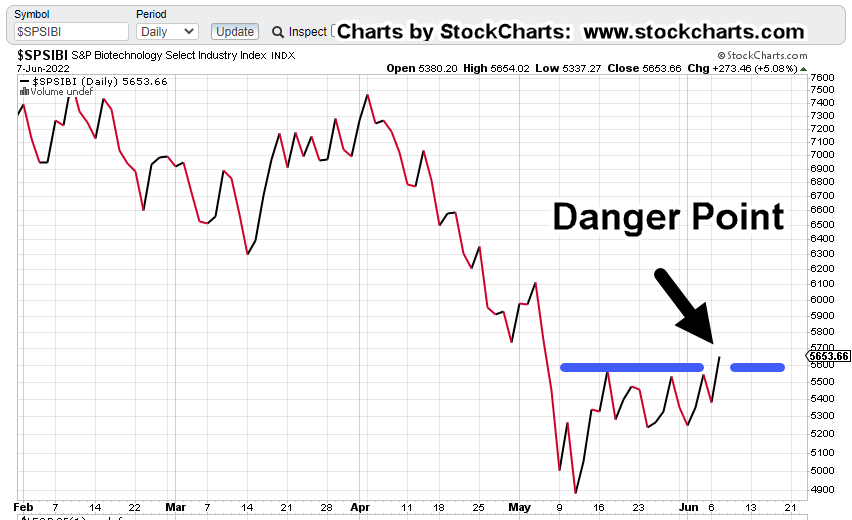
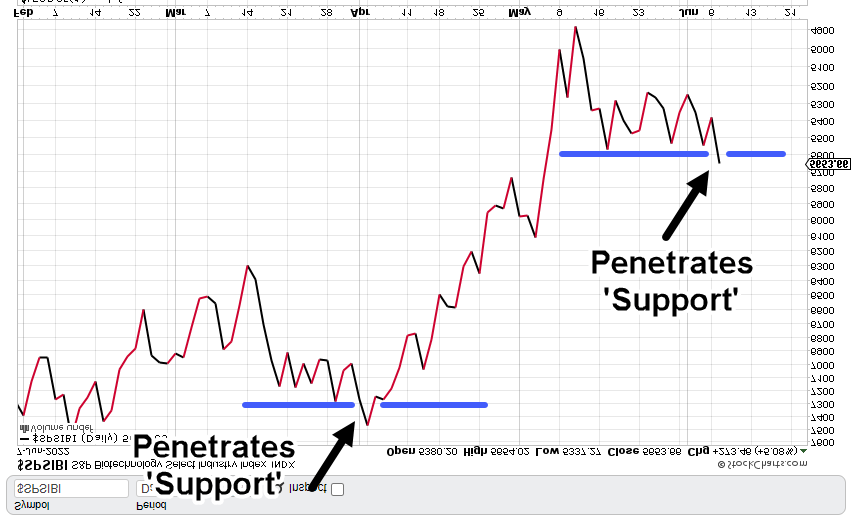
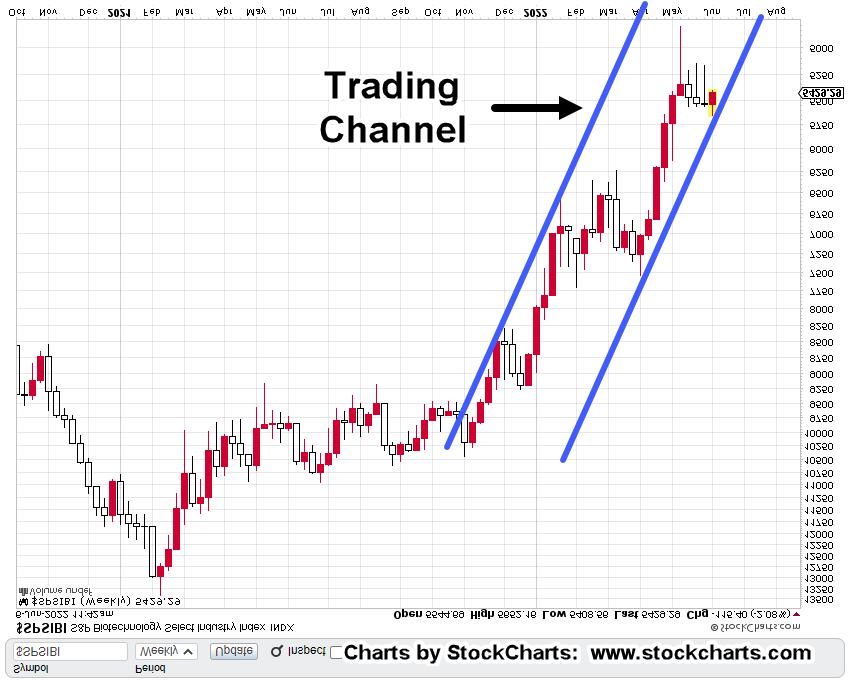
Biotech SPBIO, has been down five quarters in a row and is working on the sixth.
Because of last week’s action, the sector may be poised for its most dramatic part of the decline (not advice, not a recommendation).
We’ve had an on-going analysis of the sector with recent links provided here, here, here, and here.
Positioning
If we’re about to have a market implosion in the coming week(s), SPBIO, has already set itself up to be the downside leader (not advice, not a recommendation).
That doesn’t mean ‘straight-down’, although it’s always a possibility.
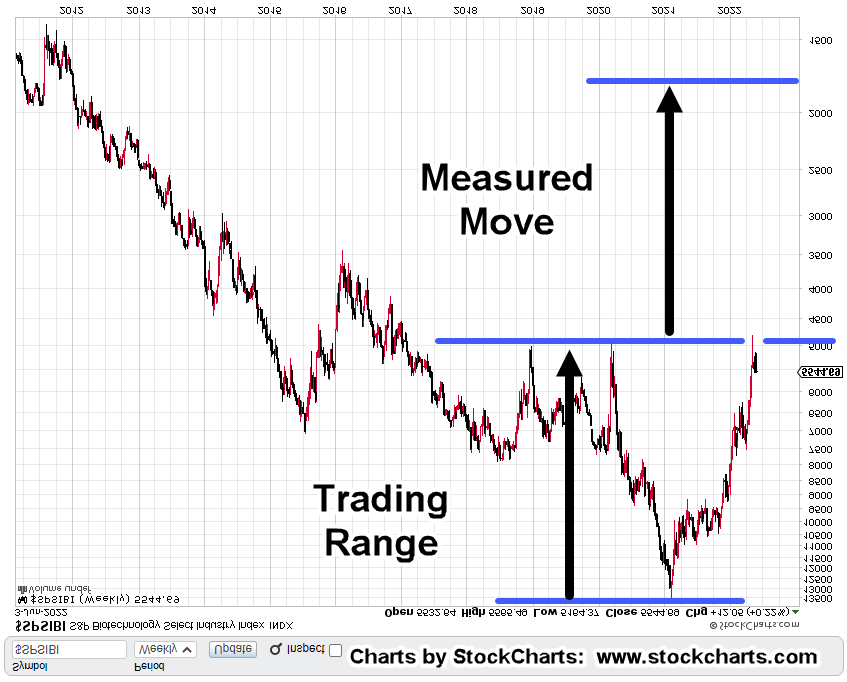
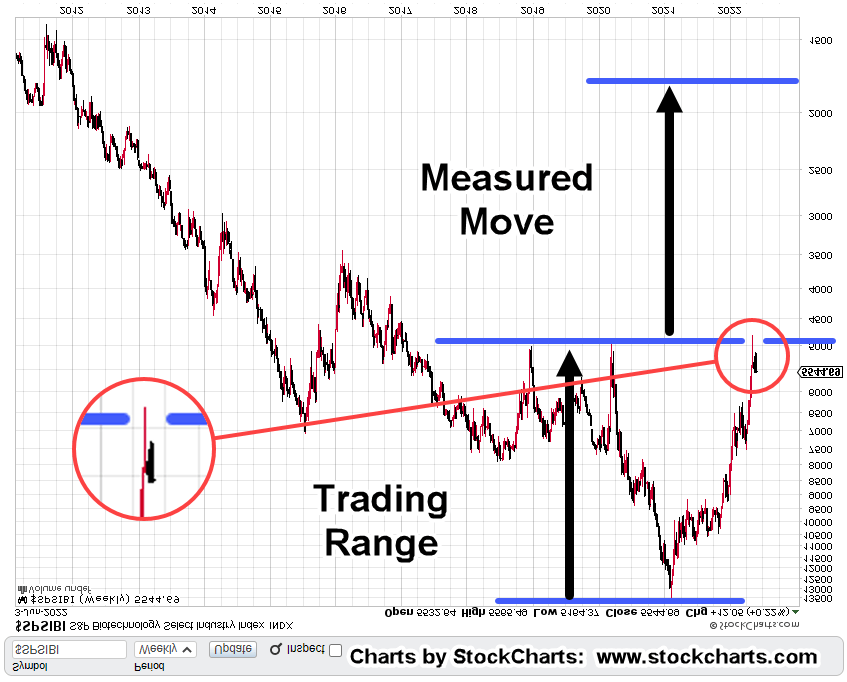
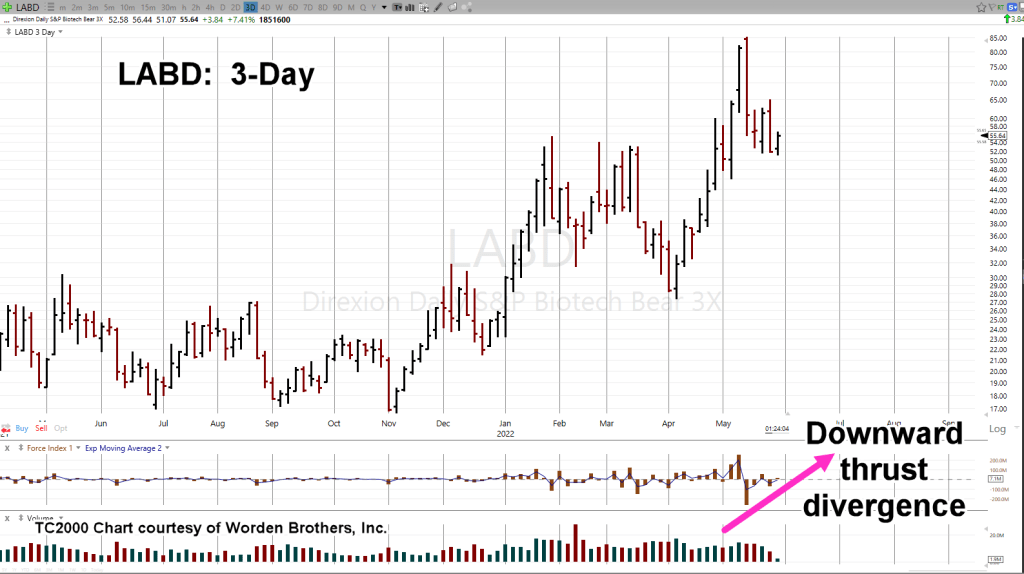
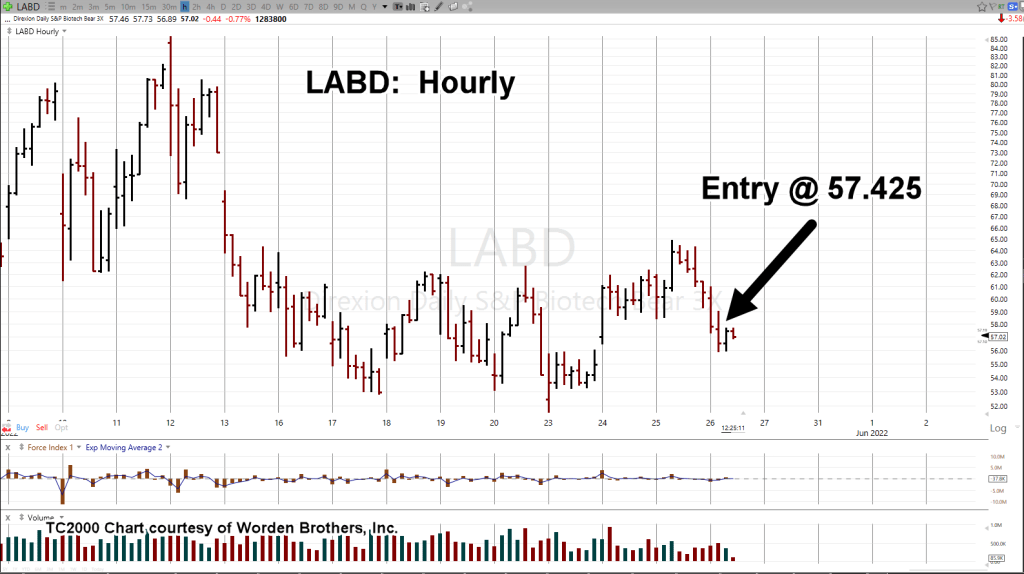
The most likely price action is more SPBIO downside (LABD, higher), with some oscillation in the accumulation area shown on leveraged inverse LABD, below.
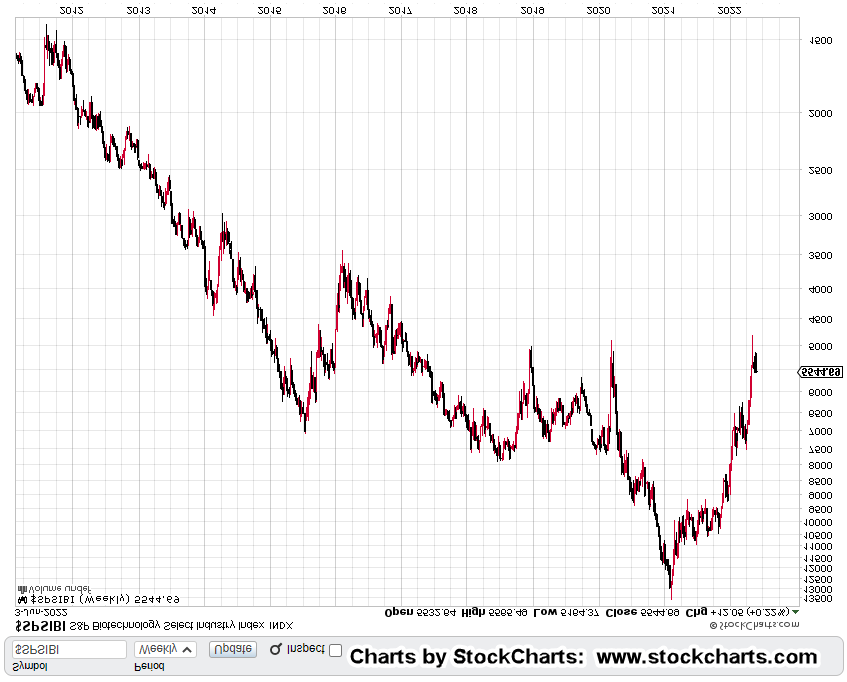
SPBIO, 3X Leveraged Inverse, LABD
Un-marked chart
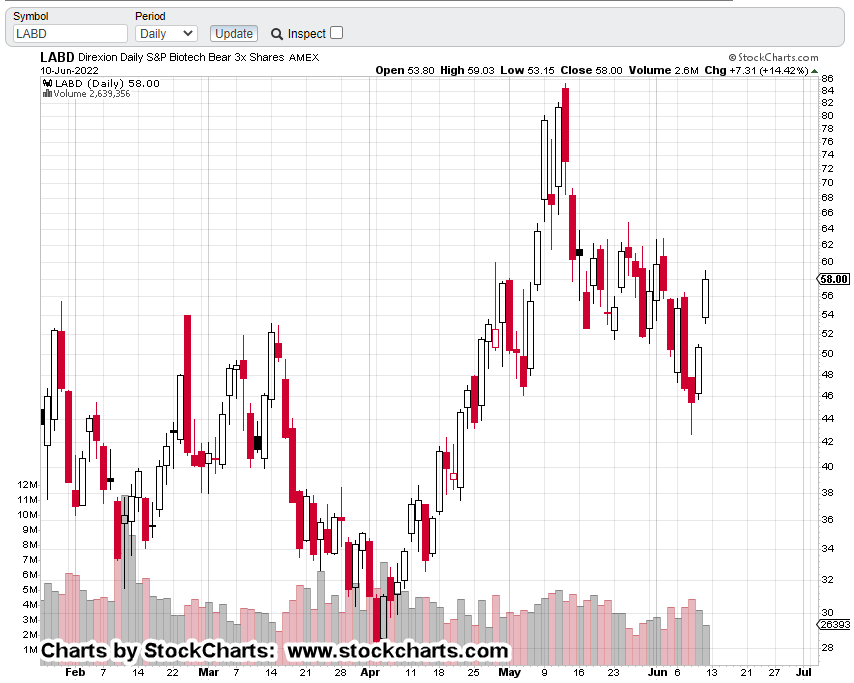
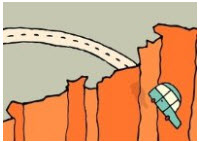
Potential zone for oscillating price action.

Now, adding the trading channel, we see the possibilities.

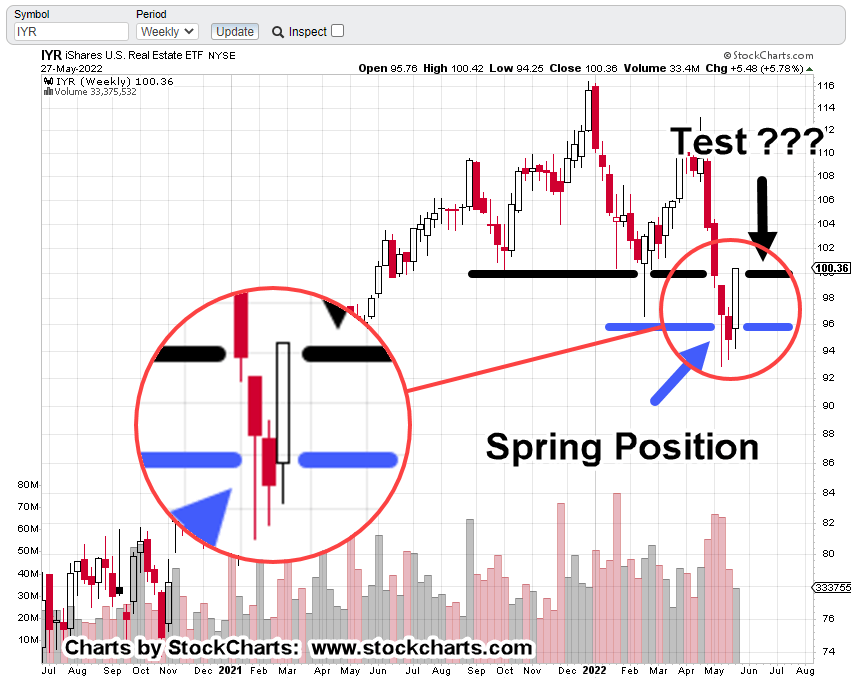
In the coming week, there’s also the potential for a ‘test’ where SPBIO, rises and LABD, declines.
However, from an empirical standpoint, when a Friday has a violent down move that closes near the low, it increases the odds for downside follow-through the coming Monday.
Positioning
The data below is taken from one of the accounts trading this market. It’s provided as a courtesy; showing entries and exits as the trade, LABD-22-03, unfolds (not advice, not a recommendation).
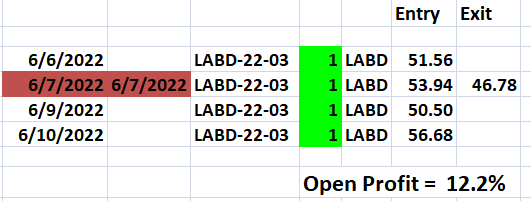
The expectation is for price action to allow the position to be increased based on more biotech downside.
With the Fed meeting due up this week, it’s going to be interesting.
Stay Tuned
Charts by StockCharts
Note: Posts on this site are for education purposes only. They provide one firm’s insight on the markets. Not investment advice. See additional disclaimer here.
The Danger Point®, trade mark: No. 6,505,279