Note: Posts on this site are for education purposes only. They provide one firm’s insight on the markets. Not investment advice. See additional disclaimer here.
Bonds (TLT) reversed on 9/17/24, the day before the Fed ‘cut’ and never looked back.
Rates continue to rise.
Meanwhile, real estate (IYR), has been whistling past the graveyard; that is, until now.
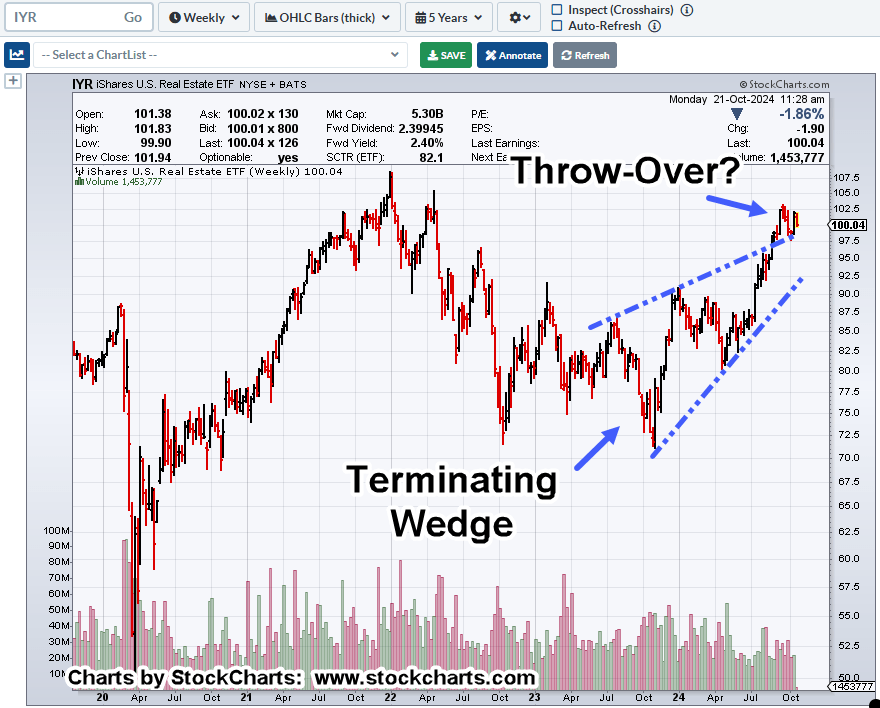
Real Estate IYR, Weekly
If the wedge is in-effect and we’re in a throw-over about to return into the pattern, it signals a very bearish condition (not advice, not a recommendation).
Even the illustrious financial press is starting to catch on that something’s not quite right. 🙂
Of course, you have to ‘subscribe’ for information like this.
As for this site, the current (bond) reversal was first identified and discussed, here.
Back then …
“Looking at the Fed calendar, link here, it’s a very interesting date; ‘the day after’ November 5th.
Let’s see if the ‘rate cut’ is immediately reversed (not advice, not a recommendation).”
Note: Posts on this site are for education purposes only. They provide one firm’s insight on the markets. Not investment advice. See additional disclaimer here.
Did we just have the largest bull trap in market history?
Now, after the bulls (may) have been caught off-guard, we have this; the specter of ‘deflation‘ and demand destruction.
Last Tuesday’s CPI report provided a backdrop for the continued squeeze higher.
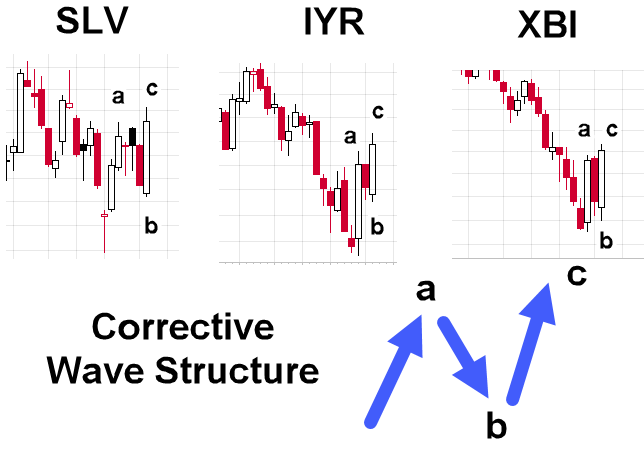
Over the past several weeks, at least three markets have developed the same (bearish) ‘look’.
They’re posting corrective ‘a-b-c’ price action, going against the main trend.
SLV, IYR & XBI, Weekly
Take a look, all similar in their formation.
Positioning
As of the close on Friday, I have positioned short in all three markets (not advice, not a recommendation).
The IYR short was initiated this past Wednesday, the Silver short on Thursday, then just minutes before the close on Friday, the biotech short.
Trades are labeled as SRS-23-04, ZSL-23-01, LABD-23-13
Next Steps
The coming week is likely to see one, or a variation of the following: all trades stopped out, one or two trades with discretionary exit, then followed by potential concentration on the best candidate.
Note: Posts on this site are for education purposes only. They provide one firm’s insight on the markets. Not investment advice. See additional disclaimer here.
Note: Posts on this site are for education purposes only. They provide one firm’s insight on the markets. Not investment advice. See additional disclaimer here.
We all know something’s coming; we just don’t know what.
A century ago, Livermore said, ‘surprises typically come in the direction of trend’.
Back in August, this update said if certain conditions were met (trend breakdown), then real estate has ‘enormous downside potential’.
Since then, events have unfolded to increase the probability of downside for IYR (not advice, not a recommendation).
The weekly chart of IYR spells it out. We’re in a (potential) massive downside trading channel.
Real Estate IYR, Weekly
From the left side low (October 2022), to the right-side test two weeks ago, is Fibonacci 55 weeks, plus one week; well within an acceptable margin of error for timing.
Anything can happen and IYR could somehow power higher into more testing or a channel breakout.
Until then, positioning in this sector remains as follows (not advice, not a recommendation).
Positioning
The current short position via Leveraged Inverse Fund SRS, is identified as SRS-23-03.
Note: Posts on this site are for education purposes only. They provide one firm’s insight on the markets. Not investment advice. See additional disclaimer here.
The position stop has been moved from SRS 18.70 to SRS 19.25, with today’s low of SRS 19.79, as a discretionary stop (not advice, not a recommendation).
Note: Posts on this site are for education purposes only. They provide one firm’s insight on the markets. Not investment advice. See additional disclaimer here.
As we’ll see in the chart below, from a trading standpoint, we’re at The Danger Point®
Price action closed the week hovering just below resistance in what looks like a sharp short-covering rally.
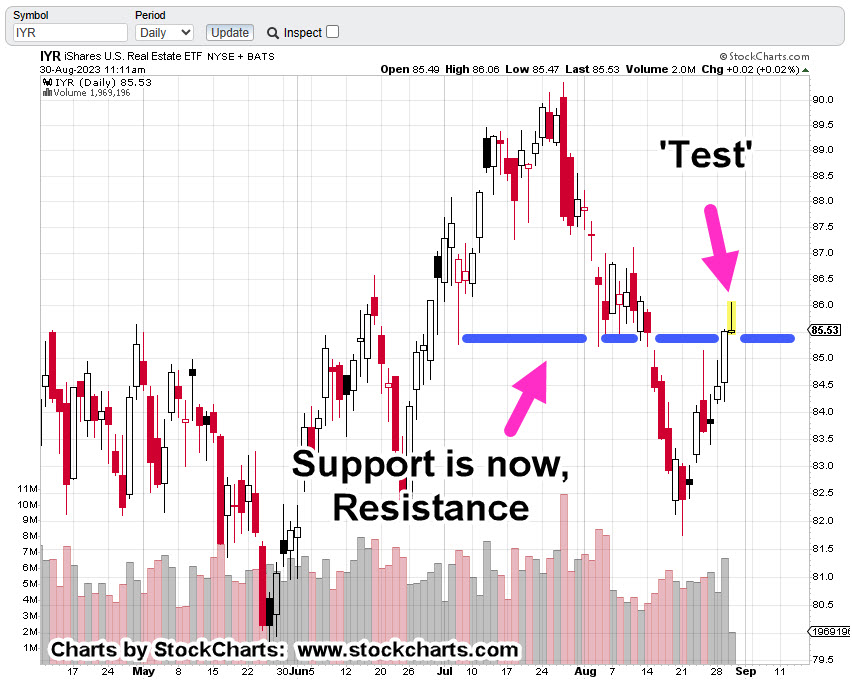
Real Estate IYR, Daily
As shown, a short position was opened via Leveraged Inverse Fund SRS, as price action was backing away from the blue-line resistance area (not advice, not a recommendation).
We’ll find out at the next open, if going short was a good idea or not. 🙂
The important part is, we’re at resistance.
If IYR, is to continue to rally, it would probably need to spend time at that resistance absorbing all the sellers.
If so, that gives the speculator a hint, higher prices are ahead and to exit the trade (not advice, not a recommendation).
Note: Posts on this site are for education purposes only. They provide one firm’s insight on the markets. Not investment advice. See additional disclaimer here.
Back in August, this post identified the potential for a long-term breakdown in real estate, IYR.
Since then, IYR broke its trendline.
As of today, we have a potential test of that break.
Real Estate IYR, Weekly Close
The chart shows the breakdown from the wedge and now, an underside test.
Subsequent updates will get closer-in on the action (daily chart) to show the breakdown and test.
Positioning
Right around mid-session, IYR price action appeared to be making its highs. At that point, a short position via Leveraged Inverse Fund SRS, was initiated at SRS 19.02 (not advice, not a recommendation).
Trade identification is, SRS-23-03.
The stop has yet to be determined (will be set next session) but is likely going to be today’s SRS low @ SRS 18.70 for a ‘risk’ of about, 0.32-pts.
Note: Posts on this site are for education purposes only. They provide one firm’s insight on the markets. Not investment advice. See additional disclaimer here.
‘Professionals don’t look for the challenge, they look for the money’, Dr. Alexander Elder
Right now, the ‘challenge’ is AI; bull or bear, who’s right?
We even have a bearish article out on SeekingAlpha. That means, the sector will probability go higher from here. 🙂
I wrote for SeekingAlpha years ago; had tens-of-thousands of views on my work; was somehow, never paid a dime.
The editors eventually told me, identifying potential market turns to-the-day, was “not suitable” (that’s a real quote) for their readers … so, there’s that.
Follow The (Nat-Gas) Money
Meanwhile, a potential significant reversal was identified in Nat-Gas, link here. So far, it’s progressing under the radar.
Entries have been made in UNG, at 6.64, 6.75, 6.86, 6.89, with a hard stop moved up to UNG 6.71 (not advice, not a recommendation).
Next, we have a potential reversal in Real Estate.
Real Estate IYR, Daily
Price action’s now at Fibonacci Day 8, from the low on August 21st. In addition, it’s at the 50%, retrace level from the high on July 27, to the aforementioned low.
We’re in a high, potentially, soon to be much higher, interest rate environment.
The (Interest Rate) Black Swan
The general public and investing professionals alike, think as the economy tanks, the Fed will lower rates.
It’s a widely and strongly held belief. After all, it’s always worked that way.
What if it doesn’t happen this time.
The economy tanks and rates move even higher?
it’s a possibility to consider.
Positioning
As one might guess, I’m already short this sector via DRV (not advice, not a recommendation).
Entries were made yesterday and today at DRV 48.42, and 47.66 respectively.
Hard Stop, is at the session low of DRV 47.00 (not advice, not a recommendation).
Note: Posts on this site are for education purposes only. They provide one firm’s insight on the markets. Not investment advice. See additional disclaimer here.
Note: Posts on this site are for education purposes only. They provide one firm’s insight on the markets. Not investment advice. See additional disclaimer here.