The forecast chart has been annotated to show where price action is now.
Biotech (SPBIO), and inverse fund LABD, are in a deep test. A little deeper than expected … but not enough to invalidate the set-up.
As of this post, price action is near the support line that’s just below the “Test” label.
Of course, the expectation is for this test to hold and for LABD to reverse back higher into the dynamic move shown; not advice, not a recommendation.
Fundamentals:
It seems like each day provides new insight into the disaster that is biotech.
This just out:
If you have been injected, The Red Cross says your blood is not wanted; your antibodies have been destroyed.
Note: Posts on this site are for education purposes only. They provide one firm’s insight on the markets. Not investment advice. See additional disclaimer here.
First, the daily chart with the familiar trendlines
The magenta arrow shows, down-thrust has diverged. Today closed lower but thrust energy was (nearly) nonexistent.
The right side trend is still unknown.
More contact points are needed. However, inverse fund LABD has shown consistent trend angles (above) at various points throughout its sideways, corrective move.
Taking the SPBIO hourly chart and inverting, gives a more accurate picture; we see the Wyckoff set-up:
This type of price action is high probability. Not perfect, but still potentially 75% – 80%, effective or higher.
The fact that inverse tracking fund LABD accelerated upward into the close adds weight, we’re potentially at the end of the correction.
The fundamental backdrop continues to implode.
The plan for world control (through speck injected depopulation) is out in the open now. No doubt.
Amandha Vollmer has this update on the decades long, mass hypnosis.
Note: Posts on this site are for education purposes only. They provide one firm’s insight on the markets. Not investment advice. See additional disclaimer here.
Note: Posts on this site are for education purposes only. They provide one firm’s insight on the markets. Not investment advice. See additional disclaimer here.
Then, way back to “Reminiscences“, published in 1923.
As a reminder, we’re looking at biotech (SPBIO) from the perspective of being short the market.
The primary vehicle for that short, is highly leveraged inverse fund, LABD.
The last update gave a hint at the desired timeframe.
If the markets are in the process of reversing, ultimately going to the long awaited (since 2009), final draw-down (i.e. crash), then a likely bottom would occur where they (almost) always occur; during the third week of October.
In a nutshell, that’s the time frame.
Conversely, price action is the final arbiter. If biotech winds up effectively saying ‘not now’, well then, it has the final say.
Back to ‘Entries & Exits’.
One of the traders highlighted in the book (in addition to Weis), was William Doane; former Head Technician for Fidelity.
His timeframe is much longer than the typical market participant. He, like Weis are looking at monthly, quarterly and yearly charts.
That fact in and of itself, provides an edge.
One of the main take-aways from his section was (paraphrasing):
‘The first correction is the hardest. If you can get through that, it’s typically smooth sailing from then on’.
The biotech short via LABD (not advice, not a recommendation) may be at that point now. Painful to watch but necessary.
Next, we go to ‘Reminiscences’.
Those who have read the book, know all about ‘Turkey’; Mr. Partridge.
As the book states, he was much older than the rest who frequented the brokerage. Also, he did not appear to be that active in the markets (thus minimizing his transactions). He was interested in the big move.
The admonition from Partridge, was: ‘Don’t lose your position’. Don’t exit out, expecting a pull-back … that ultimately never comes.
So, we have two examples; three if you include Weis that begin from the very long time-frames and work inward.
Now, on to the market:
The long term, Quarterly analysis has already been done; linked here.
The chart in the link, is from last quarter and since then, (during this quarter), we’ve made new lows.
On the fundamental side, evidence is building by the day on what the ‘speck’ protection is all about.
If you’re really interested in the big picture, here’s a link to a five-plus hour presentation that spells it all out.
Momentum indicators MACD, on the Monthly and Weekly remain in a downtrend.
Using IBB, as the proxy for Quarterly momentum (not enough data for SPBIO), the indicator is flat.
Momentum’s in favor of (maintaining) a short position; not advice, not a recommendation.
The monthly chart of SPBIO (inverted), has price action coming back to former resistance (now support). This is normal market behavior.
Recall, that on the downside, if there is some kind of ‘event’, markets can slice through apparent support levels with ease.
With that in mind, on the inverted chart above, the next major ‘resistance’ level may or may not be of consequence.
Summary:
Each trading week is important.
However, next week will likely a pivotal one; providing more information on whether to maintain short or exit and stand aside; not advice, not a recommendation.
Stay Tuned
Note: Posts on this site are for education purposes only. They provide one firm’s insight on the markets. Not investment advice. See additional disclaimer here.
Note: The last two links do not verify the veracity of the referenced material. Be advised.
Momentum is building for some kind of ‘tipping point’.
We may be there now.
We’re looking for an avalanche of reports whose combined (fundamental and technical) effect is catastrophic implosion of the biotech sector.
Market Analysis:
The chart speaks for itself. It’s obvious biotech has reversed and could be in serious trouble.
The inverse fund LABD is up a stiff 10.5%, as of this post:
We may or may not have a trading channel as shown.
The right side trendline will need more confirmation. As always, anything can happen and the nascent move could fall apart.
However, what is known:
SPBIO’s (and LABD’s) pivot was called ‘to the day’.
The “Iceberg” notation references this report, where the probability of SPBIO downside at that juncture was presented.
That analysis was correct. SPBIO never looked back.
Positioning:
Our ‘project’ position remains open (not advice, not a recommendation). The correct stance under current circumstances is to let price action take LABD higher.
As Livermore said nearly a century ago, the hard part now is to ‘sit tight’. Let the market determine when the move has ended.
Note: Posts on this site are for education purposes only. They provide one firm’s insight on the markets. Not investment advice. See additional disclaimer here.
No-one in the inflation camp wants to hear that … it’s uncomfortable to face the potential of being so wrong.
Albeit wrong in the short term but probably right later … after it’s too late. More on that farther down.
Just like the lazy (and complicit, we might add) financial journalist publishing the standard (speck blaming) propaganda for the day, so too are the hyper-inflationists, jumping on the most popular bandwagon in town.
Not even considering the potential for a retrace; admittedly, which could be short and sharp but significant nonetheless.
This site has presented several times, we’re in a situation similar to that of Genesis 41. It’s the corn and grain first … then gold and silver.
Just to back that up a bit before getting to the charts, we have the following:
Those so focused on stacking metals will likely be using that stack to pry much needed food, food staples, seeds and fertilizer out of the hands of those not willing to sell … at any price.
Why are the oligarchs not worried about the ‘little guy’ stacking metals?
Because there’re going to make it irrelevant … at least for just long enough to completely bankrupt, starve or ‘inject’ the middle class.
Moving on to the charts:
The title header said ‘big picture’. Here we are with monthly gold charts going back to the 1950s, time-frame.
It’s been a long … long bull market. It appears to have made a top at ~1,972 and is retracing … if only just a bit.
The second chart is the one that gives us pause. Consider the potential for a more substantial pull-back.
Markets like to retrace and test. It’s what they do.
That second chart is scary. It’s plain, the 760 – 780 area is a long time (monthly) support level that goes all the way back to 1980.
Absolutely no-one expects, or is planning for gold to get back to $800/oz, or lower.
Think of the irony. The ‘stackers’ (and maybe the rest of us), having to exchange actual money, gold and silver, for worthless fiat just so they/we can buy food to stay alive.
After the middle class stackers have exhausted their metals hoard, that’s when gold and silver will launch into the next bull phase.
It has been done this way (keeping the peasants under control), literally for millennia. The method works … why change?
Summary:
The intent here, is to at least recognize the possibility for the above scenario. It’s clear and becoming more clear every day, food is the weapon of choice.
The objective is to have enough food ahead of time; be in position to take advantage of once-in-a-lifetime metals prices should that opportunity be presented.
Note: Posts on this site are for education purposes only. They provide one firm’s insight on the markets. Not investment advice. See additional disclaimer here.
Time and technical have come together; indicating potential downside collapse in biotech.
Collapse potential is immense and has been for years.
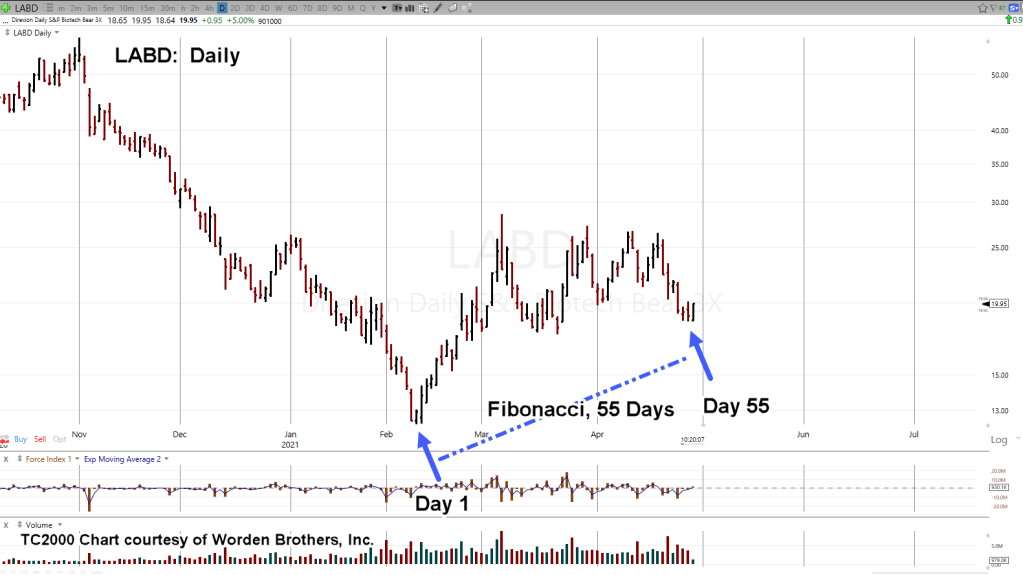
Fibonacci 55 days after the 2/10/21, highs, biotech (SPBIO), pivots decisively lower.
Of all the major indices, biotech on a percentage basis, is the downside leader.
Rightly so.
Fundamentally, it’s poised to disintegrate with its illegal, Mengele style campaign of medical experimentation.
Who knows if that full disclosure will happen.
The ‘controllers’, the oligarchs, may come up with some other mechanism to usurp the media, the internet and keep it all under wraps.
However, it looks like the tide’s turning.
Remember, the market leads the news; not the other way around.
If biotech goes into its well deserved collapse, downside action itself will be the catalyst for exposure.
For now, SPBIO is pivoting lower; LABD higher.
The daily chart of LABD shows the Fibonacci time relationship. From low to low; Fibonacci 55 days.
Yesterday, the 28th, was Day 55.
Today, LABD has already posted a new daily high … weighting probability to more upside (SPBIO, lower).
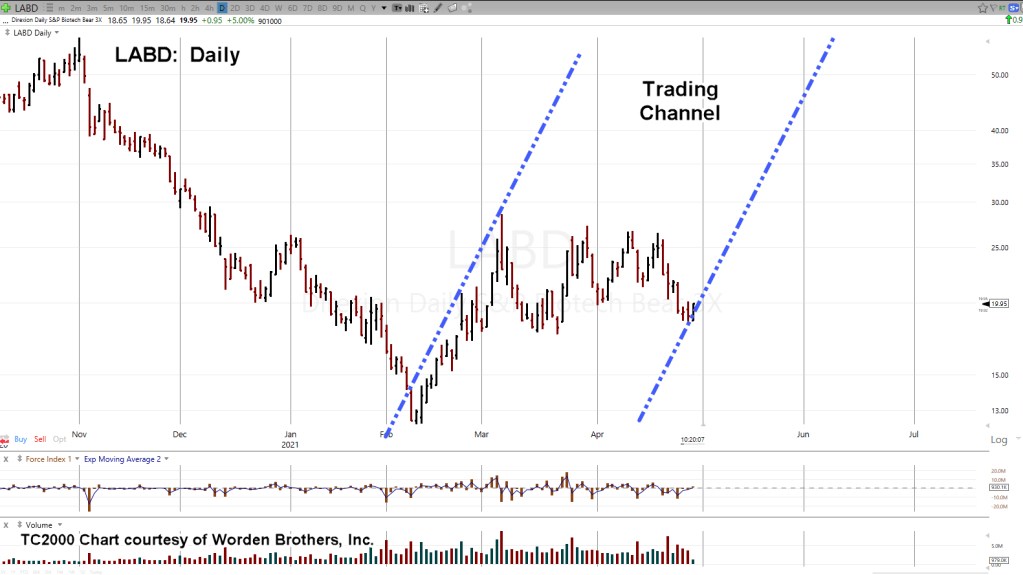
The next chart has the potential trading channel.
It looks aggressive.
However, the market itself has defined the trend.
Shown, in pervious updates, this trend angle has been repeated at least four times from March 5th, LABD high, to yesterday’s low.
It’s no guarantee. We’ll let subsequent price action confirm or negate the right side trend.
As of this post, LABD continues to push aggressively higher.
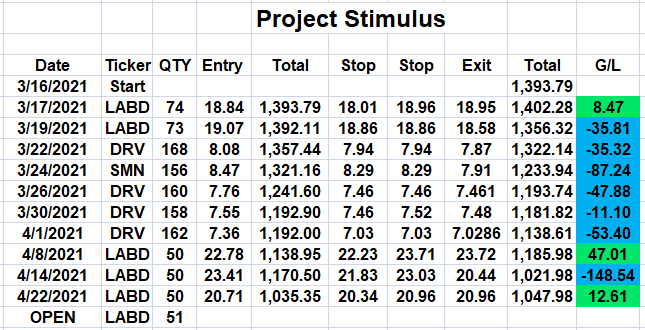
Our ‘project’ has an open position in LABD.
Without revealing specifics of that position (discussed previously), it’s represented in the table below:
Note: Posts on this site are for education purposes only. They provide one firm’s insight on the markets. Not investment advice. See additional disclaimer here.
It’s mid-session; Amgen (AMGN) is down 7.6%, after a poor earnings report.
The last update on AMGN, linked here, had this to say:
AMGN peaked three days later.
The chart below shows it was a Fibonacci 34-days from the 3/4/21 low, to the 4/21/21, high.
On the fundamental side, we have this explanation for the breakdown.
Missing from the earnings report, not only is customer traffic less this past quarter, it’s going to get (if our research is accurate) a whole lot less as customers literally die-off en masse.
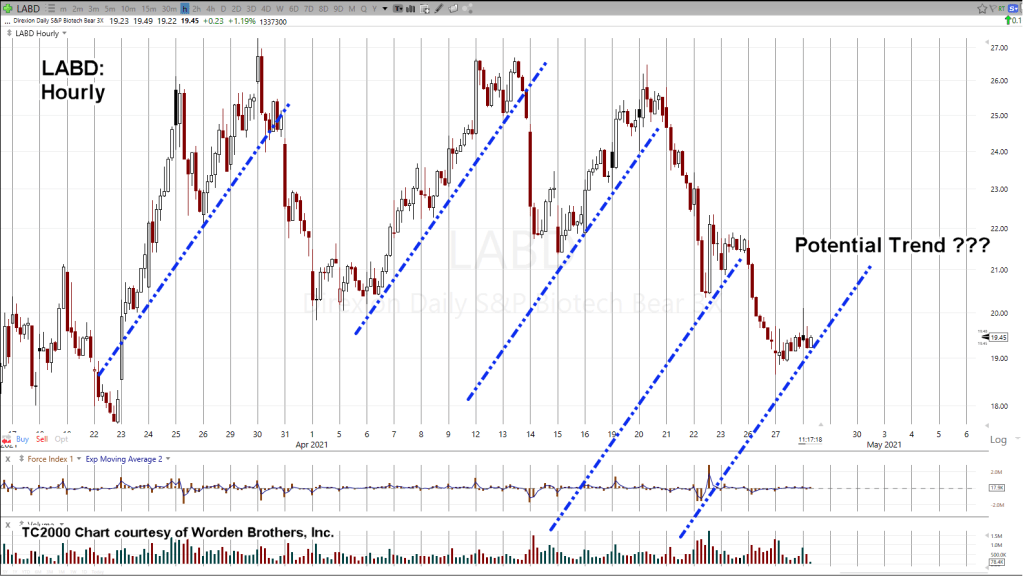
Moving on to biotech SPBIO and 3X inverse, LABD:
As shown in a prior update, LABD has repeating trendline characteristics.
Hourly chart of LABD, below:
We’re still very early at the right side of price action to identify a trend.
However, it’s good to know what LABD ‘likes’ and expect that behavior again.
The daily chart is updated with the Fibonacci 34-day time-frame discussed previously. We’re still within acceptable time error for a potential channel.
If LABD does not reverse significantly higher from here, that potential channel will likely be negated.
Summary:
Linked here, is an article just out on ZeroHedge. It discusses the ‘complacency’ of the market and how it’s ready for a long lasting reversal.
Buried within the report (and claiming ‘fair use’ to quote) we have this nugget:
Note: Posts on this site are for education purposes only. They provide one firm’s insight on the markets. Not investment advice. See additional disclaimer here.
Whether or not we’re in the times of the mark (and whether the speck protection is the mark) is of course, debatable.
However, with even a cursory look around, we can see the great deception and the great falling away.
Personally, I presented years ago to family members, that ‘the church’ has become so corrupt, when the time comes, they’ll be the ones distributing the mark.
There’s literally going to be hell to pay for those complicit in this evil.
In a very small way, this site’s doing its part to separate from the complicit; find and walk the narrow path; get the word out.
Back to biotech: Technical and fundamental:
Fundamental:
Obviously, the case against biotech continues to build.
There’s now a site that’s been created to track and document speck related information.
Some of the doctors referenced yesterday (time stamp: 13:32), have started a database cataloguing adverse reactions. Nobody else is doing it. Certainly not big pharma.
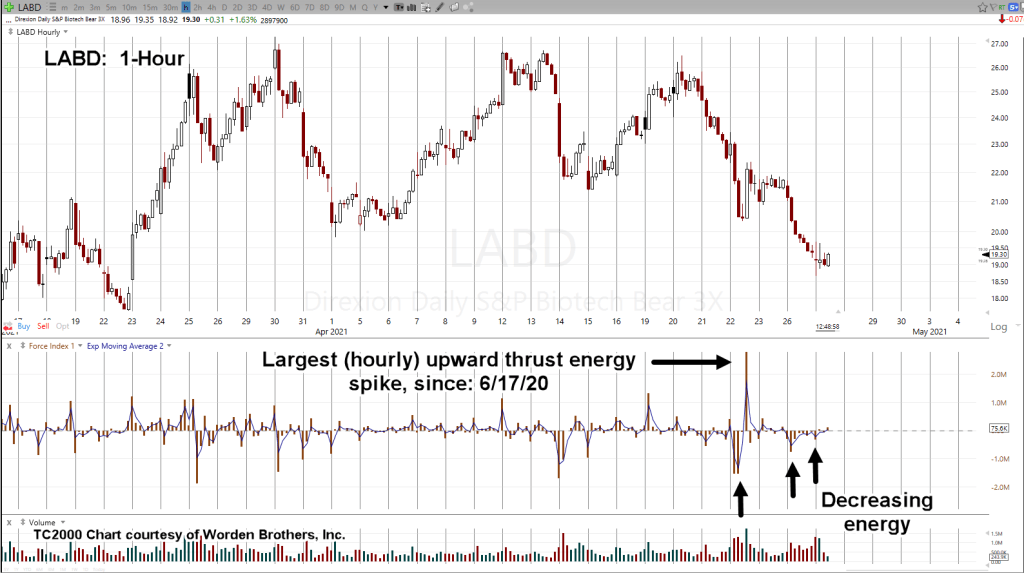
LABD (3X inverse SPBIO) downside thrust energy has eroded significantly.
That’s in addition to the largest hourly upward thrust energy spike for LABD since before June 17th, of last year.
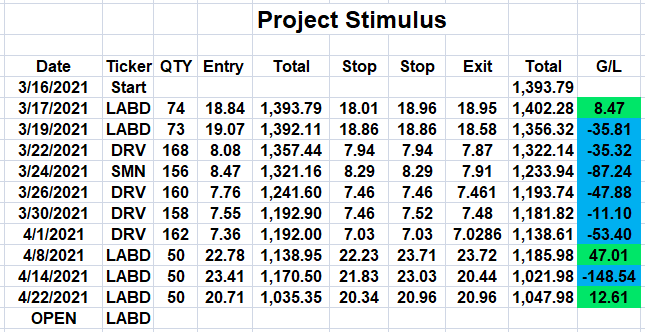
Project Stimulus:
Mentioned yesterday, the format of the updates are being changed.
In a cue taken from Dr. Elder about discussing open trades (i.e. not to), at this point, only closed trades will be discussed in the project.
By presenting specific (time, entry, stop, etc.) details on a market action and/or position, that in itself will affect the outcome.
Any engineers reading this will need no further explanation. For more info reference this link.
We’ll leave it with … there’s an open position in LABD. Detail of that position will be discussed when it’s closed.
Thank you,
Stay Tuned
Note: Posts on this site are for education purposes only. They provide one firm’s insight on the markets. Not investment advice. See additional disclaimer here.
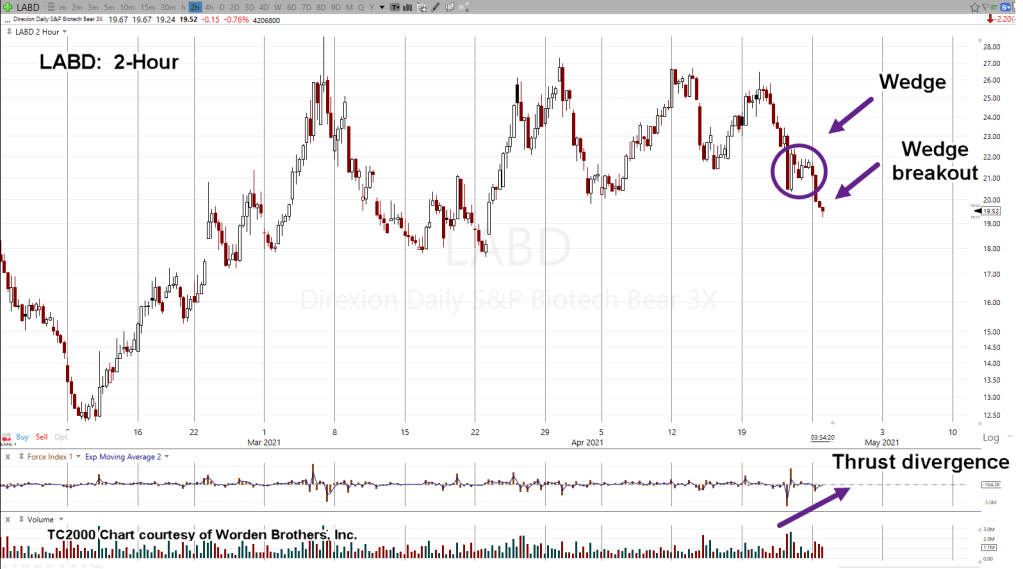
Inverse fund LABD breaks out from a wedge pattern (to the downside) on reduced thrust energy.
Has this downside (upside for biotech SPBIO) reached exhaustion?
The 2-Hour chart above shows drastically reduced thrust (volume-price) energy to the downside. In addition, a wedge is typically the last formation at the end of a move.
Price action is the final arbiter. We won’t know if SPBIO will resume its downtrend (LABD higher) until there’s a definitive reversal.
Early action stopped out the ‘project’ position with a small profit as shown in the table:
We’re going to make changes on how the trades in the project are shown; more on that later.
Fundamentals:
The speck injection horror show continues with this 1-hour, 20-minute meeting of internationally acclaimed medical physicians.
You’ll never seem them on the mainstream.
The bottom line is those who have received the speck protection are a threat to the well-being of everyone else.
Some of the physicals have discussed potential action such as quarantine (or visual identification) of those who have received this so-called protection.
That’s right, it’s the people who have subjected themselves to the gene altering therapy that are now the potential threat.
Possible remedial actions are discussed. The video is a must see.
Stay Tuned
Note: Posts on this site are for education purposes only. They provide one firm’s insight on the markets. Not investment advice. See additional disclaimer here.