… And Other Lies

It’s been a busy pre-market session; currently, 8:48 a.m., EST.
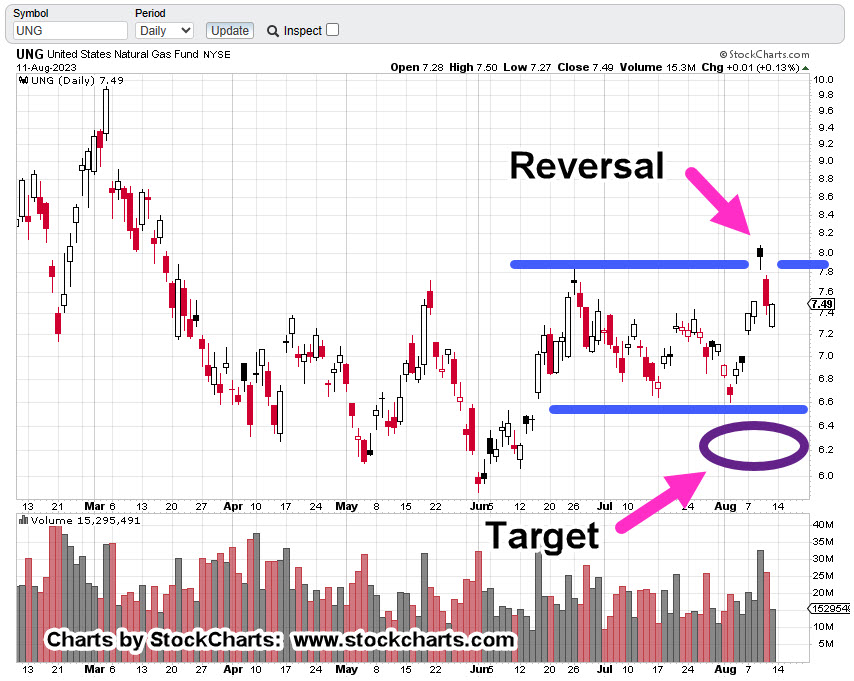
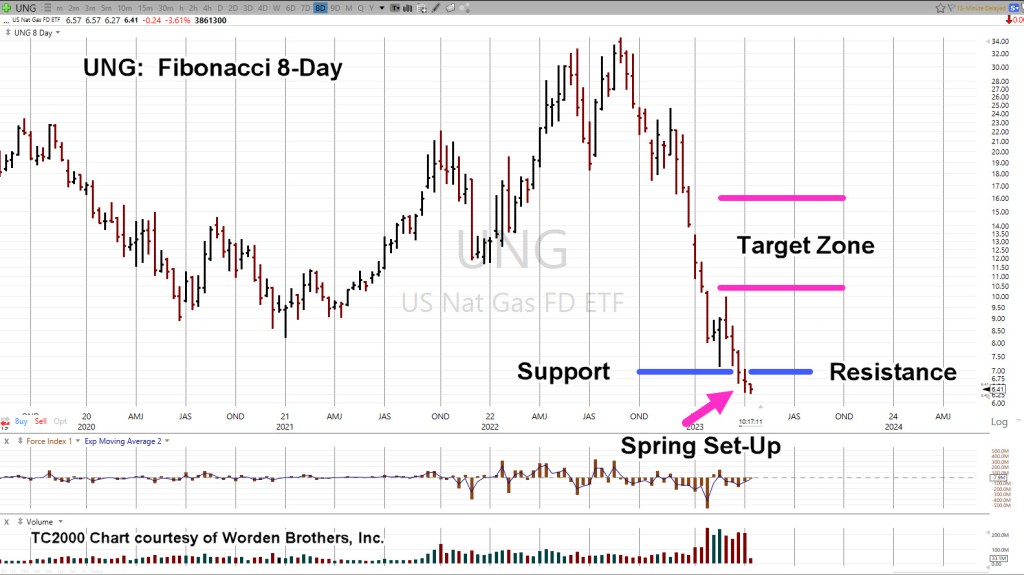
At yesterday’s evening open of the nat-gas futures (NGV23), it was decided to exit the UNG, position in the Tuesday pre-market, at the earliest possible (not advice, not a recommendation).
That exit was completed @ UNG 6.74
With that done, the focus tuned to the semiconductors.
Early this session (we’re still in the pre-market), the short position was increased via SOXS. Hard Stop remains at SOXS 8.97 (not advice, not a recommendation).
The ‘Strong Economy’ Backdrop
All of this positioning is taking place in the middle of a storm of propaganda.
It’s non-stop; every day, another pile of lies.
For just a hint of truth, check the links here and here.
U.S. food distributor stockpiles are dwindling rapidly (reference links above and more on that channel).
The big corporations are already getting ready for the next ‘We’re all in this together’, planned event as The Speck attempts to make its return.
Charts to follow.
Stay Tuned
Charts by StockCharts
Note: Posts on this site are for education purposes only. They provide one firm’s insight on the markets. Not investment advice. See additional disclaimer here.
The Danger Point®, trade mark: No. 6,505,279