Gold Bulls … Stage Is Set

Dollar’s Absent From The Show

To get the gold bulls in a hypnotic trance, thinking $3,000/oz. is just around the corner, the appropriate press releases need to be created.

As if on cue, reported by Jerimiah Babe, big names are coming out to say ‘hyperinflation’s’ a sure thing.

If it’s not happening now (as we speak) it’s bound to happen very soon.

In fact, just look at the prices (time stamp 1:30). Those price increases are proof.

Never mind the hundred or so ships off CA, or even the containers just happening to ‘slide off’ into the sea.

But wait, what about the fire?

No manufactured (um, sorry ‘supply chain’) crisis would be complete without a fire.

However, there’s a problem with all this hypnotizing the masses to hyperinflation.

That problem is … the dollar’s not playing along.

Dollar, UUP Analysis:

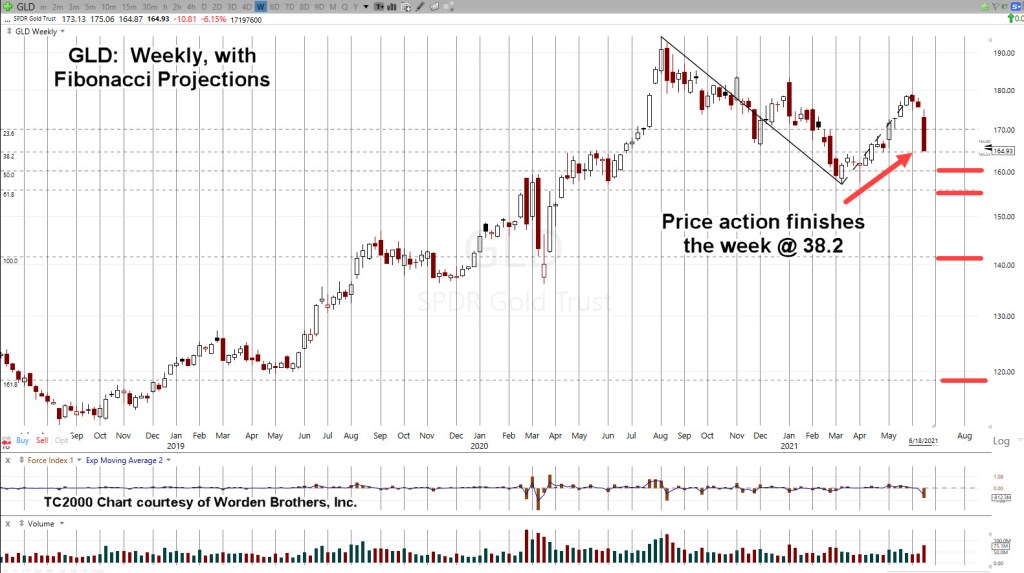
In fact, the dollar is showing significant strength.

It’s right at Fibonacci 23.6%, retrace (very shallow) and appears ready to move higher.

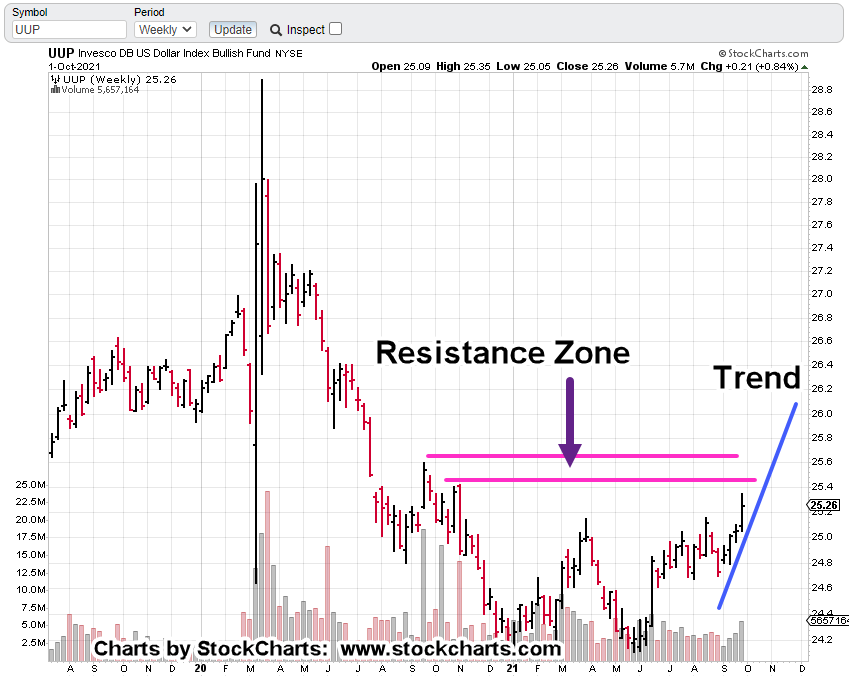
The weekly chart of UUP, is below and includes the Fibonacci levels.

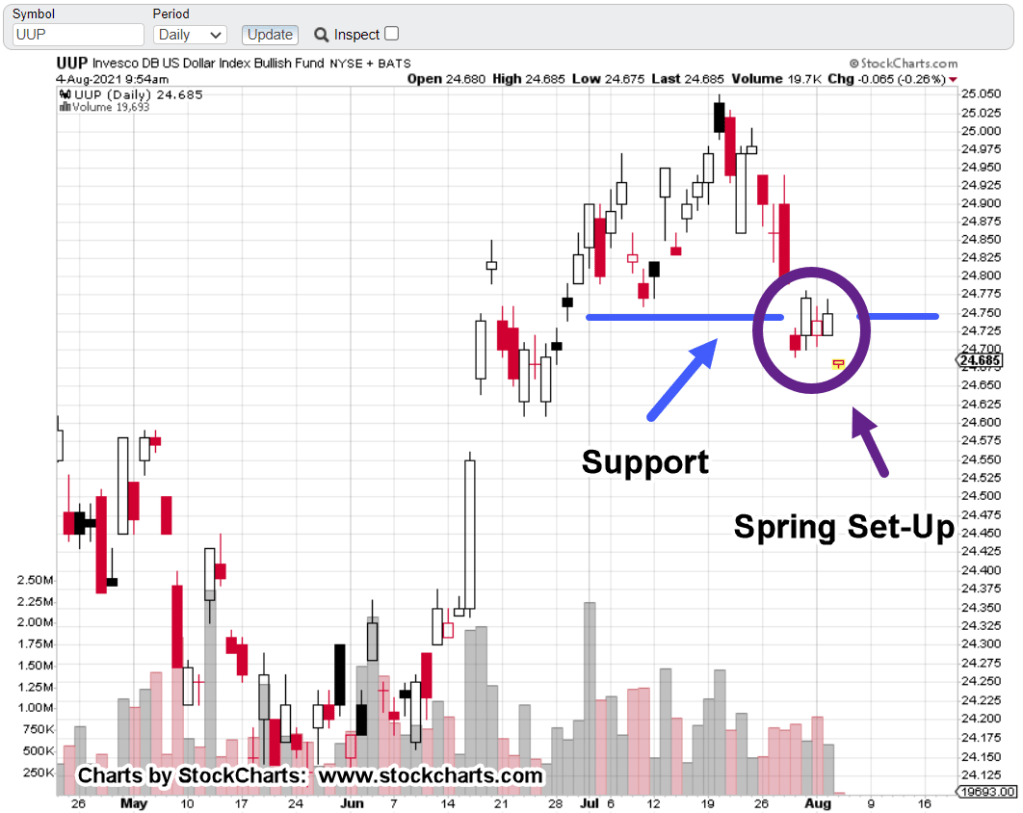
The next chart expands the last few weeks to show contact with the 23.6%, line and what looks like a nascent move up:

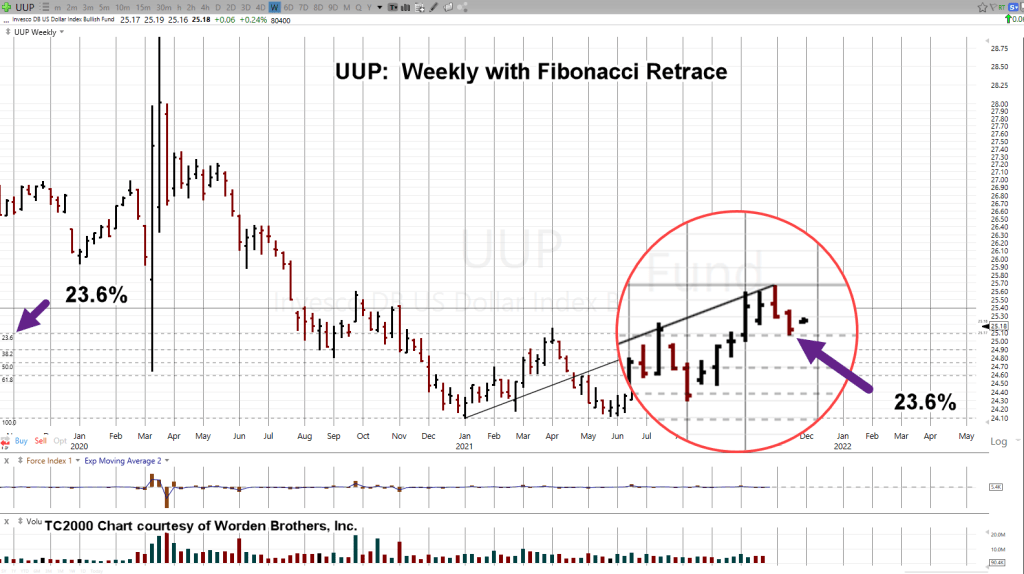
If UUP manages to make a new weekly high above last week’s 25.24, level, we have confirmation it’s attempting to continue the reversal and up-trend.

That reversal started way back at the beginning of this year.

This is what was said back then when the dollar looked poised for imminent collapse.

If gold and the dollar are still inversely correlated, the dollar appears ready for an upside breakout; obviously, a breakout higher would then put down pressure on gold.

Gold (GLD) Reversal:

Five weeks ago, the potential for a significant gold (GLD) reversal was discussed at this link.

That idea was updated last Friday at this link.

Then, over the weekend we’ve discovered one other analyst coming up with their own version.

At this juncture, GLD continues to ratchet higher to the 171 – 175 target area.

That move’s happening along with the requisite press generated hysteria … helping lead the bulls to a potential last stand.

Stay Tuned

Note:  Posts on this site are for education purposes only.  They provide one firm’s insight on the markets.  Not investment advice.  See additional disclaimer here.

The Danger Point®, trade mark: No. 6,505,279

The Dollar Ruse

What if it’s all a lie?

It seems that its been going on forever we’ve heard phrases like: ‘dollar destruction’, ‘gold’s going to $10,000,/oz’., ‘rampant inflation’, ‘hyperinflation’ and on.

What if (speculated in yesterday’s post), it’s all a lie?

It takes a very flexible mind (technically termed, “neural plasticity”) to be able to wrap itself around and understand the diabolical agenda being played out before us.

The good news is, Wyckoff analysis cuts through all the lies.

Now past a century old, this technique has stood the test of time.

Which brings us to the dollar.

Dollar Destruction: Just Another Lie

Reminder: Way back in late December of 2020, was the first bullish update on the dollar.

The next chart shows UUP, may be in a trend and just about to contact overhead resistance.

We’ll investigate further how UUP behaves if and when it gets into the resistance area.

One thing about the dollar that’s obvious from the chart, it’s not going down.

At this juncture, there’s no dollar destruction.

The dollar and gold are still inversely correlated.

That means continued downward pressure on the metals and upward pressure on the dollar.

Stay Tuned

Charts by StockCharts

Note:  Posts on this site are for education purposes only.  They provide one firm’s insight on the markets.  Not investment advice.  See additional disclaimer here.

Dollar Destruction? Not Yet

Before The Open

‘Dollar Destruction’ To Be Postponed

Hyper-Inflation Not In The Charts

Who looks at the actual chart anyway … so old-school.

However, what that school is telling us, the dollar’s built a solid base for a sustained rally.

Then we have this: Uneducated Economist gives us links in his report on why dollar demand could increase substantially.

If dollars are going up, gold is going down.

At this juncture, there’s still an inverse correlation.

Position Update:

On a separate but related note, the FDA announcement from yesterday was not taken into account with the biotech plan. An error if you will.

The level of malfeasance as detailed in this link was not thought to be possible.

The Project Stimulus account exited the short biotech trade with a small gain as shown below.

More analysis to come on a potential long-term biotech reversal set-up not unlike the dollar.

For now, we’re out.

Stay Tuned

Charts by StockCharts

Note:  Posts on this site are for education purposes only.  They provide one firm’s insight on the markets.  Not investment advice.  See additional disclaimer here.

Gold (GDX) About to ‘Free Fall’?

What A ‘Surprise’, If GDX Breaks Down Into A Collapse

Gold and the dollar are still inversely correlated.

The dollar developed a bullish set-up starting around May, of this year.

Since that time, its been in rally.

The last update on the dollar was this one, August 4th. Indeed, the dollar has continued its move higher.

Since we have negative correlation, gold and the miners have moved lower.

Each sector is now at a critical juncture:

A resistance area in the case of UUP and support (blue line) in the case of GDX.

The market has alternated (weekly GDX, above) from choppy overlapping moves, to smooth downward thrusts.

If GDX breaks substantially lower, get ready for cries of ‘manipulation’ and ‘it’s all rigged’.

Possibly more important, such a downdraft may cause an instant change in market sentiment; from ‘risk on’, to ‘risk off’.

In that case, a market’s that’s well positioned to head decisively lower, the fastest, is biotech, SPBIO.

Stay Tuned

Charts by StockCharts

Note:  Posts on this site are for education purposes only.  They provide one firm’s insight on the markets.  Not investment advice.  See additional disclaimer here.

Gold, mini Flash-Crash

10:23 a.m., EST

Livermore:

‘Surprises are in the direction of trend’

The following quote is from this past Saturday’s update:

“It’s no secret, price action in GLD and the miners (GDX, GDXJ), has been analyzed for months as bearish.

The weekly chart shows GLD, right at the edge of a terminating wedge; about to break lower:”

Then, we can also add this quote from the GDX Short Sell, Set-Up:

“This site’s not part of the hyperinflation crowd. It’s too easy to jump on the bandwagon, get the clicks and then say it’s all ‘manipulated’ when price action does not follow the narrative.”

A firm foundation has already been laid; a bearish case for gold (the miners and silver) that includes the inverse correlation of a bullish dollar.

Both moves are currently underway.

Steven Van Metre, followed-on; highlighting the bearish gold set-up in his ‘Sunday Night Charts‘ update.

As is typical, there’s a small cadre that can see what’s happening. They are somehow able to ignore the constant media hype; positioning accordingly.

The original weekly chart of GLD below, is followed by today’s update:

Updated chart:

Typical market behavior is to break through the trend (for however long) and then come back for an underside test.

It seems that anything related to the gold (silver) markets is an overcrowded trade. There are too many rabid bullish fanatics.

We’ll stand on the sidelines for this one (not advice, not a recommendation).

Stay Tuned

Charts by StockCharts

Note:  Posts on this site are for education purposes only.  They provide one firm’s insight on the markets.  Not investment advice.  See additional disclaimer here.

Dollar, Set to Rally

10:20 a.m., EST

UUP, In Spring Position

The long term bullish work on the dollar (UUP) has already been completed.

The last update posted on June 19th, is here.

That update contains the quote below along with a link to an earlier report:

“The updates on the dollar have proposed, since the bullish divergence (now turned rally) is on a longer, weekly time frame, the ensuing move could have the potential to carry the index UUP, to the top of the trading range shown here.”

Since the June report, the dollar has rallied as expected.

At this juncture, it’s hovering just below support and in spring position … potentially building energy for another leg higher.

Today is Fibonacci Day 12, from the July 20th, high.

UUP could still post a new daily low at the next session (to get to Day 13) if the spring set-up is viable.

The dollar and gold are still inversely correlated.

If UUP rallies from here, expect a corresponding decline in gold and the gold miners.

Stay Tuned

Charts by StockCharts

Note:  Posts on this site are for education purposes only.  They provide one firm’s insight on the markets.  Not investment advice.  See additional disclaimer here.

Gold, Dollar: In Tandem

Dollar Rally, Gold Rout

Markets Remain Inversely Correlated

First, let’s start with a review of the dollar reversal.

Back in early May, this report pointed at the possibility for a bullish set-up in the dollar.

That type of head’s up gives one time to investigate the correlations.

Correlations like, ‘is gold still inversely correlated to the dollar (and bonds)?’

Over the weeks as the set-up unfolds, confirmation or negation can be added by observing price action.

By the time we get the dollar penetrating support levels, we have gold at interim highs.

In fact on June 9th, the day the above ‘penetration’ report was posted, gold (GLD) had already reached its peak and was in a reversal.

Five days later (before the major down-move), this report was published on gold.

Therefore, at this juncture, we’re still inversely correlated.

So, what does that mean?

The updates on the dollar have proposed, since the bullish divergence (now turned rally) is on a longer, weekly time frame, the ensuing move could have the potential to carry the index UUP, to the top of the trading range shown here.

Then, what happens to gold?

If the negative correlation remains intact, gold gets whacked.

The weekly chart of GLD (above) has the index closing right at the Fibonacci 38.2%, projected level.

Wide bars tend to get tested. There could be some kind of rally in the coming week but it’s not required.

The Fibonacci projections highlighted as the orange bars, go all the way down to 161.8%. That’s equivalent to GLD at ~ 118.65, or the futures market somewhere around $1,300 – $1,350.

With the Dow 30, (DIA) penetrating and closing below the 336, support levels on Friday, we have a Dow Theory Sell Signal (not advice, not a recommendation).

The markets appear to be rolling over.

The last market reversal in February – March, of last year, had GLD dropping over – 14.5%, in two weeks.

Fast forward to now; GLD, is already down over – 15.2%, from its August 2020, highs.

Stay Tuned.

Note:  Posts on this site are for education purposes only.  They provide one firm’s insight on the markets.  Not investment advice.  See additional disclaimer here.

Update: Dow Theory, ‘Sell’

9:05 a.m., EST

Dow 30 (DIA) breaks trendline

Price action declining towards support

Price action rolls over and in the process, breaks the uptrend.

The prior update, had this link to an explanation of the sell signal (not advice, not a recommendation).

The sell signal is confirmed if/when the support at the dashed line is penetrated with a close below that line.

Summary:

The markets were volatile yesterday with sharp moves in the dollar, gold and the gold miners.

Pre-market action has gold (GLD), continuing sharply lower; – 4.1 points, or – 2.37%.

Inverse GDX, gold miners DUST, is trading higher as well; up about + 1.1 points, or + 6.65%.

For those monitoring this site on a regular basis, none of the above is a surprise.

We’ve been reporting on the pending dollar reversal for weeks; how gold (and silver) still appear to be inversely correlated.

Stay Tuned

Charts by StockCharts

Note:  Posts on this site are for education purposes only.  They provide one firm’s insight on the markets.  Not investment advice.  See additional disclaimer here.

Dow Theory Sell & Gold

9:23 a.m., EST

Dow Theory; Sell signal nears

Gold, in Wyckoff ‘Up-Thrust’ reversal

Even though the current environment is anything but traditional, the report at this link shows how close the market is to a Dow Theory sell signal.

It could be. Even with valuations and markets at never before seen extremes, the traditional theory will still hold.

Wyckoff analysis, developed during the same time as Dow (published in 1910), does not concern itself with ‘valuations’.

That’s the key

Wyckoff discovered early on, that ‘markets have an energy of their own’.

This ‘energy’ has nothing to do with valuations.

Gold (GLD) has been discussed several times over the past few weeks; that it has stalled and in potential reversal.

The weekly chart shows the blue line resistance area. Price action has struggled at this location for weeks.

Now, with the market about to open, GLD is trading down a solid -2.5 points, or – 1.4%.

If that level is held to the open, it puts GLD below the June 3rd (weekly) low and below the resistance area.

With all the inflation, and hyperinflation talk, GLD has not made it to new highs.

Last week, the dollar reversal was confirmed with UUP posting a new weekly high. At the same time, weekly MACD confirmed its bullish divergence.

The stage appears to be set for some kind of surprise; in the markets, the dollar and gold.

Stay Tuned

Charts by StockCharts

Note:  Posts on this site are for education purposes only.  They provide one firm’s insight on the markets.  Not investment advice.  See additional disclaimer here.

Dollar Divergence: Update

2:37 p.m., EST

Dollar penetrated support and is reversing

Potential for sustained, persistent rally

Wide trading range

Looking at the weekly close chart, we can see the wide range.

In addition, there’s a significant bullish divergence that (technically) gives the dollar, UUP, enough energy to test the top of that range; a potential that’s completely opposite the current narrative.

A this juncture, silver, gold and the miners are still correlated.

Yesterday, a potential top and reversal in miners GDX, was identified. Today, it appears to be hovering and looking unsure of its direction.

GDX has not posted a new daily high or low as of this update.

A sustained dollar rally (along with the bond market?) would be unexpected given what seems to be apoplectic hyperinflation ranting.

Separately, in biotech, the market (IBB) has stalled to the upside in a higher than expected test. Inverse fund LABD, made a new daily low and it too, has stalled.

Downward thrust energy on LABD is dissipating.

Technical update for biotech, planned for tomorrow … market permitting.

Stay Tuned

Charts by StockCharts

Note:  Posts on this site are for education purposes only.  They provide one firm’s insight on the markets.  Not investment advice.  See additional disclaimer here.