Note: Posts on this site are for education purposes only. They provide one firm’s insight on the markets. Not investment advice. See additional disclaimer here.
Markets reverse in a typical way; first is ‘sentiment’, then ‘volume’, then ‘price’.
According to this link, looks like we have sentiment aplenty; evaporating sentiment, that is.
As stated by Mr. Fred Hickey, VC (Venture Capital) funding peaked last year and has dropped over 75%, since then; that’s the ‘sentiment’ part of the equation.
A partial synopsis of his interview, in the link above:
Time Stamp:
9:15, The greatest bubble I’ve ever seen
11:15, It’s all happened before
11:40, Narrowing market
11:55, Volume decline
16:30, Honeymoon phase is over
17:50, VC spending down 75%
18:05, Everyone knows it’s a joke (except, Wall St.)
And on it goes …
Where’s The Top?
From a Wyckoff perspective, using his analysis (here and here) as a basis of speculation, that’s the wrong question (not advice, not a recommendation).
If we’re expecting some kind of massive reversal (which we are), then the objective is to look for the weakest sectors, not the strongest.
Frequent users of this site already know that work’s been done. One of, if not the weakest sector(s), is Biotech (not advice, not a recommendation).
Is Today, The Day?
With that said, as this post is being created (1:20 p.m., EST), the sector at the center of bubble attention, the SOXX, may have just completed a wedge ‘throw-over’.
Semiconductors SOXX (ETF), Daily
Any number of scenarios can be in play.
At this point, the SOXX, may be in the process of validating the terminating wedge (not advice, not a recommendation).
As Fred Hickey said, it’s the biggest bubble he’s ever seen.
By the time it becomes obvious, it’s way too late for (low-risk) positioning.
Note: Posts on this site are for education purposes only. They provide one firm’s insight on the markets. Not investment advice. See additional disclaimer here.
When’s the last time you saw a P&F chart on any (other) website or YouTube, channel?
My guess … probably a long time ago, or never.
Even StockCharts, recently revamped their site, removing the landing page option for P&F. It’s still there, but you have to search to find it under ‘more tools’.
If we’re going to be using Wyckoff analysis to determine the most probable direction for the market (and how far it could go), then P&F analysis is part of that effort.
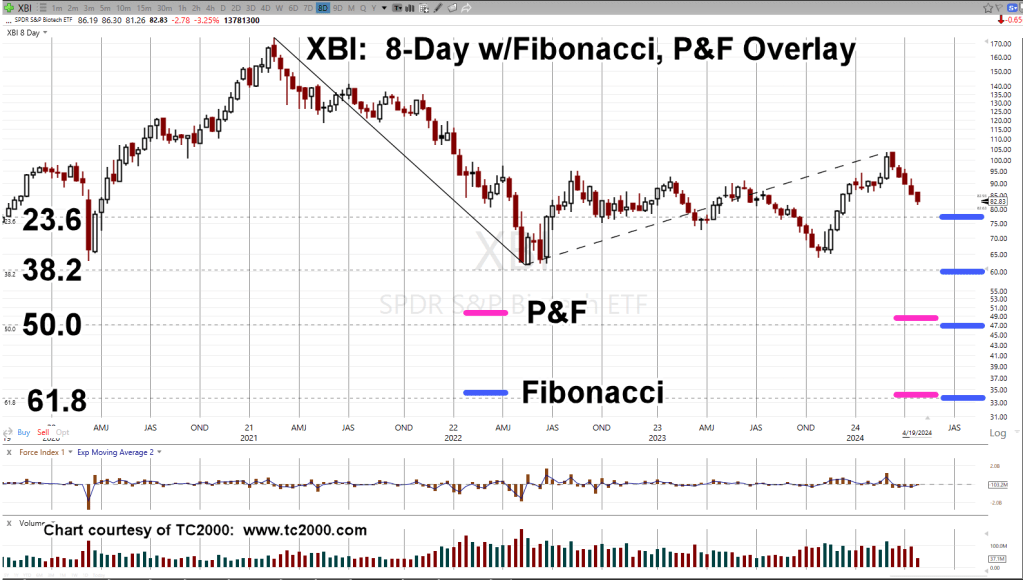
For our biotech example, XBI, we’ve used two projection methods to see where price action is likely to go if we have a sustainable downturn in progress.
Biotech XBI, 3-Point P&F
As a reminder, ‘3-Point’ means before an ‘X’ or ‘O’ is charted (for reversal), the index must move at least 3-points.
Based on the P&F action itself, we have a projection range (not advice, not a recommendation).
Now, comes the interesting part, Fibonacci projections.
Biotech XBI, 8-Day, w/Fibonacci
The Fibonacci projections are shown as the blue lines.
The P&F projections from the chart above, are overlaid as the magenta lines.
Of course, projections do not guarantee anything.
At the next open, XBI could launch itself into a upside reversal; not likely, but it could happen.
Wyckoff Cause & Effect
What we’re doing here, is adhering to Wyckoff discipline from his stock market course material (still available here).
No position, long or short is entered unless there is sufficient cause i.e., P&F count for a sustained move.
Note: I have no affiliation with the Stock Market Insitute and do not receive any compensation from them.
In the case of biotech XBI, above, it literally has spent years generating a P&F count; the ’cause’.
The ‘effect’, is the actual move; now potentially in progress.
Note: Posts on this site are for education purposes only. They provide one firm’s insight on the markets. Not investment advice. See additional disclaimer here.
Note: Posts on this site are for education purposes only. They provide one firm’s insight on the markets. Not investment advice. See additional disclaimer here.
In fact, Wyckoff’s stock market training course, first published in 1934, (still available), says that until you can ignore the financial press completely, ‘You will never be successful in the markets’.
Price action itself, properly interpreted, will tell you where to look for the opportunity.
The Ponzi Implosion, Cometh
The market is littered with Ponzi schemes. Some have already imploded, CVNA, HOOD, Crypto; some have not.
Concerning Crypto, here’s an excellent update from Michael Cowan. Buried in that update, at time stamp 4:58, looks like HOOD, may be in even more trouble.
Biotech is in a class of its own and was discussed in yesterday’s update.
For gold, we’re going to look at the Junior Miners GDXJ, and last week’s action.
Junior Miners GDXJ, Daily Close
The Junior’s are the weakest in the sector; therefore, that’s where we look for a short opportunity (not advice, not a recommendation).
To move higher, above resistance, normal market behavior, is to come back to the lower blue line (i.e., support) to gain enough energy to move higher for a breakout.
To move lower, normal market behavior, is to come down to the lower blue line as a test which subsequently fails; the move continues lower.
Either way, normal behavior at this juncture, is to move lower. We’ll see.
Now on to the chief cook and bottle washer … Tesla.
Tesla (TSLA), At The Edge
For starters, let’s recognize there’re a lot of moving parts; U.S. ‘parts’ and China ‘parts’.
If one’s going short, another task is to forecast under what conditions a short would have enough risk removed.
For that answer, oddly enough, we go to gold, GLD.
Gold GLD, Weekly: 2015 – 2017
GLD posted a massive upthrust above the blue line lasting over fourteen weeks before breaking decisively lower.
Then, it labored four weeks to come back up for a test.
After that, collapse; lower weekly closes for seven consecutive weeks.
In the chart above, the area identified as ‘Short’, has as much upside risk removed as possible, right at resistance.
Now on to Tesla.
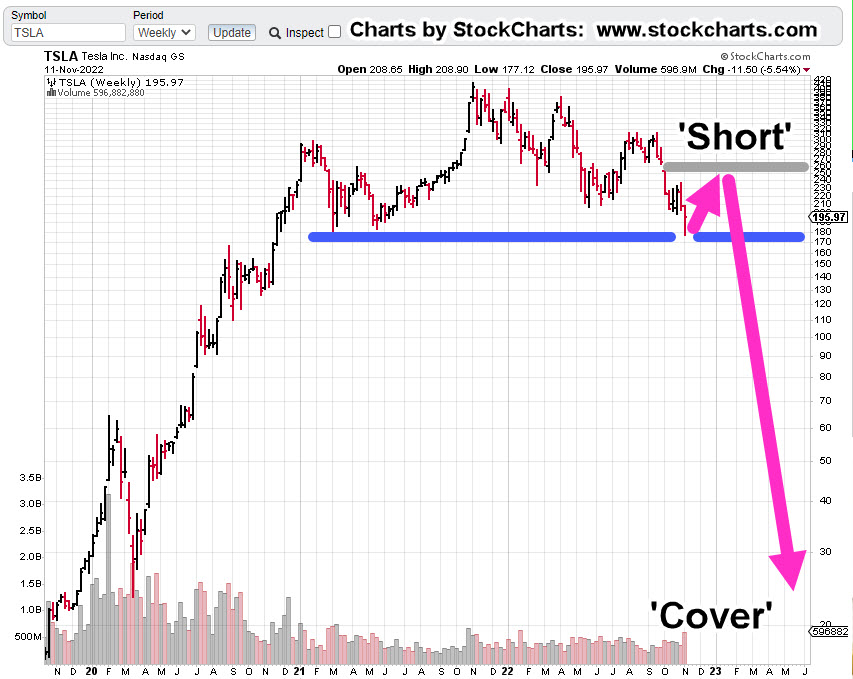
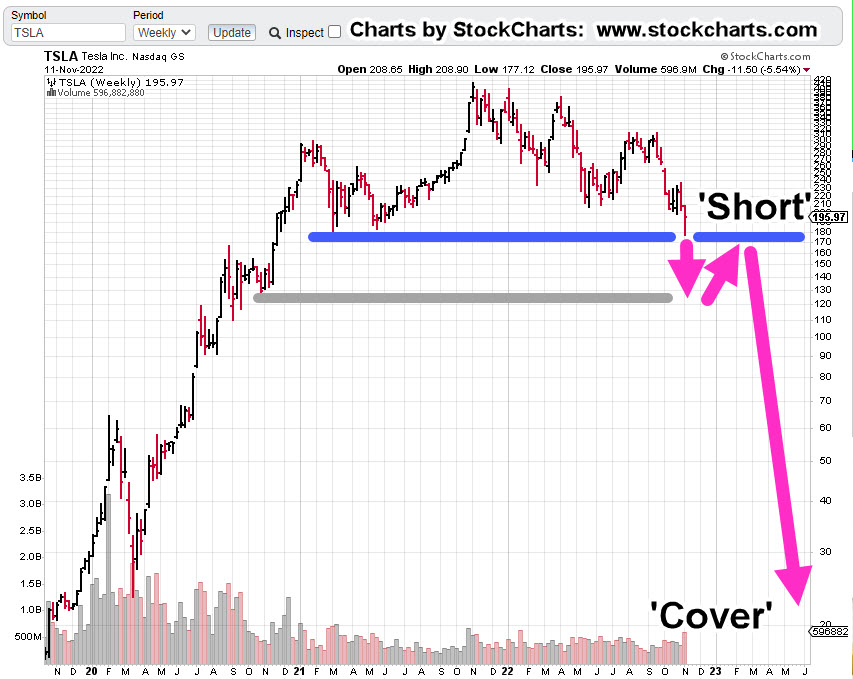
Tesla TLSA, Weekly
Two scenarios are presented where risk may be reduced.
Chart 1
Chart 2
One of these may happen or neither of them.
Either way, for risk to be reduced, a short entry is needed to be at a known resistance level (not advice, not a recommendation).
Let’s move on to the current positioning.
Positions: (courtesy only, not advice).
One of three events will happen at the next session.
1: Both positions stopped out
2: One position stopped out
3: No positions stopped out
Each outcome will provide a data-point where to focus (or not) in the current environment.
LABD-22-10:
Entry @ 18.1398: Stop @ 16.83
JDST-22-05
Entry @ 9.1666: Stop @ 8.79
Note: Positions may be increased, decreased, entered, or exited at any time.
Note: Posts on this site are for education purposes only. They provide one firm’s insight on the markets. Not investment advice. See additional disclaimer here.
Note: Posts on this site are for education purposes only. They provide one firm’s insight on the markets. Not investment advice. See additional disclaimer here.