While the media’s wasting no time setting up the average investor, for a ‘guaranteed skinning’ (as Dr. Elder used to say), providing an environment of constant, incessant, AI ‘get-in-now’, buy recommendations.
With that said, an ominous market sign has appeared.
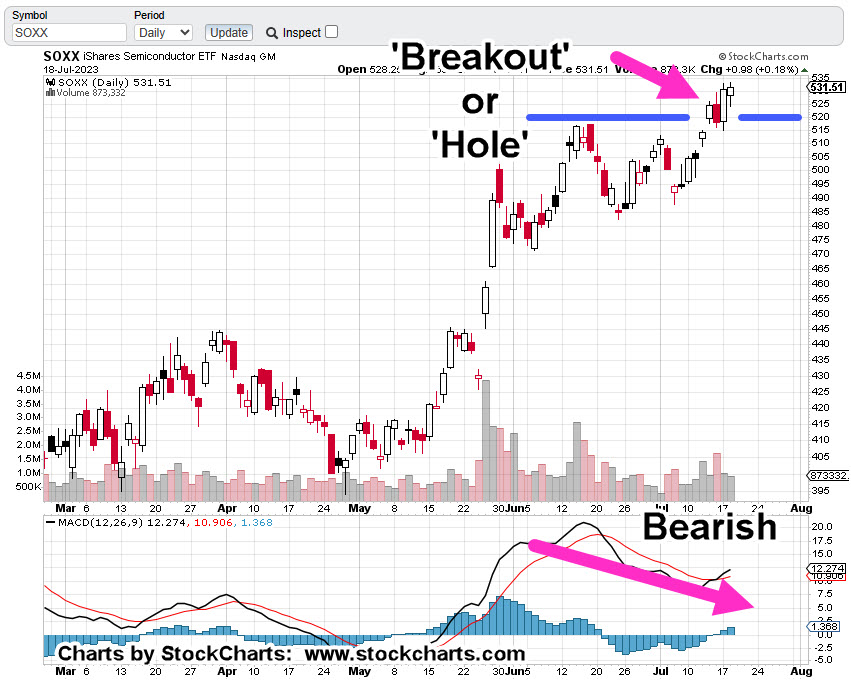
As the daily chart of SOXX shows, we either have a breakout or a hole that’s about to be filled (reversed).
Semiconductor Index SOXX, Daily
In technical terms, the SOXX is in Wyckoff ‘Up-Thrust’, reversal position (not advice, not a recommendation).
A tick lower in MACD, confirms the bearish divergence.
Then, there’s Fibonacci
Enter, The Count
When markets are in a mania, reaching insane extremes, it allows for a (more) clean print of either Fibonacci retrace levels or time correlation.
Decide for yourself if that’s the case now.
Remember, tomorrow (Wednesday) is the 19th, and one day before Taiwan (TSM) releases earnings.
That release is scheduled for the 20th before the open.
Note: Posts on this site are for education purposes only. They provide one firm’s insight on the markets. Not investment advice. See additional disclaimer here.
We’re going to start first, with this link, presenting the on-going fundamentals of the sector.
For those of us literally pulling their hair out, wondering if the dam is ever going to break, we have this link.
‘We’ve just poisoned 5-Billion people …’
Note: The dam break is the ‘event horizon’ where everyone collectively wakes-up. Once that happens, the ‘conspiracy’ has been proven as undeniable fact.
Biotech SPBIO, may or may not have an absolute direct connection with the aforementioned links but it’s the ‘baby with the bathwater’ response that’s expected.
Adding to that, big players in this sector have no P/E
The top-ten weightings keep changing, but the last time it was checked, none in the top-ten, had a P/E.
Since we’re working the short side, it’s the leveraged inverse fund LABD that’s of interest.
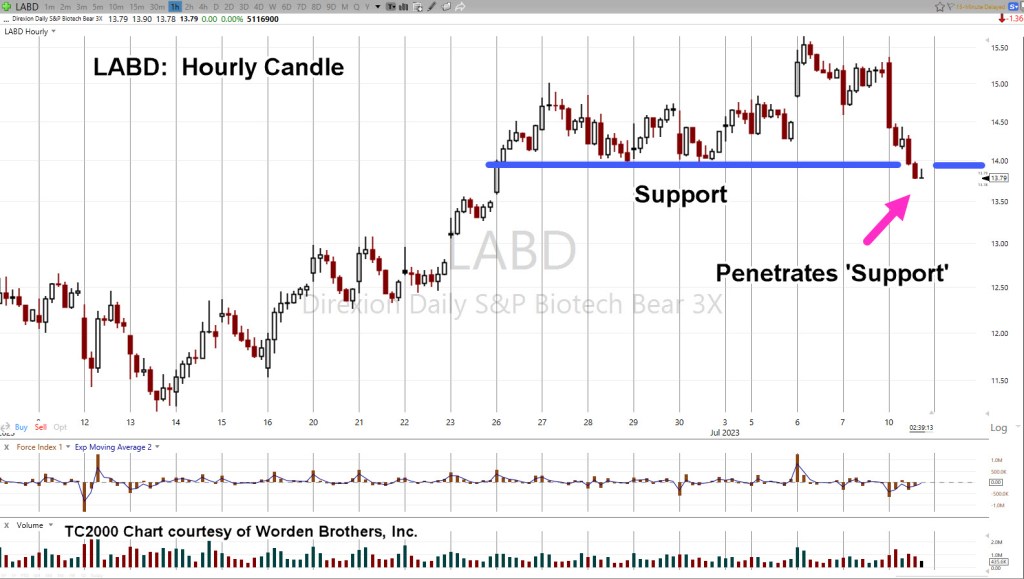
Biotech Leveraged Inverse LABD, Daily
Note the near perfect Fibonacci time correlation.
As of today’s close, price action on the LABD has got itself into a Wyckoff ‘spring position’ having decisively penetrated support (blue line), shown below.
That spring set-up has been accomplished on weak down-thrust when compared to the prior move lower.
We have a high probability of upside reversal, down for SPBIO (not advice, not a recommendation).
Positioning
Stated in the prior update, we’re short this sector (long LABD) and now have Hard Stop @ LABD 13.27 (not advice, not a recommendation).
Update: 7/13/23, 2:51 p.m. EST
LABD price action pushed to 13.26, just 0.01, below the above listed stop and is now moving higher.
Trade has been maintained (not advice, not a recommendation)
Note: Posts on this site are for education purposes only. They provide one firm’s insight on the markets. Not investment advice. See additional disclaimer here.
Note: Posts on this site are for education purposes only. They provide one firm’s insight on the markets. Not investment advice. See additional disclaimer here.
‘Real (market) opportunities are rare. When one is found, it must be used to its fullest extent’; Gerald M. Loeb, the late, and former Vice Chairman, of E.F. Hutton
What a refreshing quote that is, back in the day when we had ‘Chairmen.’.
So, are the Miners the Juniors GDXJ, that opportunity?
From a technical standpoint, there’s the bearish divergence on MACD when looking at the weekly. Then, we have Fibonacci correlation on the weekly as well (shown below).
The daily has the short entry signal given yesterday (not advice, not a recommendation).
Fundamentals Collapse
Next, we have industrial demand in collapse, not to mention the world economies. If industrial demand is collapsing for photovoltaic components (link here), then silver demand must be collapsing.
The ‘Gap’
The analysis was working fine in the pre-market for shorting the GDXJ (not advice, not a recommendation), but then at the open, there was the gap.
Let’s address that but first get started with the weekly chart of GDXJ
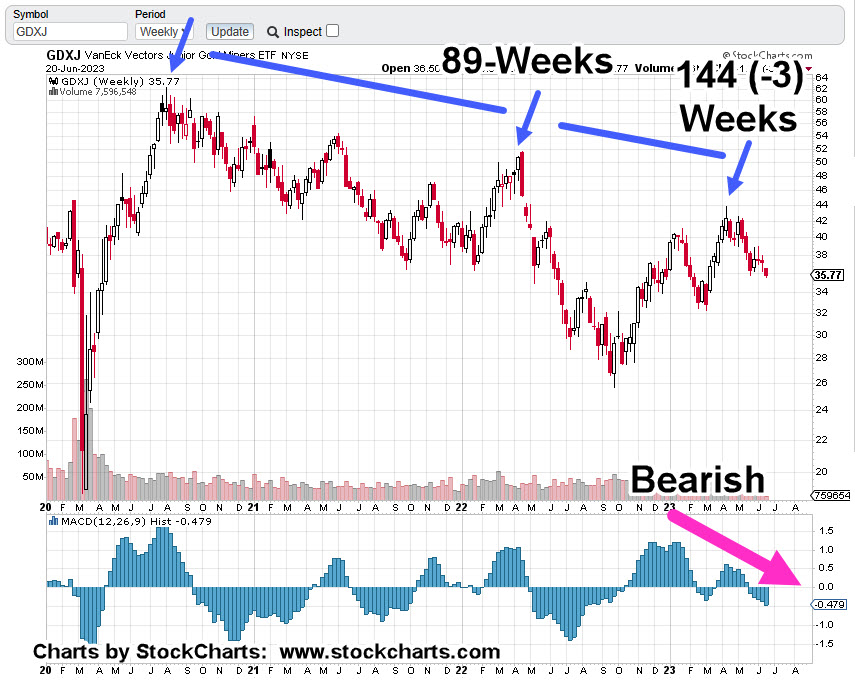
Junior Miners, GDXJ, Weekly
The technical details are clear: Bearish divergence on MACD as well as Fibonacci time correlation.
The original Fibonacci 89-weeks was covered in this post.
Yesterday, there was a gap-lower open and price action kept posting lower.
Will this gap be filled? That’s the question.
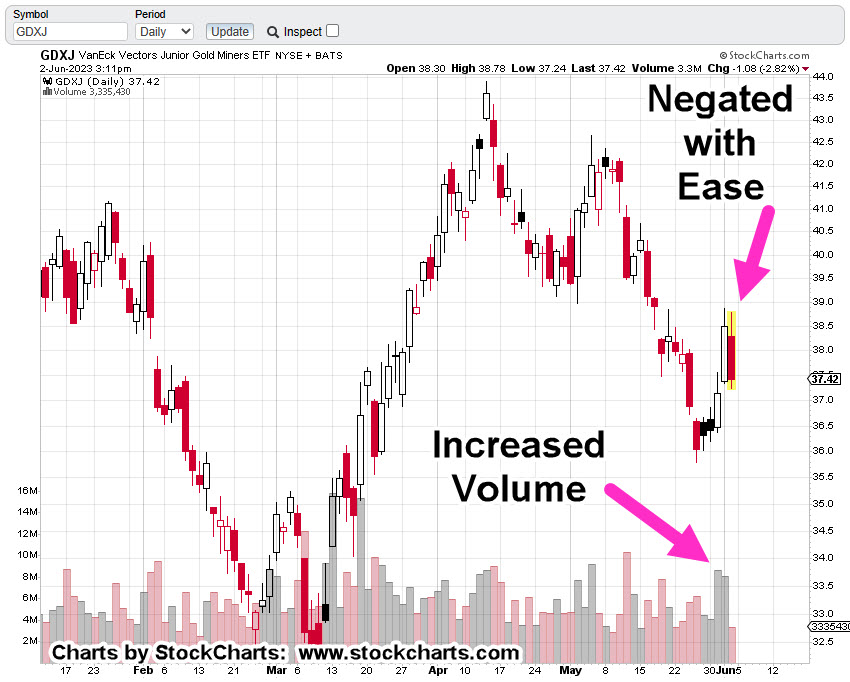
Junior Miners GDXJ, Daily
As the chart implies, was yesterday a breakaway gap?
Price action’s right at support … or slightly below, which technically put us in Wyckoff ‘spring’ position.
The ‘Probabilities’
Given the bearish overall condition of this sector both on a technical and fundamental basis, a gap-fill is unlikely … but one has to be prepared.
As stated in the last update, the short position via leveraged inverse JDST was increased (not advice, not a recommendation).
To account for possible gap closure on the inverse JDST, a soft stop (trader discretion) is at 6.80 and below, with an absolute hard stop (no excuses exit) at 6.38 (not advice, not a recommendation).
Note: Posts on this site are for education purposes only. They provide one firm’s insight on the markets. Not investment advice. See additional disclaimer here.
Beginning at time stamp 6:24, at this link, The Maverick goes through an investigation into NVDA, projections.
‘Something doesn’t add up here ….’
That report was three weeks ago. What’s happened, lately?
As of the close this past Friday, NVDA, the largest in the SOXX, was at $1.1-Trillion, market cap. A distant second, is Taiwan Semi (TSM) at $545.5-Bln.
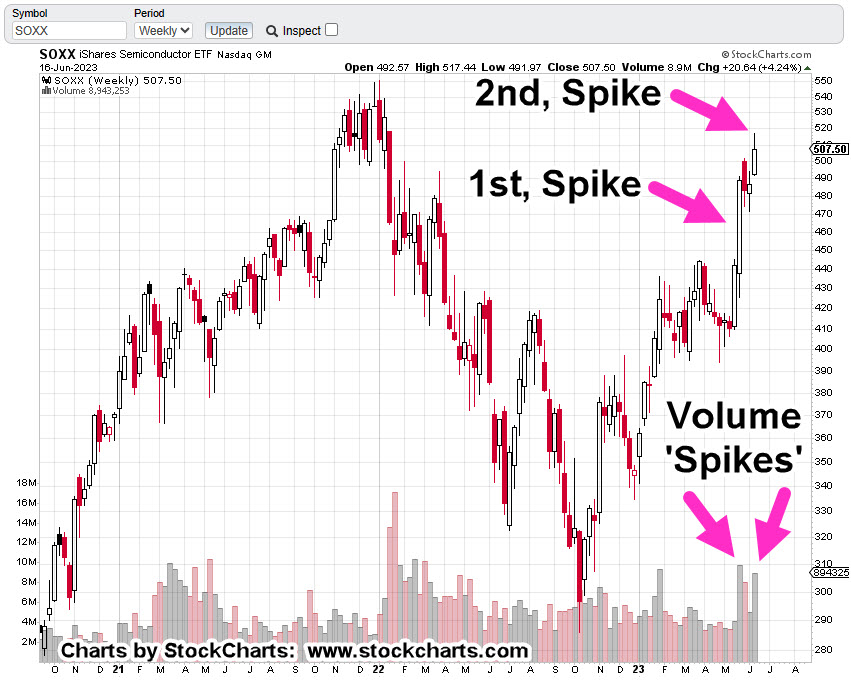
Below, we have a confluence of events for the SOXX.
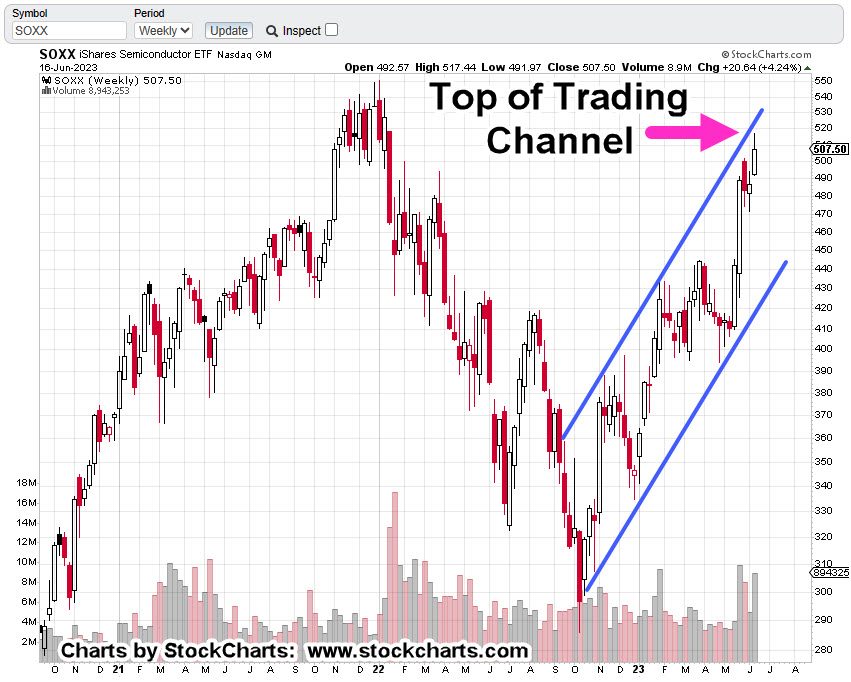
Semiconductor (ETF), SOXX, Weekly Candle
We’re at the top of a trading channel.
We’re in Wyckoff ‘Up-Thrust’ (reversal) position.
A lot of volume expended with less (net) upward progress than previous volume spike; ‘effort vs. reward’.
Getting down to the daily, we see a terminating wedge that’s coupled with reduced volume.
Semiconductor Index SOXX, Daily Candle
So, what does that mean?
The ‘probabilities’ for more upside are, or have been, reduced significantly (not advice, not a recommendation).
Note: Posts on this site are for education purposes only. They provide one firm’s insight on the markets. Not investment advice. See additional disclaimer here.
Early in today’s session, the Junior Miners GDXJ, posted a new daily low and new weekly low. That helps the downside probabilities (not advice, not a recommendation).
As mentioned in the prior update, when price action penetrates existing lows, there’s a good chance of ‘spring’ action as a result. The market attempts to rally.
Sometimes it’s successful; other times, not.
The attempt to rally after posting new lows is what GDXJ is doing now (as of 2:15 p.m., EST).
Junior Gold Miners GDXJ, Weekly Bar
In the weekly chart below, note how the close, then open, then close and then open again, are to each other.
That ‘narrowness’ signifies either resistance or support, in this case, resistance.
Where the sector closes for the day may an important clue if we’ll continue to the downside.
Note: Posts on this site are for education purposes only. They provide one firm’s insight on the markets. Not investment advice. See additional disclaimer here.
Note: Posts on this site are for education purposes only. They provide one firm’s insight on the markets. Not investment advice. See additional disclaimer here.
Note: Posts on this site are for education purposes only. They provide one firm’s insight on the markets. Not investment advice. See additional disclaimer here.
You would think with all the handwringing, mental machinations, ‘debt ceiling’, we’re all going bankrupt, YouTube gold grifters et al, gold (GLD) would be in a monstrous rally.
Instead, we have what appears to be exhaustion and non-confirmation.
Gold (GCM23), is the only monetary metal (gold, palladium, platinum, silver) anywhere near its all-time highs.
Old-timers would call it a huge non-confirmation. The other metals are not on board with the ‘inflation’ narrative.
Time and again, we’re back to actually reading price action and having it tell us what’s real, not the mainstream.
So, trading ‘kabuki’ seems to be straightforward; just read the chart. Here’s one explanation from an unlikely source on why that simple task is so difficult: absolute, total, unrelenting focus.
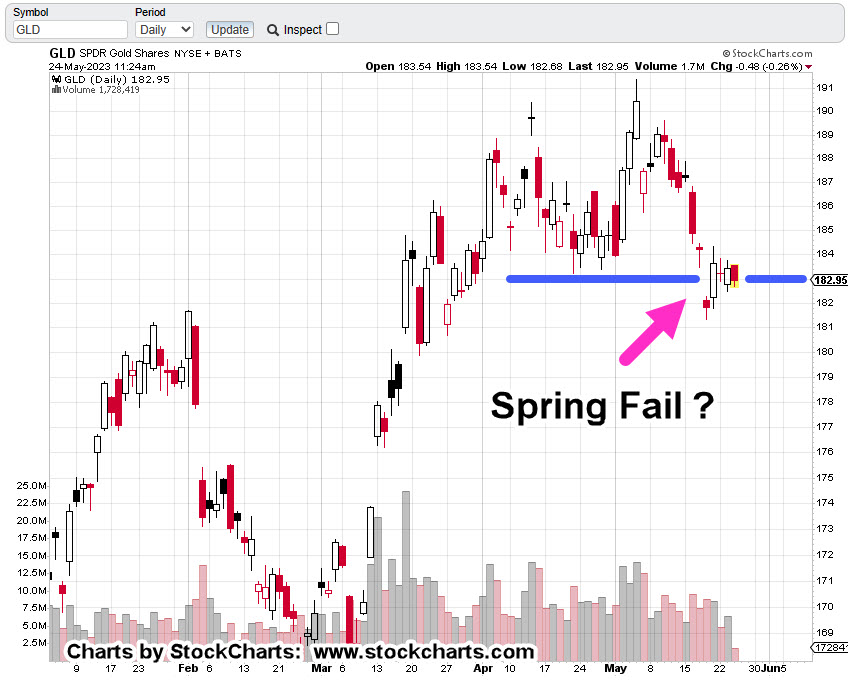
Gold (GLD), Daily
When we look at gold (as of 12:05 p.m. EST), from a technical standpoint, it’s in Wyckoff spring position; a set-up to move higher.
The difference in this set-up as opposed to the one on November 3rd, of 2022 (not shown), price action’s ‘hugging the lows’ as David Weis used to call it.
We’re not springing higher.
The miners on the other hand (GDX, GDXJ) have already made their decision, moving decisively lower during this session (not advice, not a recommendation).
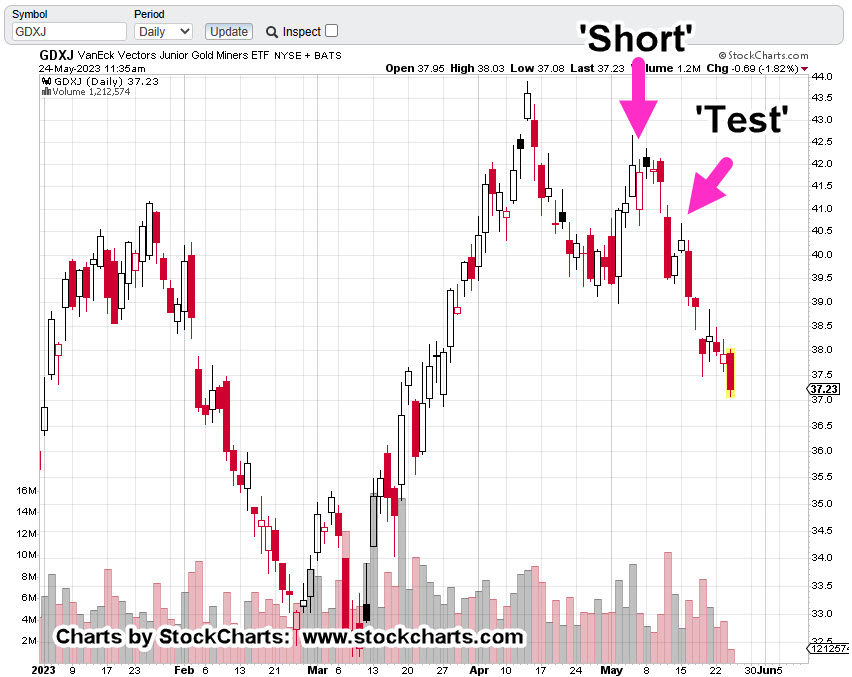
Junior Miners GDXJ, Daily
The chart below has two locations identified.
The first is this post identifying GDXJ, as a potential short opportunity.
The second is this post identifying the ‘test, reverse’ of the up-thrust with high probability of more downside (not advice, not a recommendation).
We can see the result.
Even though gold (GLD) had declined modestly with silver (SLV) more-so, the mining sector appears to be responding dramatically to the downside.
This ‘elevated metals, miners collapsing’ potential has been discussed previously.
Now, it appears that strategy is coming into play (not advice, not a recommendation).
Note: Posts on this site are for education purposes only. They provide one firm’s insight on the markets. Not investment advice. See additional disclaimer here.
If gold does not go higher, it’s because of ‘manipulation’, right?
The typical YouTube gold grifter acts like manipulation is a new discovery.
It’s the ‘go-to’ excuse when their forecasts don’t work out.
Way back in the early 1900s, Wyckoff discovered the market has always been manipulated.
His insight was, it’s up to the speculator to figure out the objective of the manipulation and then act accordingly (not advice, not a recommendation).
Livermore knew about manipulation and even engaged in it himself. He looked at things in a slightly different way; meaning, what is, not, what should.
A very key difference.
So, let’s look at what is happening with gold (GLD), and where it may head from here.
It took gold (GLD) several weeks to labor higher on ever shortened thrusts before finally exhausting itself and rolling over into a reversal … where we are now.
Is price action hesitating before heading higher or is this a significant downside move in the making?
It probably won’t be long before we have the answer.
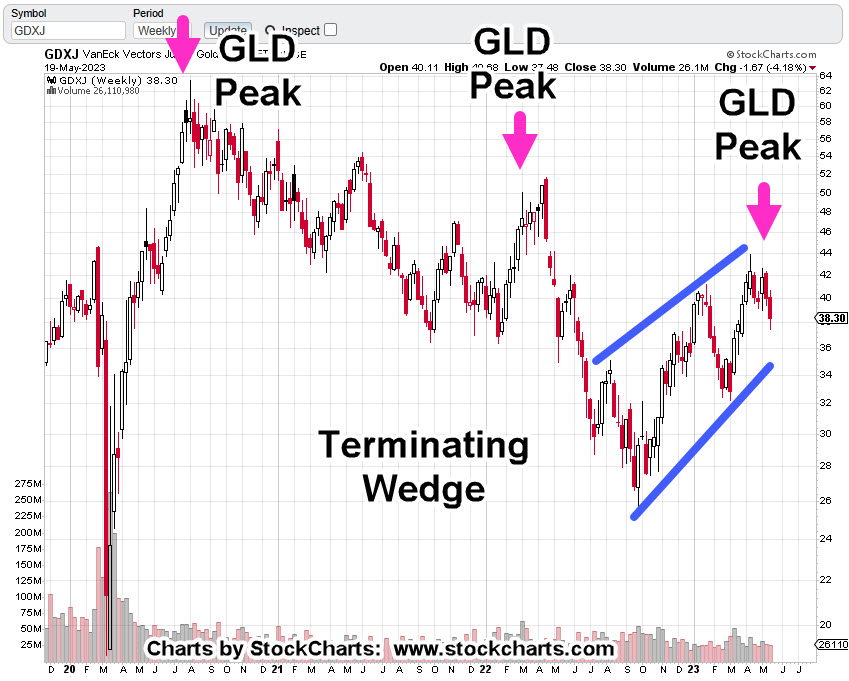
Junior Mining Sector GDXJ, Weekly
The gold mining indices GDX, and GDXJ, have already made their decision, reversing to the downside.
Note: Each reversal from a gold peak in the Junior Sector GDXJ below, is at significantly lower levels. This is not gold miner ‘bull market‘ behavior (not advice, not a recommendation).
It’s clear, the Junior Miners are in a bear market …
The GDXJ, is completing or has completed what is an obvious bear flag or terminating wedge.
Unless price action shows us differently, this is the current assessment; lower prices ahead (not advice, not a recommendation).
Fundamentals
From a fundamental standpoint, where’s the demand for inedible (possibly fake) metal going to come from? The consumer’s already tapped-out and borrowing money just to buy the weekly groceries.
Maybe something else is going on.
Something else that’s causing precious metals miners to anticipate another huge (economic) move lower.
Possibly completely unrelated (in a way) to the mining sector … maybe yet another ‘Speck’ event, shown at time stamp 3:40, at this link.
At the same link, time stamp 5:25, we’re back to the food supply … yet again.
“And all countries came into Egypt to Joseph for to buy corn; because that the famine was so sore in all lands.”
Note: Posts on this site are for education purposes only. They provide one firm’s insight on the markets. Not investment advice. See additional disclaimer here.