Random Notes

The Usual Suspects For The Week

No. 1

Institutional Destruction

The short video clip by Mark Dice, linked here, shows how former successful and possibly even meaningful (on a rare occasion) movie productions/franchises are being systematically destroyed.

This phenomenon is not just Hollywood but nationwide.

To be specific, the same type of destruction is occurring in the ‘wealth management’ industry.

One of the latest salvos is this ‘initiative’ to make that industry more diverse.

The comments section talks about the ‘talent going elsewhere’ to start their own business.

That may be true but remember, ‘Fiduciary Responsibility’ requirements make sure the person with the least amount of knowledge is in control … the client.

Which brings us to the next bullet item.

No. 2

The ‘Average Investor’

Years ago, somewhere around the early 1990s, Tony Robbins interviewed Robert Prechter Jr.

One of the questions Robbins asked was this:

‘What should the average investor do?’

Prechter’s response was timeless. He said:

‘Quit being the average investor’

Absolutely brutal but true.

It was a polite way of saying to get busy; stop being the ignorant, lazy, average American.

Study and learn the markets. That way you won’t be subject to the corruption and villainy that permeates the financial services industry.

Don’t think that statement’s true?

Just watch a couple of episodes of “American Greed” and see how many involve financial scams that fleece an unsuspecting investment public.

In the above link, our ‘professional’ positions short in a biotech company, Orexigen Therapeutics.

If there’s one thing an aspiring market trader speculator learns at the start, it’s never, never, never go short on biotech (at least the individual equity).

Anything can happen … and it did.

No. 3

Flash Crash Ready

This just out from ZeroHedge; Is another Flash-Crash in the cards?

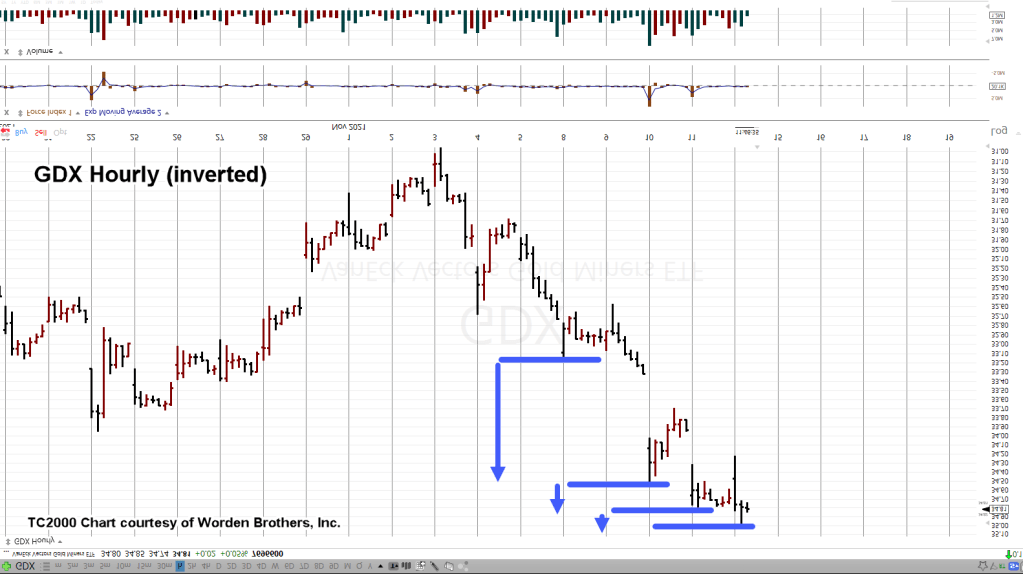
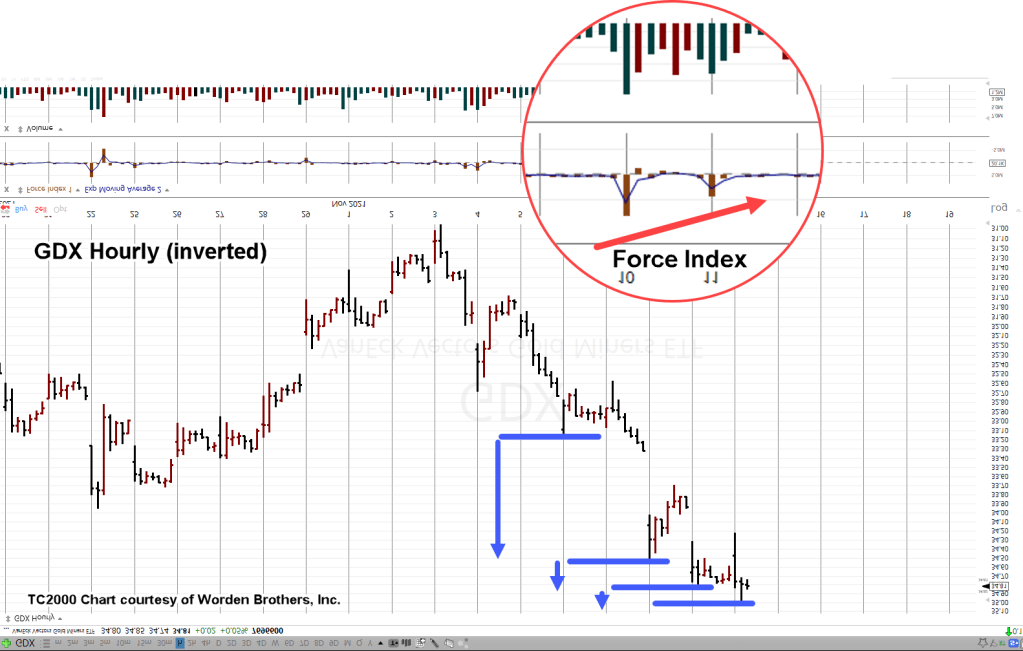
First off, let’s review what a flash crash looks like.

Link to the 2010, crash.

“Paper” = Big institutional selling

’79s are trading … all the way down !!! ‘

Even way back in my SeekingAlpha days, I proposed the next major market hit would be like nothing else.

Possibly a 20% – 50%, drop overnight or something similar.

Is it not better to plan, analyze and position (not advice, not a recommendation) with a Black Swan event in mind or just go merrily along thinking you’re as close to the entry door as the exit?

Stay Tuned

Note:  Posts on this site are for education purposes only.  They provide one firm’s insight on the markets.  Not investment advice.  See additional disclaimer here.

The Danger Point®, trade mark: No. 6,505,279

Inflation, Off The Chart ?

Or … Massive Supply Restriction

Use the miss-information and propaganda to your advantage.

The following items are just a partial list of recent inflation, so-called ‘news’.

$3,000 Gold Imminent

Gold & Dollar Soar, CPI Surge

Consumer Prices Soaring …

Gold & Crypto Surge

Transitory” Debate Is Over

That last one … is that like “The science is settled”?

To be fair, there is some truth in the articles. Prices are indeed rising. All types of costs are going up like food, gasoline and on.

Supply Restriction:

Here’s a strange bit of information from an unlikely source.

It turns out that copper (mining) supplies are being restricted in Minnesota. Go to time stamp 2:52, at this link and listen to the next 30-seconds.

Sure, it’s a data point of one but then again, what about all the talk of shutting down sources of oil production?

On it goes. This is supply restriction, not inflation.

It depends on what the definition of ‘inflation’ is.

Here we have one of the usual suspects parroting the now-accepted (but likely incorrect) definition of inflation. Go to time stamp 1:23.

I’m sticking with Robert Prechter Jr.’s definition of inflation and that is: Expansion of credit that causes increased spending that in turn causes demand to rise and then prices rise in turn.

Do we have expansion of credit now … or the destruction (or, soon to be) of credit? That’s called deflation.

Dollar … Still Not Dead

The dollar of course, is the wild-card.

Everybody’s expecting a collapse but darned if that’s just not happening. Actually, the opposite is taking place.

Now, all of a sudden it’s a “Contrarian Trade”. You can’t make this stuff up.

We’re coming up on the one-year anniversary of this post.

It postulated there was potential for a significant, medium-to-long term reversal in the dollar.

Getting The Picture

In a way, the dollar post and subsequent ZeroHedge one-year-later recognition of the obvious, define what this site’s all about.

As stated in the ‘About’ section, not every analysis works out. To borrow a quote from David Weis, ‘Sometimes I’m 100% wrong’.

Presented here are analysis, actions, course changes, attempting to maneuver through the largest economic and population collapse in world history.

The main focus is not to increase followership … although that is happening.

As the follower numbers increase, it’s a good sign that more are becoming aware of how manipulated and controlled is the entire narrative.

One way to separate from the effect of the falsehoods, is to become proficient at reading price action. As David Weis used to say, ‘What’s the market saying about itself?’

Which brings us to the current juncture. Gold

Gold, At A Crossroads ?

The current assessment of gold (i.e. bearish or reversal potential) is similar to the dollar from a year ago.

Different from the dollar, are the momentum (MACD, etc.) indicators … which are currently pointing higher.

In the dollar, there was a bullish weekly MACD divergence helping us along.

Not so with gold (GLD).

What we do have, and what the linked list above provides, is a look into a type of mass hysteria.

The ‘pegging the meter‘ article that came out late Friday caused only a blip higher in GLD and GDX.

If we’re at max persistent inflation already, is there any more upside left?

Stay Tuned

Note:  Posts on this site are for education purposes only.  They provide one firm’s insight on the markets.  Not investment advice.  See additional disclaimer here.

The Danger Point®, trade mark: No. 6,505,279

Gold, In Mid-Air

We’ve Been Here Before

CME

As we’ll see in the charts below, gold (GLD) has pushed above resistance three times in the past.

Each time, GLD reversed.

Two of those had GLD print new post, 8/6/20, lows.

The average decline was -11.3%.

During that time, miners GDX, GDXJ, took the brunt of the action.

The last GLD draw-down (6/1/21 – 8/10/21), was about -10.2%, while GDX got whacked top-to-bottom with -28.2%.

At this juncture, miner’s downside price action looks to be leveraged by about 3:1, when compared with gold.

Gold (GLD) Analysis:

The un-marked chart:

The marked chart has the past three up-thrusts above resistance (magenta arrows) and our current potential; the orange arrow.

Note the typical distance price action traveled above the blue line resistance levels.

If GLD does not move any higher from this point, its current distance above resistance is typical when using the past three moves for reference.

Danger Point:

In the markets, anything can happen.

Price action in GLD and miners, GDX, GDXJ are each at their own danger points.

Counter-intuitively, this is where the risk of being wrong is least (not advice, not a recommendation).

Senior Miners, GDX:

Taking the hourly chart of GDX and inverting it, gives us a chart similar to inverse fund DUST but without the tracking (bias) errors.

The inverted hourly chart:

Net downward price action is narrowing; less and less downward progress with each thrust.

This is an indicator we may be nearing the end of the move.

Helping that assessment along, is the next chart. The circled area shows Force Index is also dissipating.

Today’s session thus far, has essentially no more thrust energy when compared to the last two sessions.

Summary:

Price action in DUST, has gone a little farther (lower) than desired.

However, the analysis above tells us there’s nothing, yet, that would indicate an exit of the short position (not advice, not a recommendation).

One has to remember who’s on the other side of this trade; that is, the bull side.

The general public has been led to believe inflation is rampant. The media and various YouTube personalities have whipped them into an inflation frenzy.

Its become some kind of psychosis

Costs are going higher. That part is true.

The reason they’re higher, or at least a different perspective, is available to everyone via Uneducated Economist and Steven Van Metre just to name two.

As Van Metre said about a year ago concerning the actions by the Fed (paraphrasing),

‘Do you think the Fed is going to educate the public and tell them Quantitative Easing is actually deflationary?

No, they will allow the public to have the false belief their (Fed) actions have the opposite effect.

Just a reminder of what the guys above are really all about; Some additional info is here.

Stay Tuned

Charts by StockCharts

Note:  Posts on this site are for education purposes only.  They provide one firm’s insight on the markets.  Not investment advice.  See additional disclaimer here.

The Danger Point®, trade mark: No. 6,505,279

Gold … Bulls & Bears, Fight It Out

… And, In This Corner …

The fight is on.

Pre-market action in miners GDX, shows a slightly higher open with inverse fund DUST below yesterday’s low.

Is the short set-up busted?

In the markets, anything can happen but we don’t know who’s really in control … yet.

Even as the dollar powers higher, gold bulls could overpower deflationary conditions pushing gold and the mining sector up as well.

To do that, they’re going to need to overcome some significant resistance obstacles.

Let’s take a look at just a couple.

Senior Miners GDX

The un-marked chart:

The mark-up:

The mark-up shows the first two layers of resistance. The blue line is the Up-thrust (potential short) condition.

The dashed black line is not so easily discernable. It was formed way back in late July and early August.

The next two charts zoom into those areas of interest; providing evidence, getting above these levels may require a sustained effort by the bulls:

Summary:

The ‘inflation’ news is already out.

Price action in today’s session may let us know if we’re in a drawn out fight lasting day to weeks; or will the bulls reach exhaustion during the session.

Stay Tuned

Charts by StockCharts

Note:  Posts on this site are for education purposes only.  They provide one firm’s insight on the markets.  Not investment advice.  See additional disclaimer here.

The Danger Point®, trade mark: No. 6,505,279

Gold … The Show Begins

Popcorn Ready … Asylum Freaks Out

You would think everybody’s escaped.

We have this link and this one and probably many more.

Those who’ve been monitoring this site already know, today has been in the planning stages for months.

This post was the first one to discuss the target area for a reversal in gold (GLD).

So, here we are.

So-called inflation is running rampant and it looks as if everybody’s in agreement.

Well, almost.

Turns out there’s a guy in the Pacific Northwest, a ‘boots on the ground’ type that sells lumber for a living.

Uneducated Economist never waivered on the fact, prices are rising as a result of supply constraints and not inflation.

There was one more as well.

Steven Van Metre has given his take on current monetary policies; they’re deflationary.

It’s a minority view.

Either way, we’re about to find out the truth.

Gold (GLD) Analysis

The fact GLD, has reached a target identified two months ago, gives credence to a potential reversal.

We’ll start first, with the un-marked weekly chart of GLD:

Now, the mark up:

It looks like we have a test of the original Up-Thrust (reversal).

In addition, today’s action (above black dashed- line) is another Up-Thrust.

Is this a reversal, within a reversal ?

The chart below zooms in on that area:

Everyone has their own investment/trading time-frame and method.

There’s no doubt, gold (GLD) is at the danger point. Price action can go either way.

Positioning:

The ‘inflation’ links above highlight current psychology and sentiment. The bull trap may be set.

As of this morning, we’re already positioned short this sector via DUST (not advice, not a recommendation).

Note:

A push below today’s DUST low of 17.27, does not necessarily negate the trade but it does (or will) bring it under scrutiny for potential exit (not advice, not a recommendation).

Stay Tuned

Charts by StockCharts

Note:  Posts on this site are for education purposes only.  They provide one firm’s insight on the markets.  Not investment advice.  See additional disclaimer here.

The Danger Point®, trade mark: No. 6,505,279

Ventas … Rolling Over

Demographic Impacts & Price Action

The very first sentence at the Ventas website, linked here (under ‘portfolio’ statements) may no longer be true.

With ‘official’ data essentially suspect, we won’t know what’s left of the ‘ageing population’ until far in the future.

This winter (what used to be the regular flu season) will/should give some indication of just how much the customer base of Ventas has literally disappeared.

Looks like price action has already decided and is rolling over … even while the overall markets continue to press at or near new highs.

Stay Tuned

Charts by StockCharts

Note:  Posts on this site are for education purposes only.  They provide one firm’s insight on the markets.  Not investment advice.  See additional disclaimer here.

The Danger Point®, trade mark: No. 6,505,279

Gold Sellers Exhausted ?

According To The Latest Propaganda

It has to be this way.

As counter-intuitive as it sounds, for there to be a significant downside reversal in gold (GLD), the vast majority if not nearly all traders, speculators, and investors need to be on the wrong side of the trade.

Getting that crowd positioned without them realizing it, or being plain hypnotized like our asylum escapees, the gold bulls, helps get articles like this accepted by the masses.

The daily chart of gold proxy GLD, shows the potential target area for reversal.

This area has been a reversal target for months … since mid-September.

Working the markets in this way, that is, identifying a potential future condition for trend change, allows one to think about how it’s all going to go down.

Of course, consistent, incessant, propaganda along with bullish (asylum) hysteria is a must. 🙂

Just to be fair, sometimes and on a rare occasion, the crowd is right.

With that in mind, we’ll have to see how GLD price action behaves if/when it breaks through resistance.

Stay Tuned

Charts by StockCharts

Note:  Posts on this site are for education purposes only.  They provide one firm’s insight on the markets.  Not investment advice.  See additional disclaimer here.

The Danger Point®, trade mark: No. 6,505,279

Random Notes

The Usual Suspects For The Week

No. 1

Only The Beginning

Probably the best example thus far of what lies ahead.

At this site’s location in Central Texas, there’s been a so-called ‘clinic’ over the weekend.

A clinic to provide ‘protection’ to any that are still (at this late date) stupid enough to believe standard media reports.

There’s no joy in being correct about this subject.

However, at the same time and over the months … now running into years, attempts have been made to get the word out.

Way back in May of 2020, this update was published before most anything was fully known.

The conclusions came from intuition (discernment), coupled with empirical observation.

Family members have been notified. Church members notified; attempting to find anyone that would listen.

The typical response was:

I don’t want to talk about that right now.’

I don’t believe that.

‘You’re not a qualified source’.

So, what can you do?

Well, what this author’s doing, is providing leadership to those who want it.

That means, recognizing what’s coming (or what’s likely), positioning or trading in the markets for potential gain.

No. 2

The Real Bull Market

Right around mid-year last year, the product at this link was priced at $12.95.

That product is no longer available from the supplier as can be seen from the comment:

Going to this link, shows the product is not even listed.

If we go to this link, that same product if you can find it, now ranges from $49.94, to $119.95.

That’s an increase of 286% to 826%, in about eighteen months.

Going to this link and forwarding to time stamp 6:12, might get to the crux of why the product is not available or only available at a near 1,000%, increase in price.

No. 3

Keep It Simple … Be Proficient

In line with No. 2, we have this personal anecdote.

A couple of years ago, your author won a “Top Shot” contest at this location.

All told, the entire number of contestants was somewhere around thirty. At least two, were former or active military.

From my recollection, not one of them had what’s termed a 1911. That’s what I brought … along with one spare magazine that I carried in my pocket.

I did not have all the accoutrement gear they had; the khakis, the BDU’s, the boots … none of that.

I was in shorts and an Oxford-type shirt.

I did bring my Bianchi holster that I bought in 1984. So, I had that going for me. 🙂

Remember this?

Yes, it’s just a movie but it gets a point across. Proficiency equates to performance and that equates to survival.

If you have read this far, it’s likely you’re in the crowd that’s likely to survive or at least not go down without giving it your best.

Winning the contest proved that looks don’t amount for much when in the clutch.

What’s going on in one’s head along with the ability to carry it out, is the deciding factor.

Stay Tuned

Note:  Posts on this site are for education purposes only.  They provide one firm’s insight on the markets.  Not investment advice.  See additional disclaimer here.

The Danger Point®, trade mark: No. 6,505,279

Exxon: Higher, Still ?

Major Resistance At XOM: 69 – 70

XOM’s the largest cap in the sector. We’ll use it as the proxy.

Last update has us exiting a short via DUG (not advice, not a recommendation) and standing aside for now.

It’s no secret the overall markets are insane … possibly in some kind of massive blow-off, FOMO top.

At the same time, they look like they’re ‘thinning-out’; that is, only a few are participating in the upward launch.

It’s a bearish warning

Thinning-out, tends to happen at the end or near the end of bull markets.

Looking For The Short

The big money’s made on the downside with down moves being two or three times faster.

The Daily closing chart of XOM above shows it’ still grinding itself higher.

Trend lines below say the upside may be reaching a limit:

If we zoom-in, it looks like there’s significant resistance at the 69 – 70 area for XOM … if it gets that far.

Looking For The News

With the current instabilities, world events, food supply, energy supply, earthquakes, volcanoes, we could get some kind of upset to launch the oil sector higher.

It may not happen.

If it does, that could be the time to re-enter short (not advice, not a recommendation).

Stay Tuned

Charts by StockCharts

Note:  Posts on this site are for education purposes only.  They provide one firm’s insight on the markets.  Not investment advice.  See additional disclaimer here.

The Danger Point®, trade mark: No. 6,505,279

Update: Exit DUG

DUG Pressing The Lows … Standing Aside

Although this site is not a ‘service’, it is in good taste to be forthcoming on our market moves.

As said yesterday, there’s a lot of froth at the top. We’re certainly not going to hold a losing position into the weekend.

Exit was performed on DUG as shown.

Analysis to follow

Stay Tuned

Charts by StockCharts

Note:  Posts on this site are for education purposes only.  They provide one firm’s insight on the markets.  Not investment advice.  See additional disclaimer here.

The Danger Point®, trade mark: No. 6,505,279