Largest Downside Thrust … Ever

In the past few weeks, it seems like the markets have been whacked with a lot of, ‘the largest, ever’.
Trading in bonds, specifically TLT, is no exception.
While the media and pundits alike, deflect with ‘who’s doing the selling’ (hint: it’s not important), we’re going to look at the harder question of ‘what does it mean?’
Kick-Off, or Capitulation
Borrowing from research and writings of Wyckoff, Weis, and Prechter, when we get such a huge thrust downward (chart below), it’s typically one of two events:
A massive kick-off to much lower prices or a capitulation that washes-out the weak hands.
A bond upside reversal (rates lower) is a common sign of nearing or active economic downturn (not advice, not a recommendation).
In this interview with Greg Hunter, Ed Dowd covers the topic … the expectation for the reversal. However, that interview, was before the massive thrust lower.
Long Bond Proxy, TLT, Weekly
For years, it’s been one failed upside (reversal) after another.
Is this time, different?
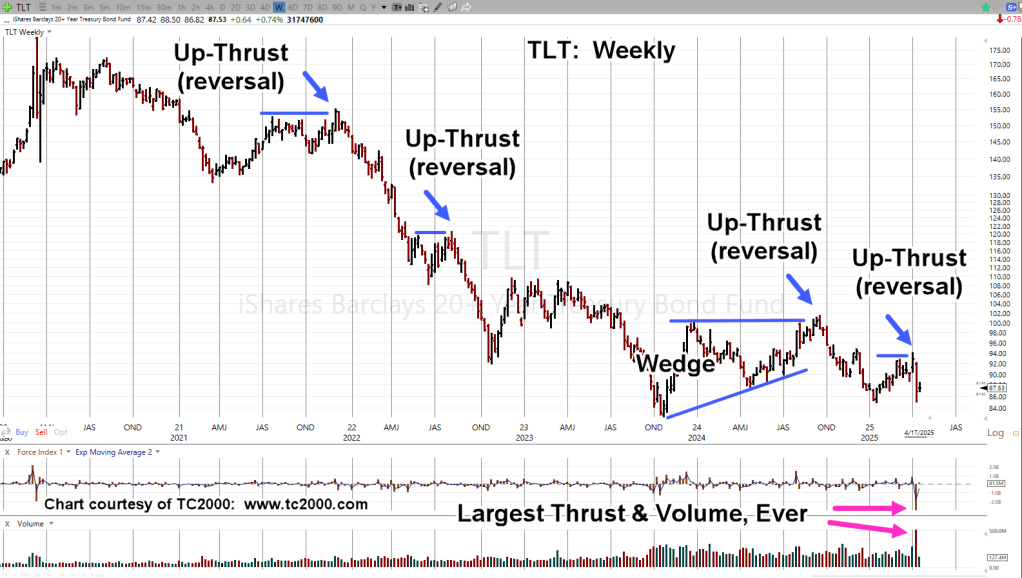
The right side (magenta arrows) shows unprecedented thrust and volume.
So far, there has been a weak recovery to 38.2%, retrace of the recent down-move.
If that retrace level holds, with bonds continuing lower (rates higher), it does not bode well for the ‘capitulation’ narrative.
Stay Tuned
Charts by StockCharts
Note: Posts on this site are for education purposes only. They provide one firm’s insight on the markets. Not investment advice. See additional disclaimer here.
The Danger Point®, trade mark: No. 6,505,279