Note: Posts on this site are for education purposes only. They provide one firm’s insight on the markets. Not investment advice. See additional disclaimer here.
Note: Posts on this site are for education purposes only. They provide one firm’s insight on the markets. Not investment advice. See additional disclaimer here.
With a slight new daily high, we’re potentially at the end of the GDX rally.
It should be noted: The past two weeks of trading have stayed within the price extremes of the wide bar posted during the week of August 20th.
This is called ‘inside action’; typically signaling preparation for the next phase … whether up or down.
Note, the inverse fund DUST pushed just 0.02 points (DUST, 19.78) below our stop level (not advice, not a recommendation).
That position was elected to be maintained … we’re still short.
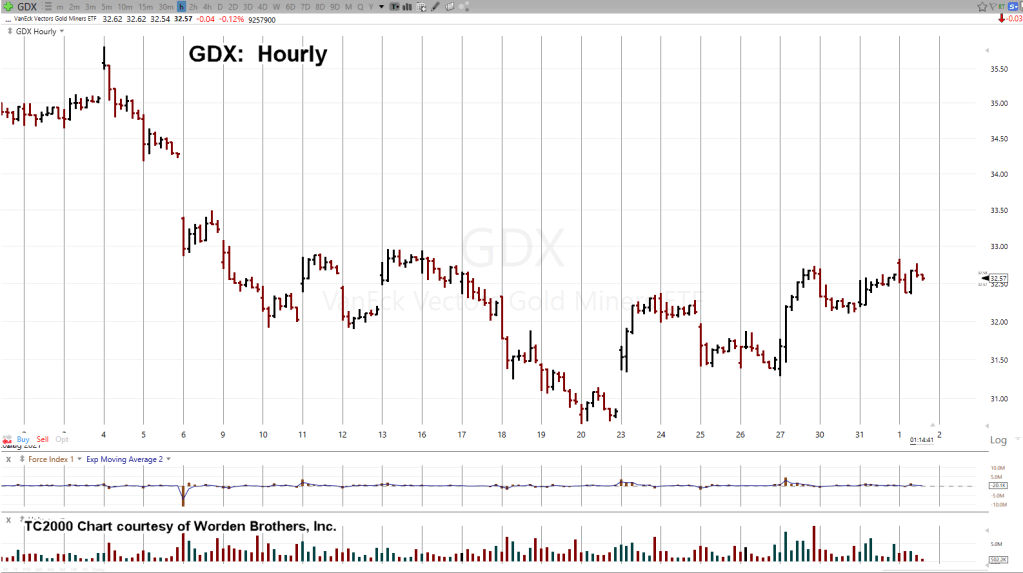
The hourly unmarked chart of GDX is below:
Next, we invert the chart to mimic the inverse fund DUST:
Now, comes the mark-up:
From Wyckoff’s writings all the way back to circa 1910, he discussed ‘shortening of the thrust’.
When net progress becomes less and less … we know we’re nearing the end of the move.
Throw into the mix the high level of resistance at the GDX 33.00, and probabilities favor the downside … upside for DUST (not advice, not a recommendation).
Stay Tuned
Note: Posts on this site are for education purposes only. They provide one firm’s insight on the markets. Not investment advice. See additional disclaimer here.
We’re not there yet and anything can happen in the meantime.
However, Senior Miner’s GDX, price action has moved lower during this session as expected.
Today has offered up one more clue for the bears provided GDX closes lower.
That is, we may have a channel confirmation:
Fibonacci time sequences are not necessarily always at price extremes. As shown above, they can define the width of a trading channel as well.
If this short (sell) set-up fails (GDX moves higher), we now have a definitive stop area for inverse fund DUST (not advice, not a recommendation); somewhere around: DUST 19.80 – 20.00.
Steven Van Metre in his last update, gave data on how the dollar is in a rally and nearing breakout position.
So far, there’s still a negative correlation between the dollar, gold, and gold miners.
Note: Posts on this site are for education purposes only. They provide one firm’s insight on the markets. Not investment advice. See additional disclaimer here.
Woody’s is the type of place, when you open the door, if you’re not from around here, the piano music stops and everyone looks to see who’s the newest sodbuster in town.
If that ever happens to you, just announce to all:
“I’m not from Texas, but I got here as fast as I could”
With that, you should be good to go.
Not more than a few hundred yards from Woody’s, is where I slid my Ranger pickup off the road down an embankment and upside down during the Texas ice storm of 2006.
The Chevron station, time stamp 0:32, is where I parked my hobbled, totaled pickup on that freezing December day.
The cab was smashed and the frame bent … but it was mobile enough to make it to the gas station.
When I slid off the road, down the embankment into oncoming traffic on Hwy 180, I thought (as the pickup rolled over), “well, this is it, this is how I’m going out.”
There’s no way oncoming traffic’s going to stop … not on the ice … I braced for impact.
It’s amazing how the almighty can engineer circumstances to be so perfect and so personal; it’s tailored specifically for you … to understand who’s really in control.
As the pickup came to a stop, upside down … the anticipated impact never came. Instead, within a few seconds, I had a woman knocking on my upside down driver’s window asking if I was ok.
I rolled it up (to go down) … it was a hand crank window. I unlocked the seatbelt and crawled outside. It was bitterly cold, windy, wet and sleeting.
What I saw was a line of pickups …. some Dually’s with stock trailers that had jackknifed on the ice … all stopped and the ‘Bubbas’ getting out to help with the overturned Ranger.
It took maybe five to seven of them to right the truck. I was in shock and grief but thankful as well.
I assured them I was ok. They had done their part and so went back to their own business. I then changed the right rear tire as the crash impact had blown out the seal.
By the time it was over, my hands were freezing … I got in and limped the truck to the Chevron station.
The point is this:
That crash revealed the character of the people at the time.
They put their own lives on hold (even if just temporarily) to do the right thing … to be the Good Samaritan.
So too, have current world events revealed the character of the people at the time.
That revelation is: The cowards and the corrupt have been thoroughly exposed.
Unprepared or unwilling to step up and be counted. Instead, they have done what comes naturally.
They have retreated.
Figuratively (or actually) building their back-yard decks so they can watch the financial and societal collapse in ‘comfort’.
On the flip side: The independent thinkers, leaders and the brave have been identified as well.
Those who are first generation of immigrant families (from communist countries) understand perfectly what’s happening.
They’re on a different path … taking action, getting ready.
All of which brings us to the next bullet item:
No. 2
Taboo Scaboo
Scaboo is our thoroughly illegal ‘urban rooster’.
Here he is, inside the backyard hen house with his ‘no crow’ collar clearly visible.
There’s no harm though as it’s relatively loose. It’s used more for psychological reasons; his or ours, not sure.
In an earlier update, having a rooster at this location is forbidden. Hens were recently ok’d when a previous city ordinance was overturned.
However, there are strict rules on how many and the located distance from other properties.
What’s the point?
It’s possible and probably likely, there’s much more going on here than just skirting the ‘rules’.
It’s been a mental exercise to engineer a method to keep him without the neighbors being aware; if they do know, without them complaining.
Scaboo has an ‘inside coop’ that consists of a used dog kennel with pine pellet bedding.
He’s on a schedule. Inside the house overnight; then put outside when he seems to be ready (stopped crowing).
If he starts back up, he’s brought in again. That’s the way it’s been for about the past month.
The amount of support received (physical or moral) from family members has been close to zero; more like, below zero.
“You’ll have to get rid of him”
“It’s against the rules”
“I wonder how long you can keep that up”
(bringing him in at night).
These comments have come from family that whether they know it or not, have already identified themselves as casualties.
This is not about the rooster itself.
Rather, it’s about having the mental elasticity to take a situation and make it work.
It’s sort of a practice run for the main event … whatever that’s going to be.
Quick thinking or action will be required.
How’s anyone with a closed mind going to figure out how to secure food, water or anything else when supplies are interrupted; when mental elasticity is the difference between survival and not.
In closing, here’s a brief video of our contraband rooster enjoying a dust bath … with the hens wanting some camera time as well.
Stay Tuned
Note: Posts on this site are for education purposes only. They provide one firm’s insight on the markets. Not investment advice. See additional disclaimer here.
It’s true when price action rebounds off a level, whether support or resistance, that level is confirmed.
However, personal (mental) bias, like the rabid hyperinflation ‘dollar destruction’ gold bulls, collectively have their minds so twisted, every bounce off so called support, is a buying opportunity.
That kind of blindness can set oneself up for (financial) disaster.
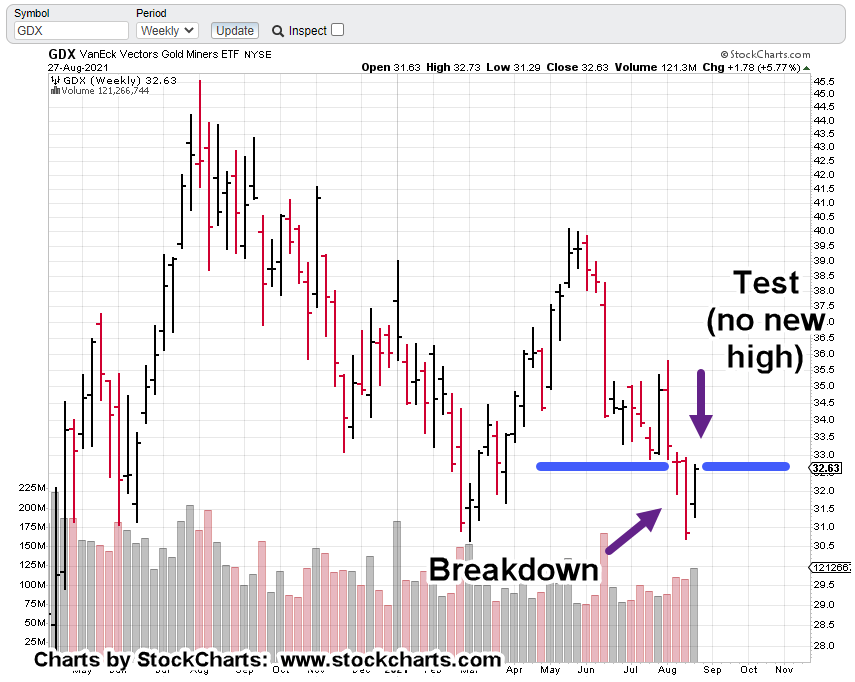
Well, we’re about to see if the current bounce was a buying opportunity or harbinger of a “free fall” breakdown.
Price action’s the final say. So, let’s take a look at what its been saying about the latest move.
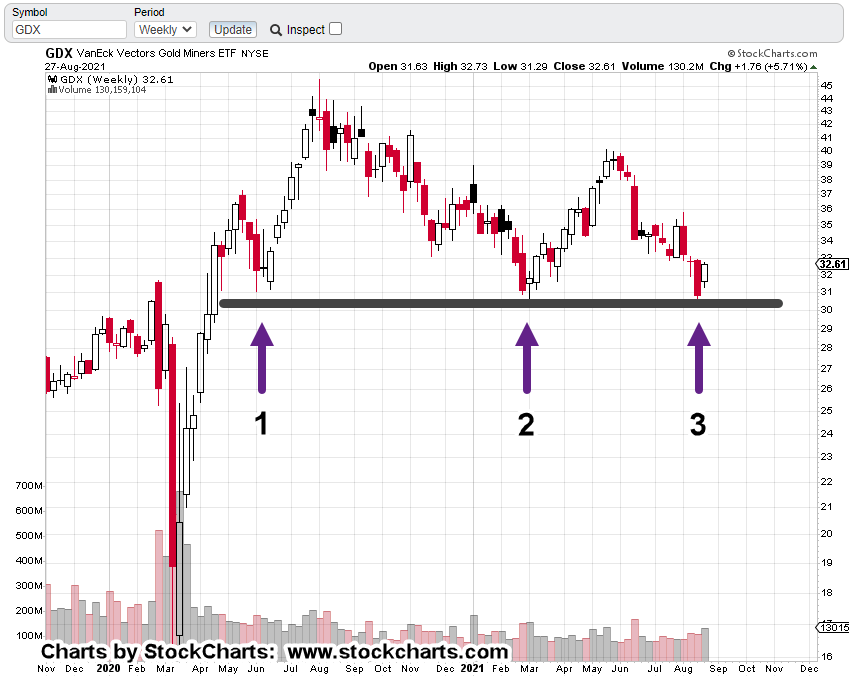
Un-marked weekly chart of Senior Mining (ETF) Index GDX:
Next, comes the support line and contact points identified:
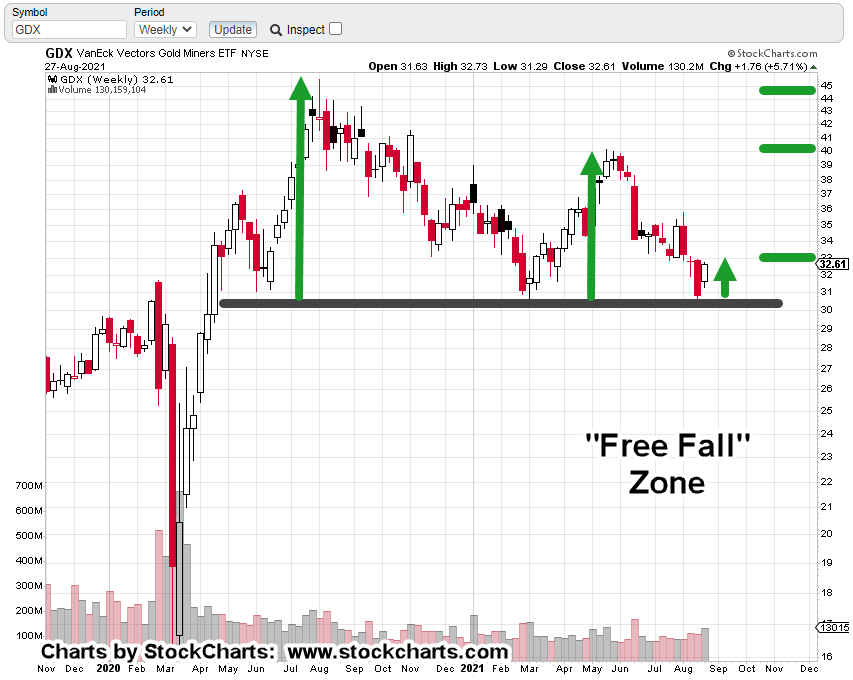
Now, comes the important part. Each rebound off support has less upward travel than before:
The right-most green arrow (upward travel), may or may not be complete. One fact in favor of completion is the significant amount of resistance around GDX, 33.00.
Price action has spent six weeks transacting in this area. Three weeks above support and now three weeks below.
Positioning:
We’re at the danger point; risk of being wrong on a short position is least (not advice, not a recommendation).
At this juncture, price action does not need to go far to either support or negate a short trade set-up.
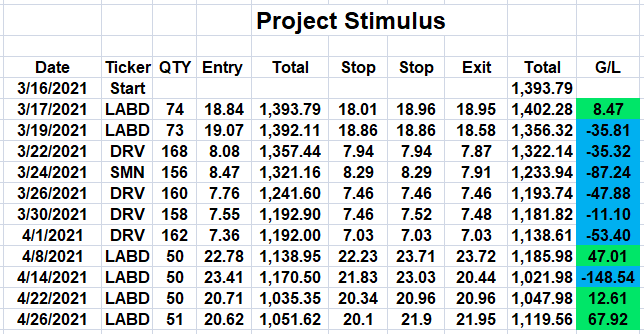
With that in mind, the Project Stimulus account is short this sector via DUST (not advice, not a recommendation).
Note: Posts on this site are for education purposes only. They provide one firm’s insight on the markets. Not investment advice. See additional disclaimer here.
Note: Posts on this site are for education purposes only. They provide one firm’s insight on the markets. Not investment advice. See additional disclaimer here.
As Dr. Elder once said (paraphrasing): ‘There are many ways to make money in the markets … even more ways to lose it.’
The time required to master the basics like support, resistance, accumulation, distribution is up to the individual.
After that however, the experimentation starts: Fibonacci retrace, time sequences, technical forces, multiple time frames and on.
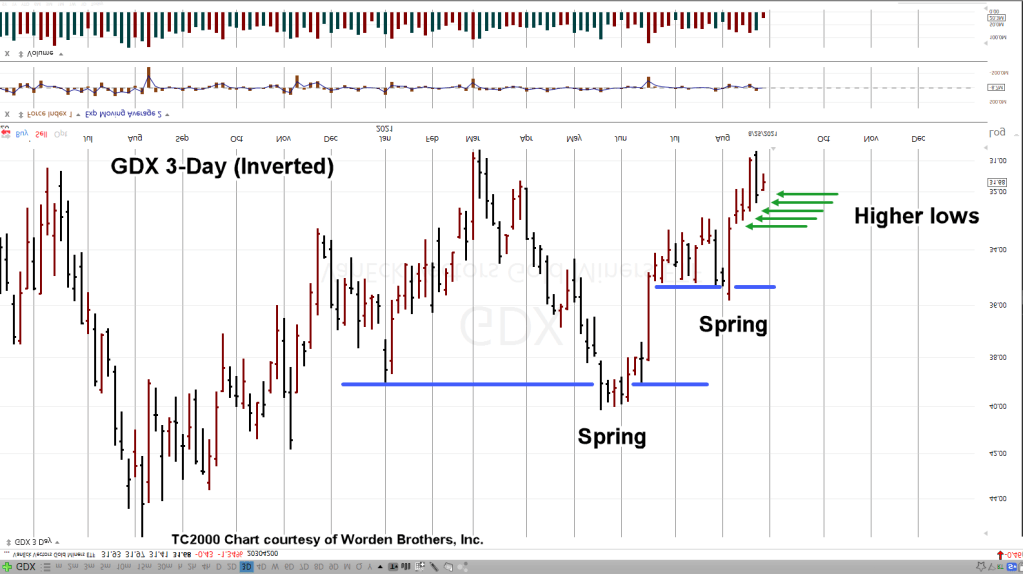
Experimenting with the chart of Senior Gold Miners GDX, shows at this time, a 3-Day chart reveals nuances not seen (so easily) in the daily or weekly.
We’re going to invert the chart to mimic the GDX inverse fund DUST (without the tracking errors) as shown below:
Then comes the mark-up:
All of a sudden, it becomes clear. Inverted GDX has been in a series of springs (up-thrust, non-inverted) and is now pivoting to the upside. That pivot is shown with the green arrows.
Each 3-Day period having a higher low than before.
As detailed in this prior update, GDX is potentially on the verge of ‘free fall’ (not advice, not a recommendation).
Pre-market trading has GDX, lower with DUST higher.
Stay Tuned
Note: Posts on this site are for education purposes only. They provide one firm’s insight on the markets. Not investment advice. See additional disclaimer here.
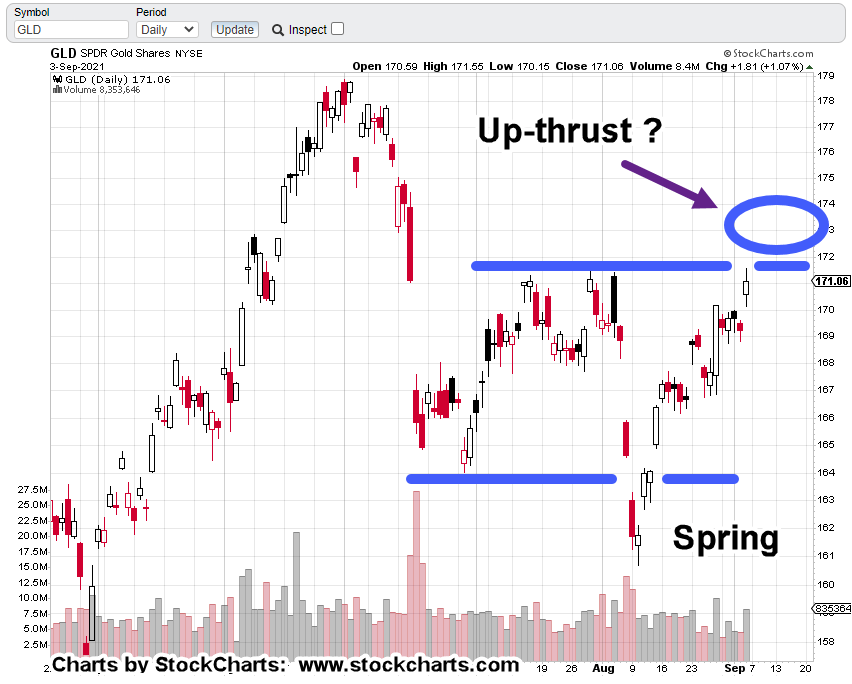
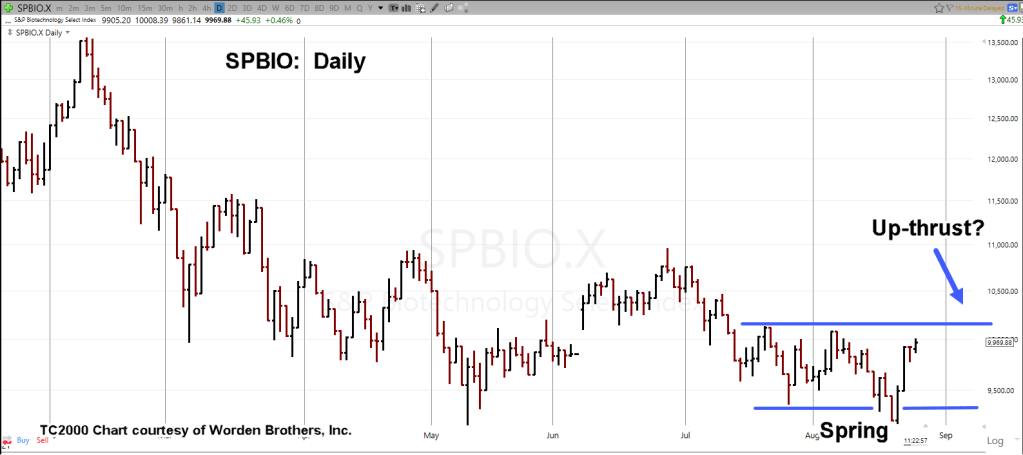
Biotech SPBIO, just went into a spring condition and is now in a rally.
From the sage observations of David Weis, we can expect … or at least start to look for, an Up-thrust.
The unmarked daily chart of SPBIO, is below. The charts that follow, show the potential up-thrust area. After that, we have a Fibonacci 23.6%, level added.
Just to add intrigue, September 7th, is 12-days from the August 20th low … well within acceptable range for a Fibonacci 13-Days.
Spring and Up-thrust notations:
Fibonacci retrace level:
Stay Tuned
Note: Posts on this site are for education purposes only. They provide one firm’s insight on the markets. Not investment advice. See additional disclaimer here.
Note: Posts on this site are for education purposes only. They provide one firm’s insight on the markets. Not investment advice. See additional disclaimer here.