Note: Posts on this site are for education purposes only. They provide one firm’s insight on the markets. Not investment advice. See additional disclaimer here.
Barring any new highs in the S&P, which seems less and less likely, the market has bookended two historic extremes.
September 3rd, 1929, was the peak back then; September 2nd, 2021, is the peak now.
This site has said many times, if we’re doing our job right, whenever the big reversal comes, we’ll already be in position (not advice, not a recommendation).
So, far that has proven to be correct; having gone short via DRV and TZA during the past week.
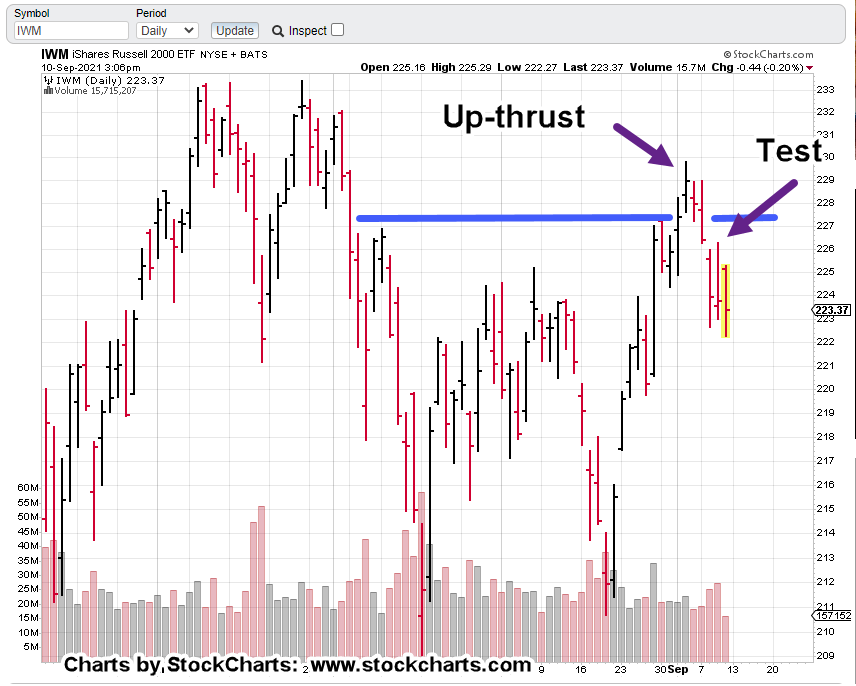
This down move is still very young. It’s almost imperceptible and could somehow be negated.
However, with each passing day when there’s no attempt or unsuccessful attempts at new highs, downside probability continues to build.
Note: Posts on this site are for education purposes only. They provide one firm’s insight on the markets. Not investment advice. See additional disclaimer here.
Note: Posts on this site are for education purposes only. They provide one firm’s insight on the markets. Not investment advice. See additional disclaimer here.
Note: Posts on this site are for education purposes only. They provide one firm’s insight on the markets. Not investment advice. See additional disclaimer here.
Note: Posts on this site are for education purposes only. They provide one firm’s insight on the markets. Not investment advice. See additional disclaimer here.
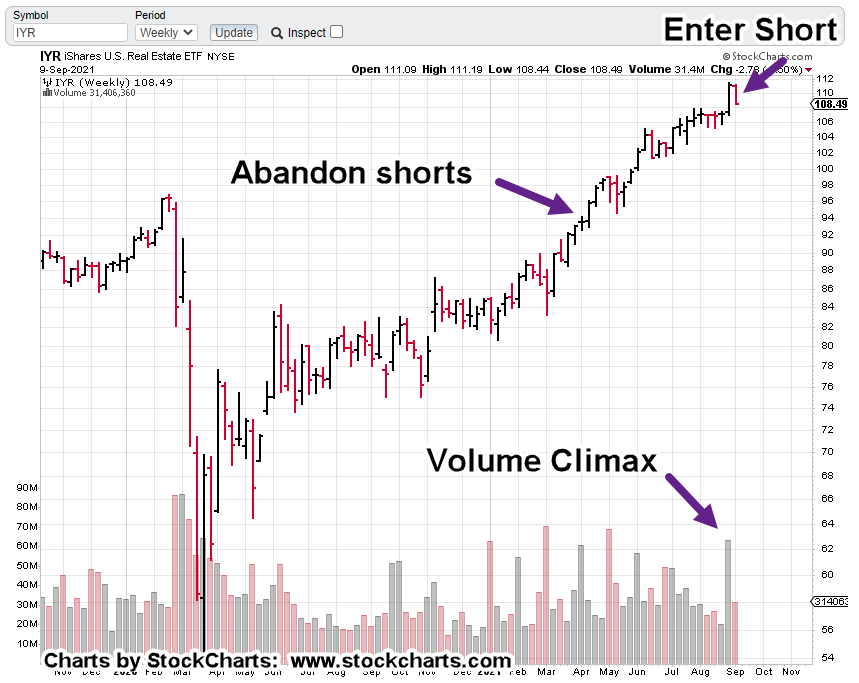
The last update on real estate (IYR) was at the ‘abandon’ arrow. At that time, the assessment was, even though conditions appeared set for reversal, it just was not happening.
Something else was going on.
It came out weeks later, that ‘something’ was entire subdivisions were being purchased (above asking price) out from under qualified potential homeowners.
Well, has that trend finally exhausted itself?
Last week’s climactic price rise and volume, which is quickly being eroded suggests were at some type of transition.
An initial position in DRV (3X inverse IYR) was opened today as shown (not advice, not a recommendation).
Pushing below the support level around IYR 107, would help confirm there’s something more going on than just a breakout and test.
Note: Posts on this site are for education purposes only. They provide one firm’s insight on the markets. Not investment advice. See additional disclaimer here.
However, if one disregards his input and focuses on the rest of the presentation, linked here, some of the ideas presented are already in work.
A few (and growing number) of us conceptually understand, ‘normal’ is never coming back.
Some, like Amandha Vollmer have openly discussed implementing the ‘parallel’ society.
This just out from Stew Peters, has his guest (DeAnna Lorraine) suggesting at time stamp 4:50, nurses and doctors that have quit (and there are a lot of them) in protest over not getting injected should start their own healthcare system.
The ‘parallel’ idea is out in the open; possibly gaining steam.
Forming that type of structure needs all the skills of the existing (corrupt) one. Engineers, technicians, skilled craftsman and on.
In that type of system there won’t be any ‘diverse workforce initiatives’. Just imagine, you’ll be hired paid and promoted based on your performance. 🙂
Stay Tuned
Note: Posts on this site are for education purposes only. They provide one firm’s insight on the markets. Not investment advice. See additional disclaimer here.
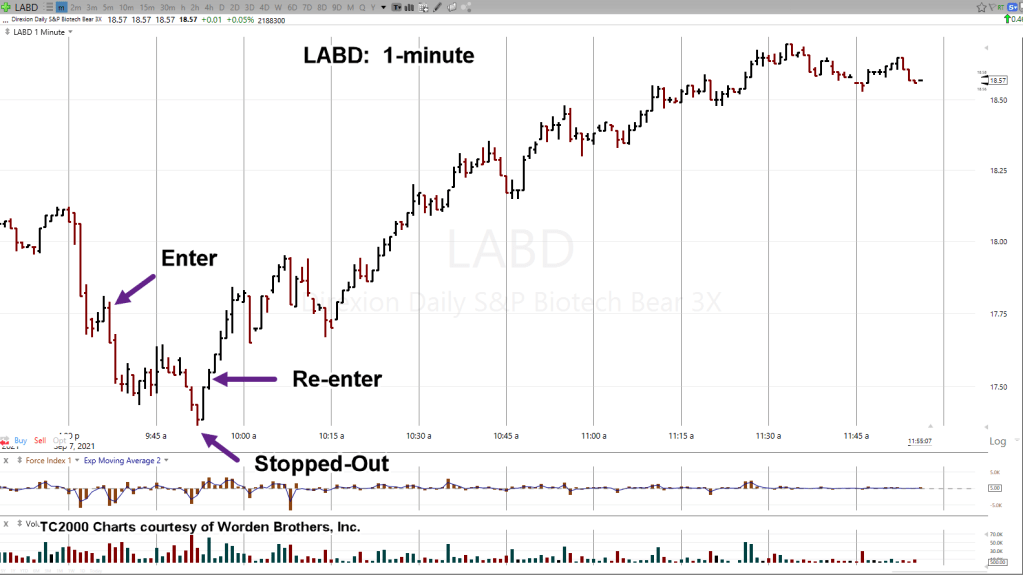
Using the prior day’s analysis that a short entry was low risk, the first attempt was long LABD 17.78, tight stop at the prior day’s low of 17.38 (not advice, not a recommendation).
As the chart shows, it did not take long to get stopped out and have LABD post a daily low of 17.37.
Immediately after the exit (within seconds), price action began to recover. The behaviour of this action gave the go-ahead to make a second entry.
After the second entry, price never came back. The stop on the position was changed to be the low of the day: 17.37 (not advice, not a recommendation)
Stay Tuned
Note: Posts on this site are for education purposes only. They provide one firm’s insight on the markets. Not investment advice. See additional disclaimer here.
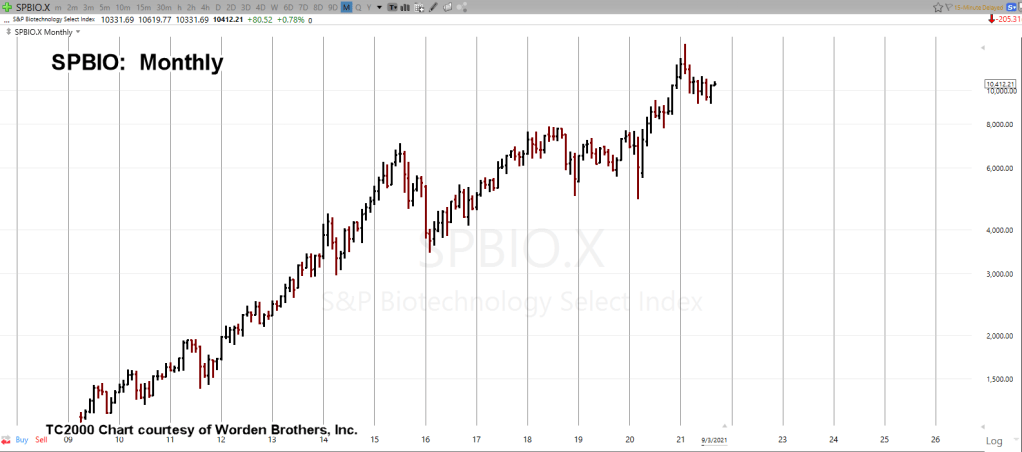
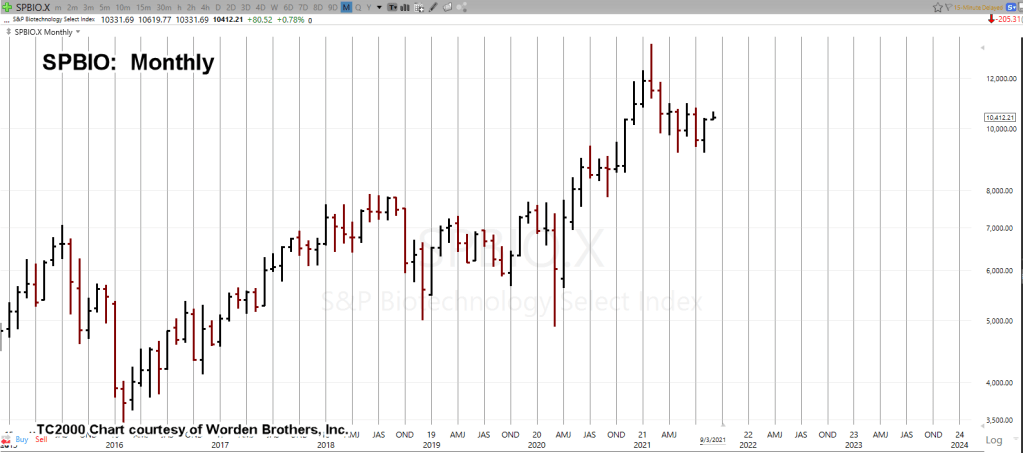
The big picture for biotech SPBIO, is above. The monthly chart shows a steady progression higher since 2009.
Stretching the monthly out a bit gives us the next chart:
The two months of reversal back in February – March of this year are clear. Those two bars have yet to be negated. We’re still in a reversal lower until price action pushes back into that range.
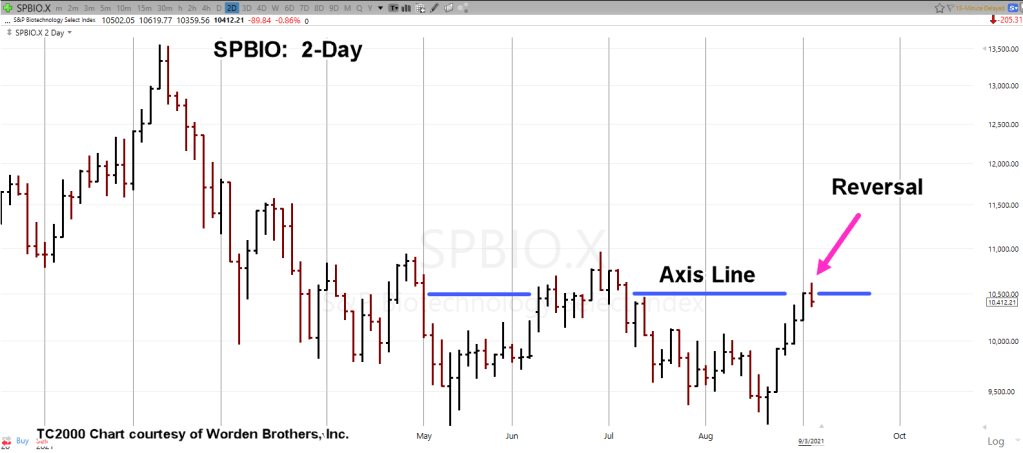
Zooming into the monthly bars at the right side highlights a market anomaly; something called ‘the clustering of the closes’.
You can’t see it, unless you’re looking for it. Note how the blue line intersects a good number of the opens and the closes.
This location is an area of resistance. So far, price action can’t get appreciably higher than the resistance (blue line) area.
Drilling even further down to the 2-Day chart and we see the straight up action for the past two weeks … that has now contacted the axis (resistance) line and reversed.
So, was that two weeks a short squeeze?
Typically, once the shorts have covered, there’s not much left holding up the market.
Unless there’s a gap higher above the axis line at the next session, risk of going short at this location is low (not advice, not a recommendation).
Stay Tuned
Note: Posts on this site are for education purposes only. They provide one firm’s insight on the markets. Not investment advice. See additional disclaimer here.
Note: Posts on this site are for education purposes only. They provide one firm’s insight on the markets. Not investment advice. See additional disclaimer here.