Early Signals

It’s never too soon to look for a trend.
The daily chart of biotech XBI, may be showing us early signals of a trend as well as trading channel.
Back in the day, when being mentored by David Weis, he would typically start the session by putting up a chart on his computer (with me logged in remotely) and then ask:
“What do you see?”
More importantly, he did not ask, what I ‘thought’ or what the Fed was doing, or any other mainstream form of distraction. No, it was always “What do you see?”
So, we’ll do the same.
Biotech XBI, Daily
We’re moving in close with the (un-marked) 3-month, daily; what do you see?
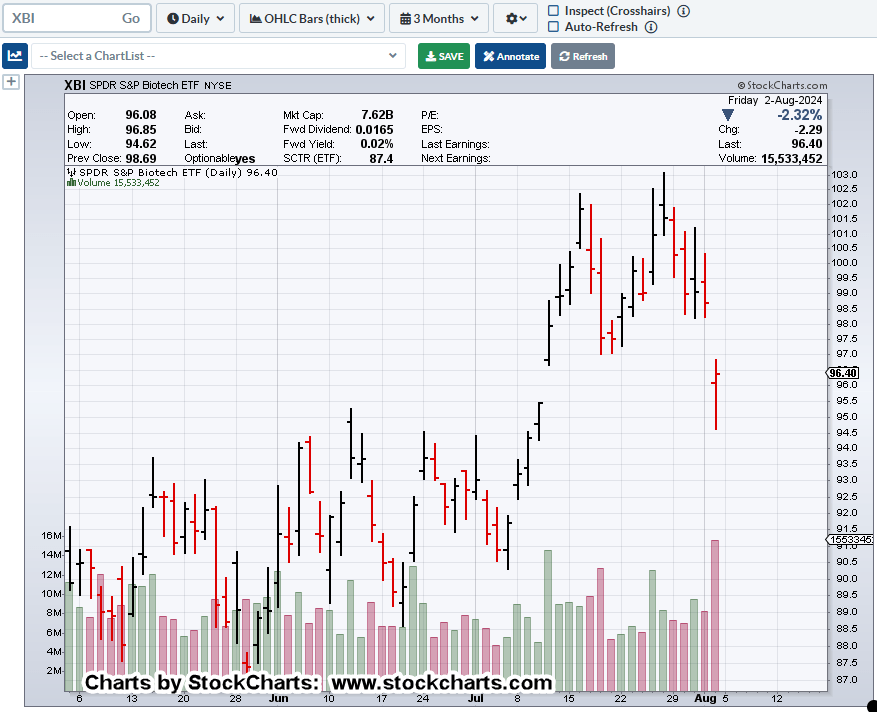
Two things should be noticed almost instantly.
Frist: Heavy volume at the last session this past Friday.
Second: Price action (the close) is hanging in ‘mid-air’ with the next support level over two-points away, near 94.0.
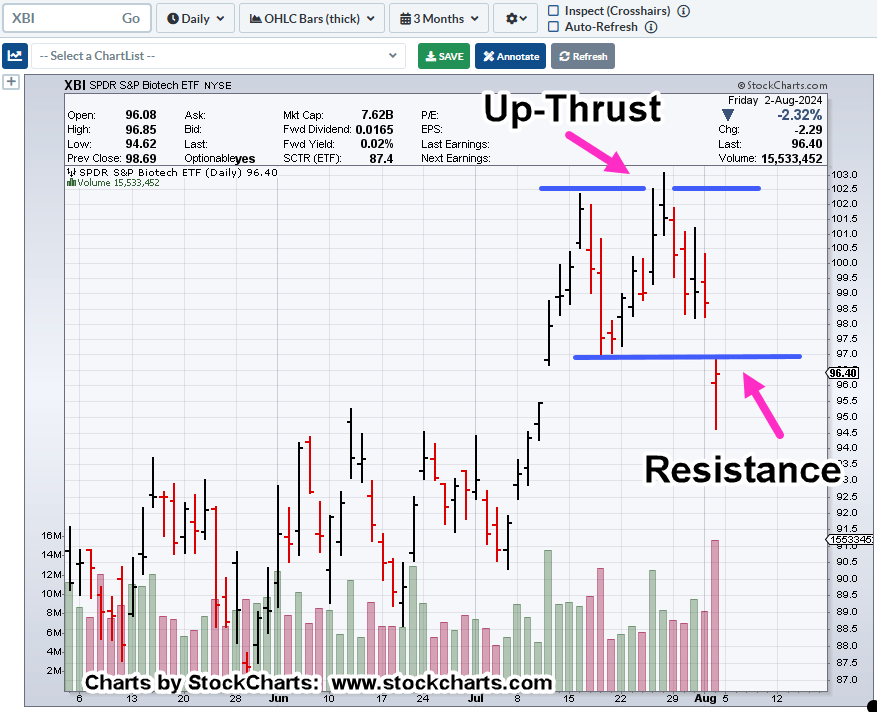
Now, for the marked-up charts.

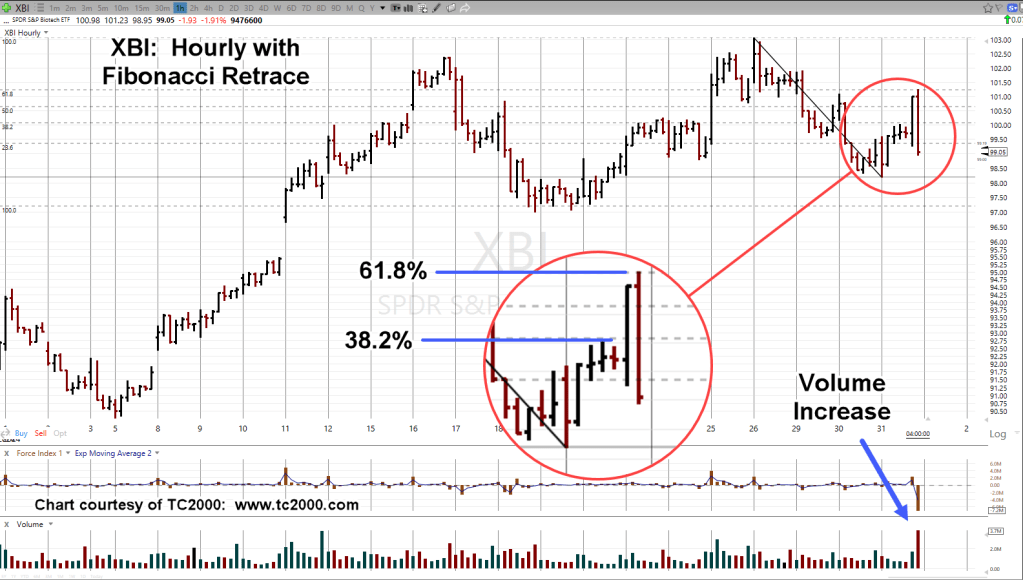
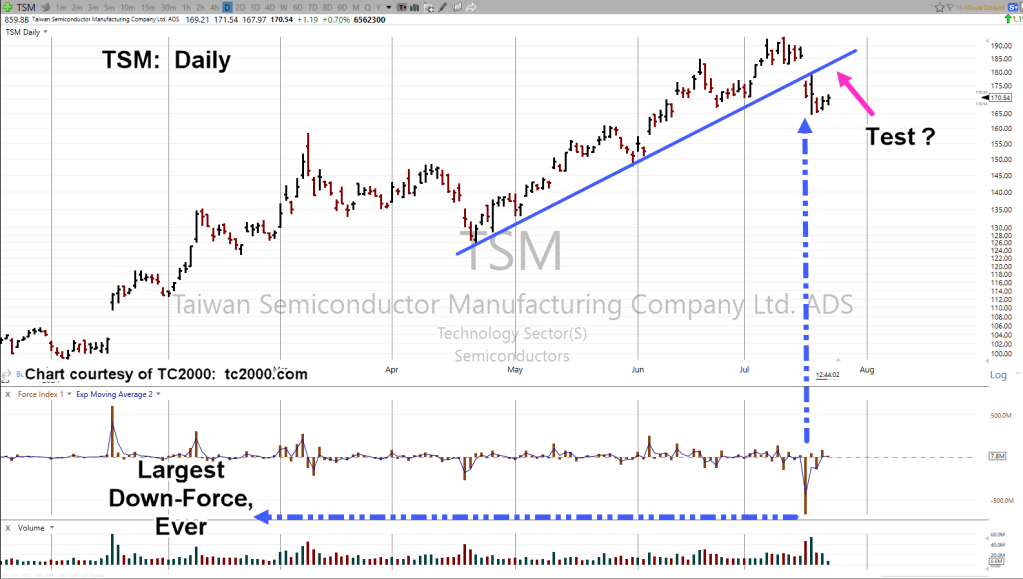
We’re using the ‘reverse’ trendline technique, presented in the Weis video to determine a potential right side trendline (black dashed line).
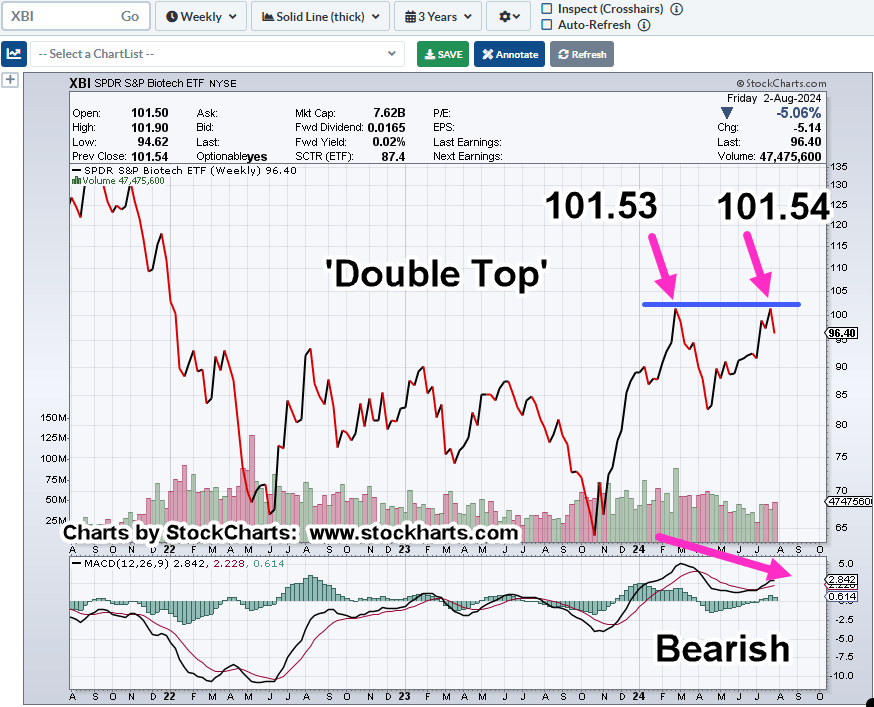
Next, we have the Up-Thrust on the daily which is also the right side of the ‘double top,’ shown on the weekly.
Taking both timeframes together, implies a significant inflection point (not advice, not a recommendation).
Anything can happen and the market could recover at the next session.
We’re below support (now resistance) and therefore, technically, in Wyckoff ‘spring’ position.
However, probabilities indicate we’ve had a downside pivot of some significance. That, along with heavy volume at Friday’s session would imply follow through at the next session (not advice, not a recommendation).
Stay Tuned
Charts by StockCharts
Note: Posts on this site are for education purposes only. They provide one firm’s insight on the markets. Not investment advice. See additional disclaimer here.
The Danger Point®, trade mark: No. 6,505,279