Looking Over The Past Year

Does the mining sector forecast the actual direction of precious metals; specifically, gold?
When looking over the past year, the short answer is yes.
We’ll look at the daily chart of the Junior Mining Sector GDXJ, below and show that each peak and reversal in gold, was preceded by a reversal in the mining sector (not advice, not a recommendation).
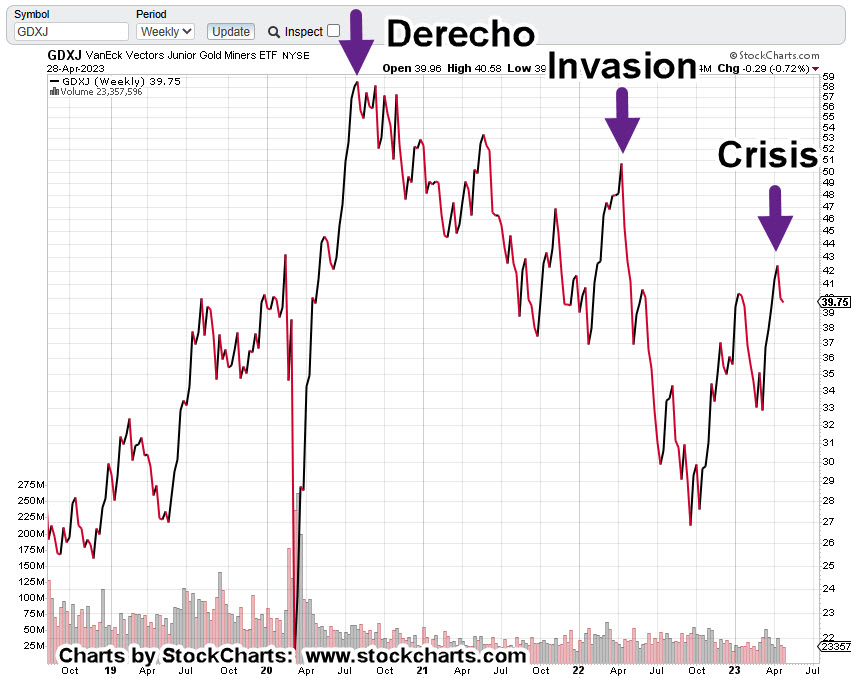
Junior Mining Sector GDXJ, Daily
Each ‘black arrow’ shown on the chart of GDXJ, is a peak or bottom and significant reversal in gold (GLD).
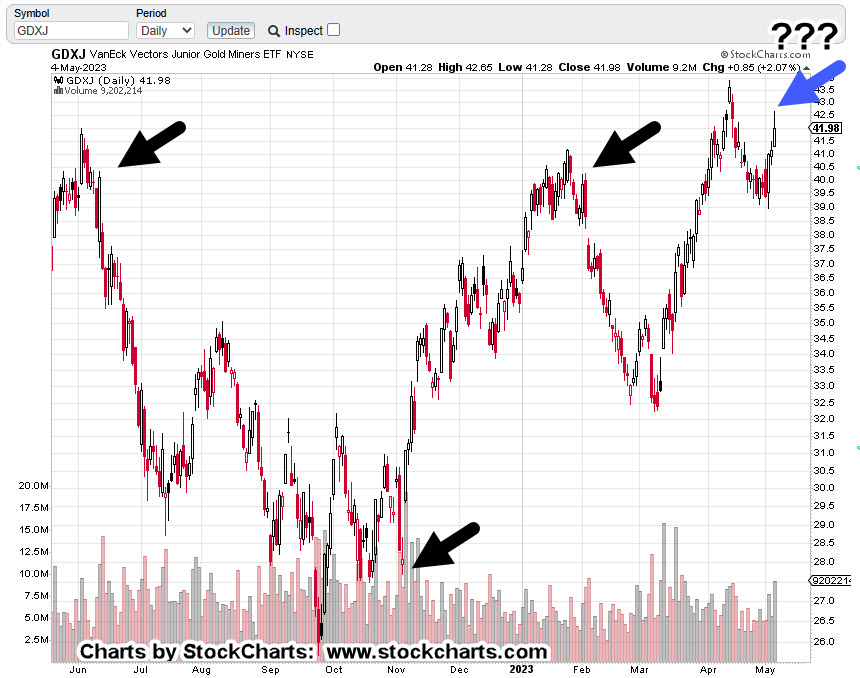
Over the past year, GDXJ reached its peak or bottom several days or several weeks before the actual metal.
The right-most arrow is blue … because we don’t know what’s going to happen next.
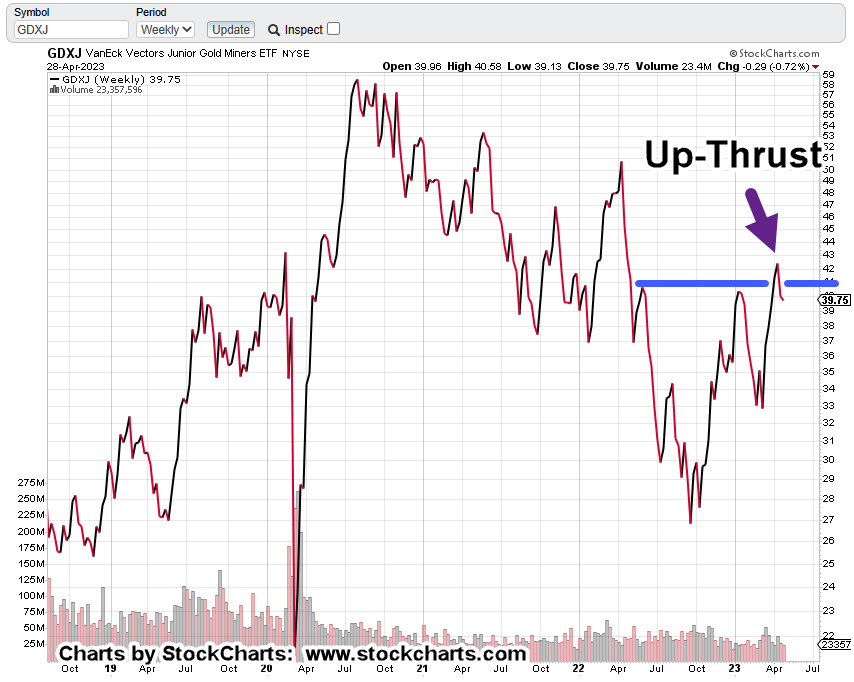
Pulling to a longer time frame (still using the daily), we see the GDXJ on a closing basis, is oscillating about an axis line that’s been in effect for three years.
Junior Mining Sector GDXJ, Daily Close

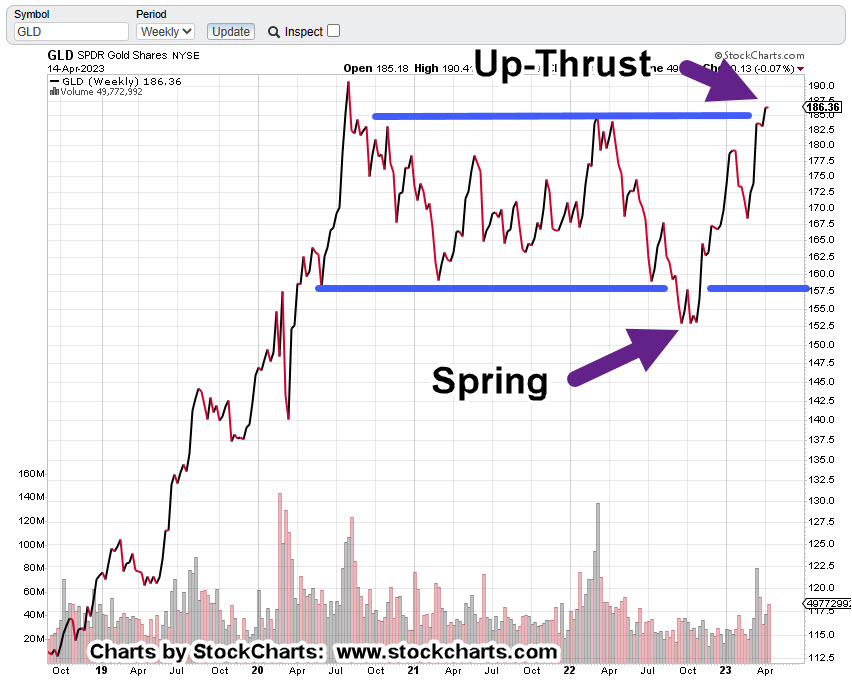
Until proven otherwise, we’re still in a test of the ‘Up-Thrust’.
Price action could somehow power its way higher (with higher gold prices) and move into some kind of bull move.
Or, as the chart implies, we’re at a potential inflection point with probabilities equally weighted but suggesting a slight hint to the downside.
Futures Market
Gold futures, GCM23, as of this post (10:25 p.m., EST), are drifting higher and curretly trading up about +0.05%.
Funny things tend to happen overnight in the futures markets. We’ll see if the upward bias holds to the next open or if downside pressure becomes apparent.
From a news standpoint, we have the employment report(s) before the open at 8:30 a.m.; the Fed speaks at 1:00 p.m.
Stay Tuned
Charts by StockCharts
Note: Posts on this site are for education purposes only. They provide one firm’s insight on the markets. Not investment advice. See additional disclaimer here.
The Danger Point®, trade mark: No. 6,505,279