Biotech … The Case For Collapse

Down 90%, Before October ?

If all the “Ifs”, come true.

First off, biotech (SPBIO), may already be in a collapse.

Of all the major sectors, it’s leading the way lower; down -61%, from all-time highs, set in February of 2021.

With SPBIO, lower by that much, are there still downside opportunities?

Only you can be the final judge of that.

However, for my firm, I’m not waiting around to see what happens next; we’re already short (not advice, not a recommendation)

SPBIO, Summary

As we’ll show below, SPBIO’s maintaining price action in a downside channel, declining at approximately -97.8%, on an annualized basis.

If that channel is held for the next three months (a big if) and if there’s no ban on short sales (as happened last time in 2008), and if the vehicle itself (LABD) remains viable, we can look for a -90%, decline from all-time highs, by October at the latest.

Why -90% ?

We’re using our chief, cook, and oh so, ‘disruptive’ bottle-washer, Carvana (CVNA) as the example.

The last report on Carvana, highlighted the possibility that it’s ripe for implosion.

The very next session, that implosion started in earnest.

Currently trading at 26.53, CVNA is down -92.96%, from all-time highs.

So, -90% (or more), for biotech seems reasonable 🙂

Throwing in a couple of anecdotal comments from J.B., Dan, and Patera, and voila! ‘This sucker could go down.’

Moving on to the main topic.

Biotech SPBIO, Weekly

Here’s where we are with the un-marked chart.

We’re going to compress the chart and put in the channel lines. The lower horizontal line marks a decline of -90%, from all-time highs.

If price action maintains the right-side trend line, a 90% decline, targets right around October this year.

Summary

This analysis could be blown away, rendered invalid, at the very next session.

That’s the way of the markets.

As sated, current positioning is to be short the sector via LABD, with trade LABD-22-02 (not advice, not a recommendation).

As a result of today’s action thus far, we’ve got a hard stop for LABD, currently @ 55.73.

Even as this post is being created, SPBIO action continues to grind down; threatening to post a new weekly low.

Stay Tuned

Charts by StockCharts

Note:  Posts on this site are for education purposes only.  They provide one firm’s insight on the markets.  Not investment advice.  See additional disclaimer here.

The Danger Point®, trade mark: No. 6,505,279

Biotech … Stall & Reverse

Heading Off The Cliff ?

We’re about to find out.

The last update presented that whatever happens with biotech (SPBIO), it’s likely to be decided quickly.

That conclusion was based on the ‘rule of alternation’ and the fact, the whole short squeeze event from last week, did not result in a new weekly high.

That, Was Then

What we have now so far in today’s session, is an attempt to move higher by SPBIO, which appears to have stalled and now, looking to reverse.

The reversal part won’t be confirmed unless, and until a new daily low is posted.

For today, posting a new low is somewhat of a tall order because of Friday’s wide trading range … but we’ll see.

Instead of going to the actual index, SPBIO, we’ll look at the 3X leveraged inverse fund LABD

SPBIO, 3X, Leveraged Inverse, LABD

Note:

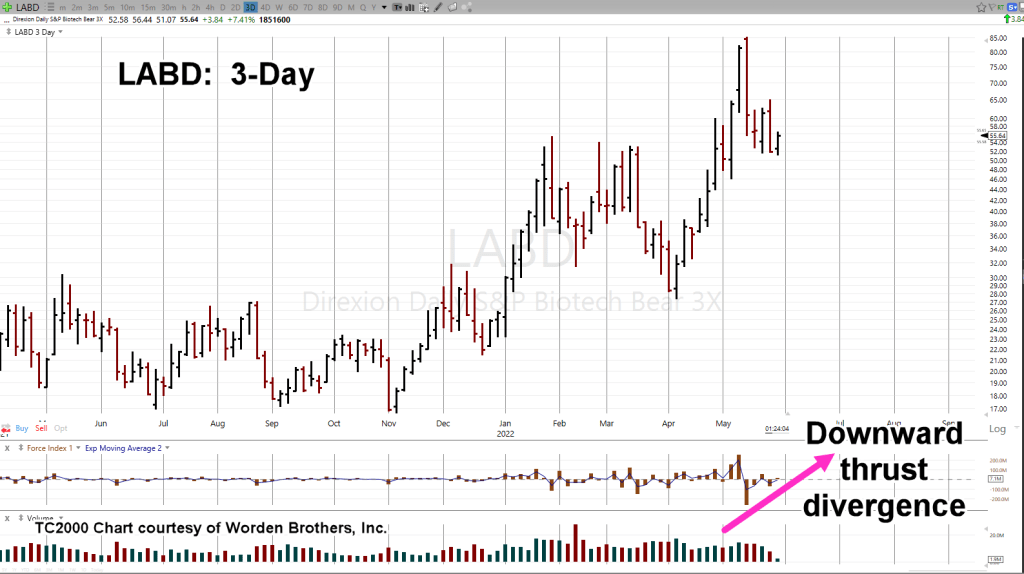
The chart below, is a 3-Day chart with Friday, completing the last ‘third’ day.

As price action has moved lower, energy behind that move is weakening; seen in the thrust divergence

Why a 3-Day Chart?

When’s the last time you saw a 3-Day, 2-Day, or 6-Day, or any other non-conventional chart in anyone’s analysis?

Anybody? … Bueller? Bueller?

It’s not different, just to be different.

Shown below, we have the same 3-Day LABD, compressed and marked up with a trading channel.

At this juncture, the 3-Day shows the nuances more clearly.

If this trading channel is in-effect, that is, if it’s active, potential exit points for an LABD position at this point in time, would be 105, or 240 (not advice, not a recommendation).

For LABD, to get anywhere close to those points, especially the second (240-level), biotech would need to collapse.

Summary

There’s plenty of chaos to go around. We have those who are still arguing whether or not ‘it’s the bottom’.

Such arguments are potentially (and likely) from those completely unprepared.

As Jerimiah Babe said in one of his latest videos, ‘something’s going to break’.

When or if that break happens, it won’t be to the upside.

Stay Tuned

Charts by StockCharts

Note:  Posts on this site are for education purposes only.  They provide one firm’s insight on the markets.  Not investment advice.  See additional disclaimer here.

The Danger Point®, trade mark: No. 6,505,279
‘Investors’ Buy Dip Over & Over

“Fuel” For The Downside

Once this next level gives way, carnage will (likely) reach all-time records.

Over a centry ago, Wyckoff said in his writings, it’s those on the wrong side of the bull trade, who provide the fuel on the way down.

As reported by Reuters, that downside fuel appears to be building on a massive scale.

The Fed This … The Fed That

What a colossal waste of time … that is, trying to figure out what The Fed is, or is not, going to do.

As The Maverick reports in this update, The Fed has a higher authority. It should be no surprise to any of us at this point … they’re ‘just following orders’.

Mirroring that sentiment is Dan from i-Allegedly, saying ‘This is not the bottom‘.

Part of the reason there’s so much focus on earnings, financials and The Fed, is that it’s a whole lot easier to do that, than actually getting down to work and learning price action.

That my friends, as Wyckoff said in his text Studies In Tape Reading, ‘takes many years and many losses’.

So, let’s take a look at what that ‘tape’ is telling us concerning the biotech market.

Biotech Inverse BIS and LABD

The prior analysis on IBB, is still valid.

However as was done with real estate, changing from 2X inverse to 3X inverse, the same has happened with biotech; from BIS, to LABD.

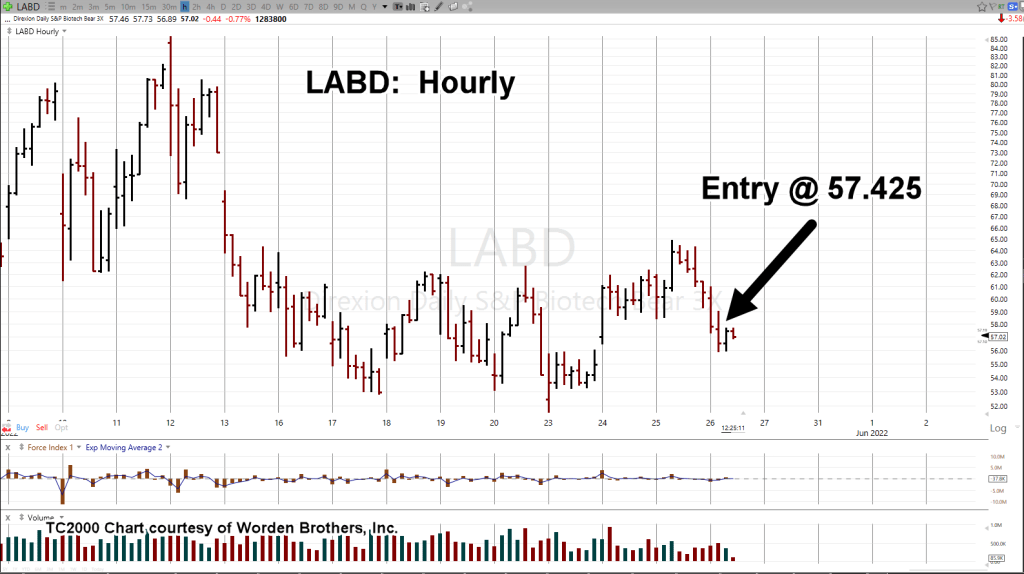
Since the overall bearish assessment has not changed, this morning’s upward move in the markets was used to re-position to a higher (inverse) leverage vehicle … LABD (not advice, not a recommendation).

The hourly charts below show the exit of BIS and the entry of LABD.

Biotech 2X Inverse, BIS

Biotech 3X Inverse, LABD

As this post is being written 12:55 p.m., EST, price action’s at the danger point.

We’re at the extreme; the risk is least but price can go either way.

Summary

Watching that action in real time, it looks like LABD wants to go higher; currently trading at 57.20-ish.

If LABD is higher, that means SPBIO, is moving lower.

Unless price action of biotech (IBB, SPBIO) and the overall markets signal a change of behavior … the bear move is still in play.

If we get a significant break lower, ‘retail’ that’s not positioned properly, will provide the majority of downward thrust energy.

It’s no different than it was in Wyckoff’s time, over a century ago.

Stay Tuned

Charts by StockCharts

Note:  Posts on this site are for education purposes only.  They provide one firm’s insight on the markets.  Not investment advice.  See additional disclaimer here.

The Danger Point®, trade mark: No. 6,505,279

Biotech … The Breakdown

Wedge Break Has Been Tested

It’s been a while since we’ve talked about the chief cook and bottle washer in this whole financial collapse scenario.

However, biotech has not been forgotten.

There are two indices (ETFs) being tracked: IBB and SPBIO.

Both entered bear market territory long ago. SPBIO topped out, way back in February 2021; IBB topped later, in August the same year.

Leveraged inverse funds are LABD, and BIS, respectively. LABD is 3X inverse with BIS a 2X inverse.

The Long Term

One thing unique to David Wies, was to look at the long term: Monthly, Quarterly and Yearly charts.

Doing so, puts one in a strategic mindset … not easily swayed by the latest prattle from media sources.

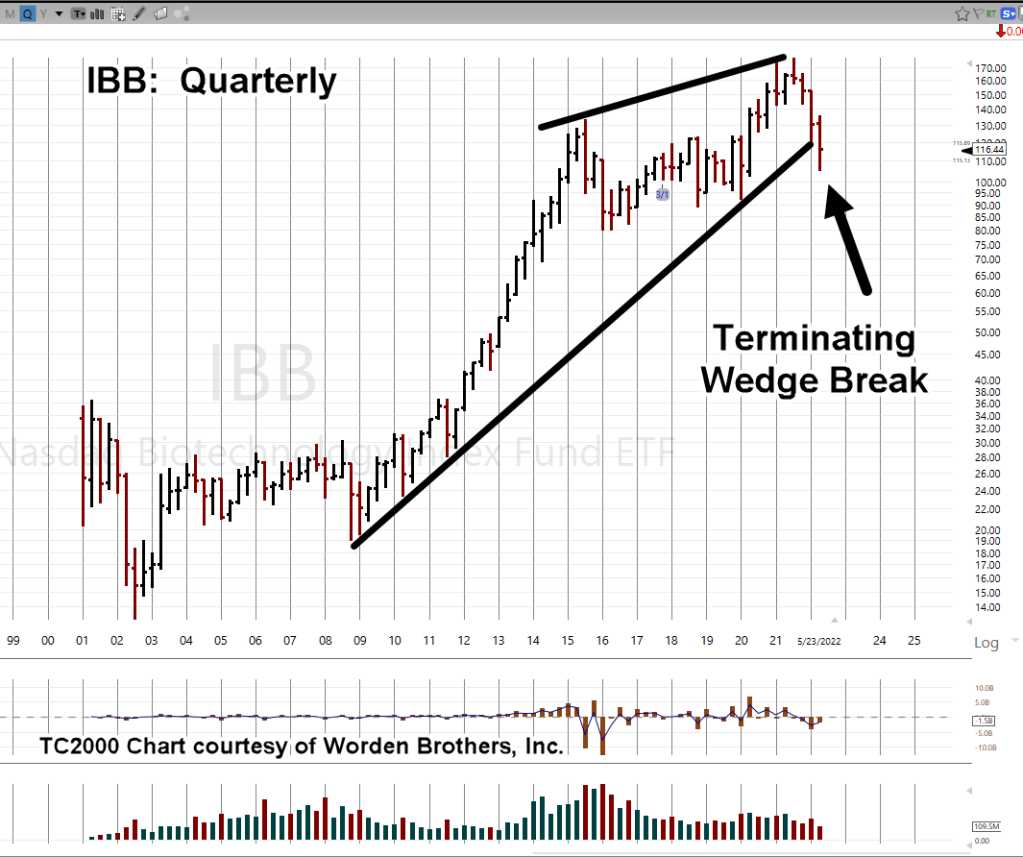
If we look at biotech, IBB, on a quarterly basis we have the following chart.

Biotech IBB, Quarterly

The mark-up of this chart is where it gets interesting.

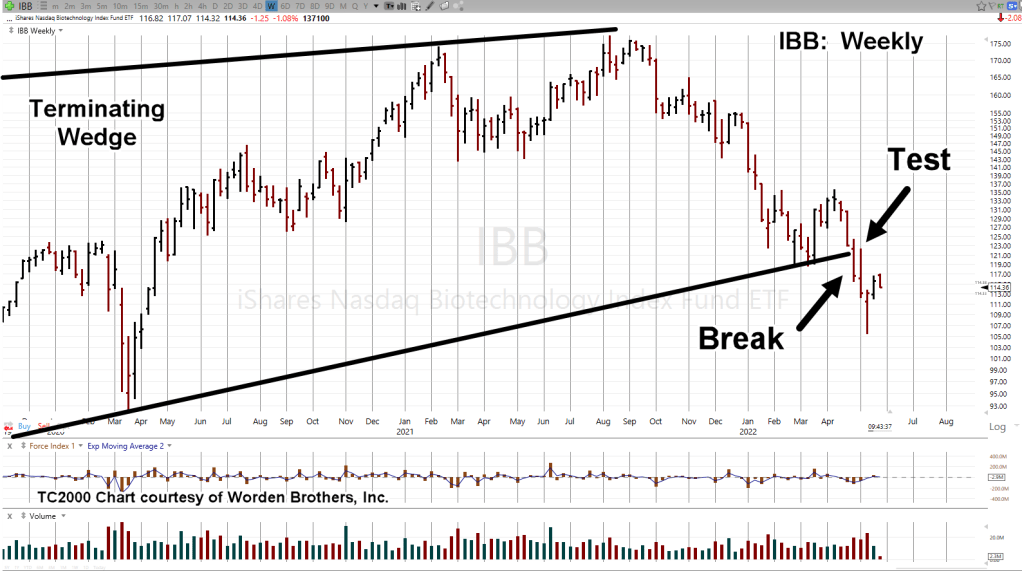
A terminating wedge that’s been over seven years in the making has just broken to the downside.

Not only that, when we get closer-in (on the weekly), we can see the wedge break has been tested and now today, appears to be reversing to the downside (shown on daily).

Biotech IBB, Weekly

With zoom

The daily shows a Fibonacci retrace to 38%; then today, a downside reversal.

You can see where this is going.

Based on the above analysis a short position in IBB, has been opened via BIS (not advice, not a recommendation).

The trade is BIS-22-01, with an (initial) entry @ 28.5173

Summary

The news on specific biotech companies is already out if one knows where to look.

Stated time and again on this site, we’re just in the beginning stages of the repercussions.

It even looks like they’ve moved on from the initial scam and are cooking up a new one.

Stay Tuned

Charts by StockCharts

Note:  Posts on this site are for education purposes only.  They provide one firm’s insight on the markets.  Not investment advice.  See additional disclaimer here.

The Danger Point®, trade mark: No. 6,505,279

Last Time … is not … This Time

The Rule of Alternation

That’s it in a nutshell. What happened last time, won’t happen this time.

The market reveals its own secrets; you just have to know where to look.

An entire industry has been (purposely) built to make sure the ‘average investor’ never finds the truth of the markets.

That industry is the financial analysis industry; the one with the P/E ratios, Debt-to-Equity, and so on.

Sure, it was a tongue-in-cheek post to use the fact that Carvana had no P/E (linked here).

I’m not certain if they ever had a P/E; probably not.

However, that financial, i.e., fundamental(s) fact, did not keep the stock from going up over 4,529%, in four years.

It should be noted, the Carvana analysis was done on a Saturday (as has this one). At the very next trading session, CVNA posted lower, started its decline in earnest and never looked back.

Not saying that exact thing (timing it to the day) will happen with our next candidate real estate; as said before, part of Wyckoff analysis (a lot of it, actually) is straight-up intuition.

The good part from a computer manipulated and controlled market perspective, intuition can’t be quantified.

So, that’s your edge.

Let’s move on to ‘last time is not this time’ and see what the real estate market IYR, is telling us.

Weekly Chart, IYR

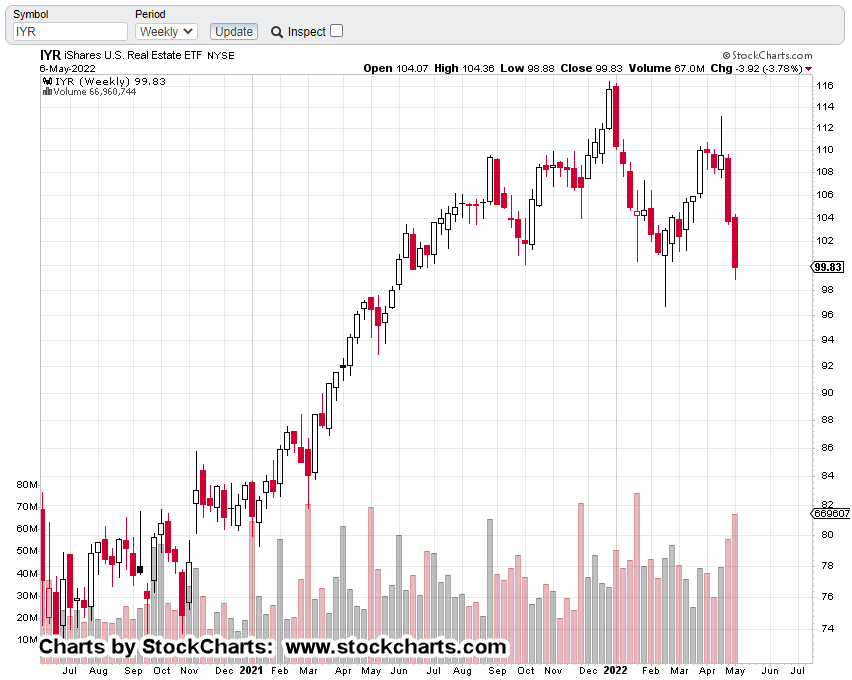
We’ve got the weekly un-marked chart of IYR, below.

The ‘alternation’ is there.

Here it is, close-up.

The first leg lower had some initial smoothness but quickly became choppy and overlapping.

Not so, now.

We’re essentially heading straight down.

Fundamentals

From a fundamental standpoint, real estate is finished. However, it’s been finished for a long time.

The fundamentals won’t and can’t tell anyone what’s likely to happen at the next trading session … or any other session.

The market itself (shown above) is saying the probabilities are for a continued decline; posting smooth long bars until some meaningful demand is encountered.

As shown on the last post, if the trading channel is in-effect, that (chart) demand is a long way down.

Positioning

Shorting IYR via DRV, has been covered in previous posts (search for DRV-22-02).

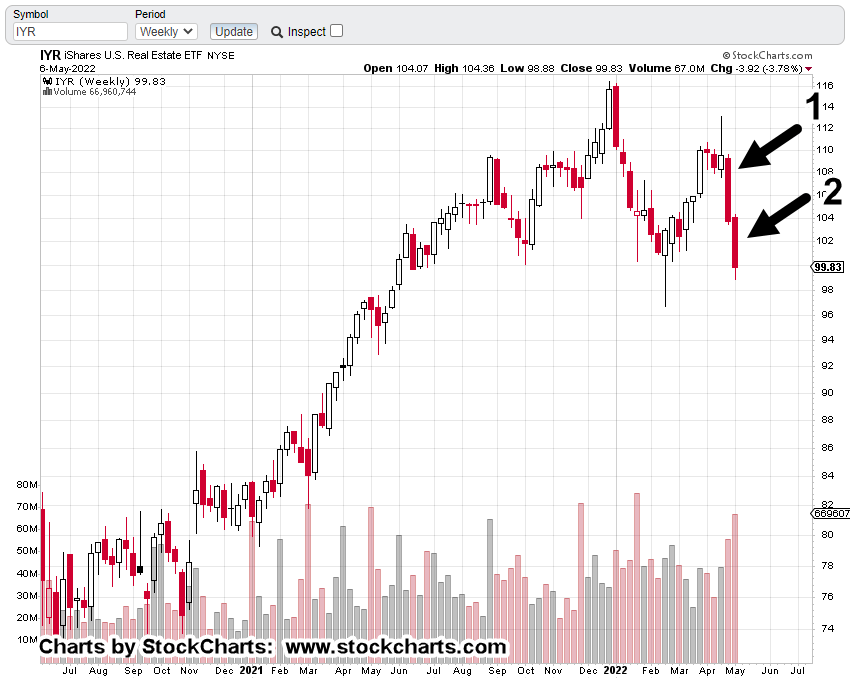
The following weekly chart, is marked up with two arrows.

Arrow No. 1

Initial short position via DRV was opened late in the day on April 28th; the day before the market broke significantly lower (not advice, not a recommendation).

Arrow No. 2

As the market headed lower during the week just ended, the size of the DRV position was increased by 36%.

Currently, the gain on the total position is about +22%.

At this juncture, the DRV stop is located well in the green in the unlikely event we get a sharp IYR, upward move in the coming week.

Summary

Under ‘normal’ conditions one could expect some kind of upward bounce in the days ahead.

However, as shown already with big cap leader PLD, the situation’s anything but normal.

Highlighted in earlier posts, biotech is leading the way with SPBIO, currently down – 59.8%, from its highs.

Biotech IBB, with chief cook and (globalist) bottle washer Moderna (MRNA), is down – 36.2%.

As Dan from i-Allegedly has stated time and again, we’re already in a depression.

So, buckle your seatbelt Dorothy …

Stay Tuned

Charts by StockCharts

Note:  Posts on this site are for education purposes only.  They provide one firm’s insight on the markets.  Not investment advice.  See additional disclaimer here.

The Danger Point®, trade mark: No. 6,505,279

Bears To Seize Control ?

World Chaos, Continues

The long-time reasoning behind this site’s ‘short only‘ trading plan, is becoming abundantly clear.

For years, there have been no ‘long’ trades on anything except leveraged inverse funds.

The premise? A ‘disconnect’ can happen at any time.

At this point, we’re getting to see those potential disconnects in real-time on a near continuous basis.

The past week bled-off the massive put leveraging; thus, setting the market up for (potential) downside reversal.

Getting Back To ‘Normal’

Those who bought the dip in Pavlovian fashion, may be thinking at some point, we’ll get back to ‘normal’.

News Flash:

What’s happening now, Is The Normal.

This is how it’s going to be on a go-forward basis.

Conflict, shortages, supply chaos, weather weaponry, nuclear saber rattling, bank runs are now, all normal.

With that, let’s look at last week’s markets and the set-up for the week ahead.

The SOXX, Rebounds

The last update discussed being short the semiconductors via inverse fund SOXS (not advice, not a recommendation).

The stop was hit, and that position (SOXS-22-02) has been closed out with a gain of about 6.2%.

Note how in the daily chart below, price action came right up to the stop level shown previously, then penetrated that level ever so slightly.

The ‘market’ knows where you are.

Being (stopped) out lets one look for a better opportunity.

Biotech (SPBIO), The Next Set-Up:

Turns out that biotech, SPBIO, may be at a low-risk juncture for a short via leveraged inverse fund LABD (not advice, not a recommendation).

Yesterday’s post highlighted some of the reasons for a biotech reversal.

The analysis below, builds on that reversal potential.

The weekly chart of SPBIO, has a channel and Fibonacci time correlation(s).

The next chart zooms-in on a possible target for a move lower.

Leveraged Inverse, LABD

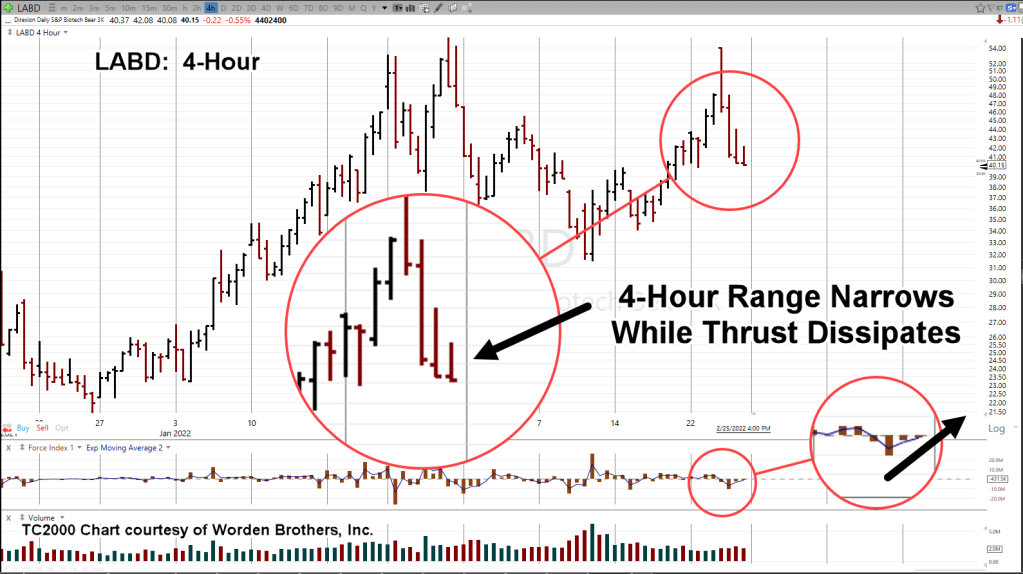
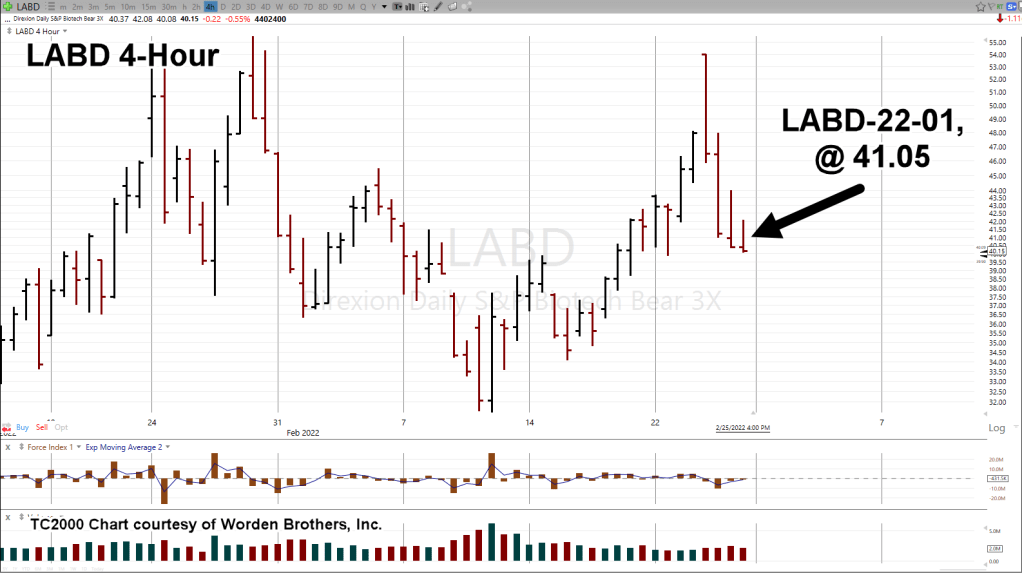
Another reason to think SPBIO, is ready to continue downward, can be seen on the 4-Hour chart of LABD.

The prior report had daily range narrowing.

Getting closer into the action, we see the 4-Hour range narrowing as well.

In addition, down-thrust energy (Force Index) for Friday’s move appears to be exhausted.

Positioning

Early or late? If you’re trading professionally, that decision must be made ahead of time.

Some traders like to wait for ‘confirmation’ of a move and there’s nothing wrong with that.

For this author however, waiting for confirmation means I’m late. I’m behind the curve and ‘chasing’ the market.

With that said, LABD was entered towards the end of the session on Friday at 41.05 (not advice, not a recommendation).

We’ll find out soon enough, if Monday’s open will be in-the-green.

Summary:

Even as this post is being created, world news continues to pour in … this time, from North Korea.

Anything can happen in the coming week. The markets could somehow ‘shake-off’ all of the news and move higher.

However, probability suggests market continuation to the downside.

At this juncture, we’re about six hours before the Sunday futures open.

Stay Tuned

Charts by StockCharts

Note:  Posts on this site are for education purposes only.  They provide one firm’s insight on the markets.  Not investment advice.  See additional disclaimer here.

The Danger Point®, trade mark: No. 6,505,279
Biotech … Ready To Reverse

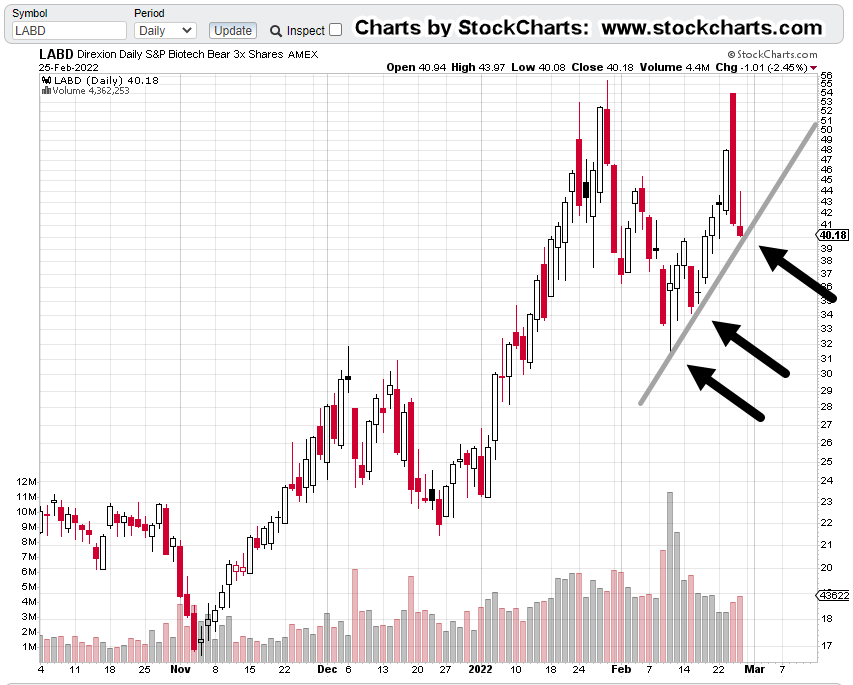
Highly leveraged (3X Inverse of SPBIO), LABD, looks ready for upside reversal.

The next chart shows trendline contacts.

Volume increased on Friday while the trading range narrowed significantly.

The next chart’s a little busy but zooms in on the volume and the daily range in question.

The overall markets have rebounded during the past two trading days.

Inverse funds have declined correspondingly.

Interestingly, LABD seems to have maintained its upward bias (down for SPBIO) better than other inverse funds like SDS, DXD, SOXS, QID and TZA.

Summary:

For downside action, one wants to look for the weakest sector.

Look for a new daily LABD high on Monday, (new low for SPBIO).

This is a typical entry signal with stops at the last session’s low; currently LABD, 40.08 (not advice not a recommendation).

Stay Tuned

Charts by StockCharts

Note:  Posts on this site are for education purposes only.  They provide one firm’s insight on the markets.  Not investment advice.  See additional disclaimer here.

The Danger Point®, trade mark: No. 6,505,279

‘Heart Failure’ … The New Normal

… What It Could Mean For Biotech

So, now it starts.

This just out from ZeroHedge, linked here, shows the ‘elephant’ has begun to go mainstream.

Another chess-move.

At least one previous post (No.1, linked here), has shown the phenomenon is not a one-off event.

Now, according to the link above, there’s an estimated 300,000 affected … and we’re just getting started.

Insiders Sell … Retail Buys

Do those at the highest levels know their customer base is about to evaporate on a world-wide basis?

While they may not know every detail, they at least know something’s up. Steven Van Metre discusses the insider selling in his latest update, linked here.

Front End Phenomenon

We’re still at the beginning stages of an event that in the opinion of this author, is going to last the lifetime of those reading this post.

‘Hyperbolic statement’ one might say.

To that, I would counter with this; when it was posted, the ‘elephant’ was hyperbolic as well.

Now? Not so much.

Keeping that long range thinking in mind also keeps one from choosing the ‘insane’ human behaviors discussed by Dan (I Allegedly) in his latest post.

So, let’s take a look at what type of insanity we have going on in the markets today.

Of course, that points us to our chief cook and bottle washer, biotech (IBB).

Biotech, IBB

When we last left our hero, savior, and protector of all that is natural immunity, the biotech discussion was on Moderna (MRNA).

The thrust higher, detailed in this post was thought to be too fast for a sustained reversal. Well, it was right and wrong at the same time.

Moderna wound up reversing … sort of.

At the same time, the biotech sector headed lower to support and is now moving higher.

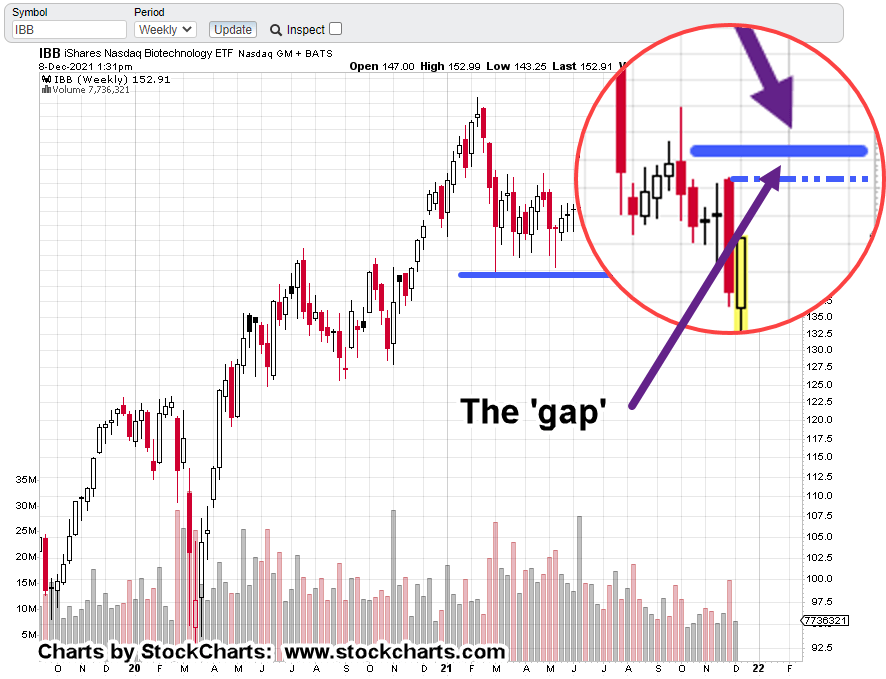
The weekly IBB, chart has the support (lower blue line) and potential up-thrust location (also 50%, retrace) identified.

The zoom shows the narrow gap between the weekly bars and 50% retrace.

If price action makes it past the resistance bars and into the gap, IBB would then be in up-thrust position (not advice, not a recommendation).

Stay Tuned

Charts by StockCharts

Note:  Posts on this site are for education purposes only.  They provide one firm’s insight on the markets.  Not investment advice.  See additional disclaimer here.

The Danger Point®, trade mark: No. 6,505,279


Panic In The Streets …

Remain Calm. All, Is Well.

All, Is Well !!!

It certainly feels like Animal House, doesn’t it?

A bunch of idiots running around, glued to the mainstream narrative.

However, let’s not digress but rather get to the chief cook and bottle washer at hand.

Moderna (MRNA) and Biotech (IBB).

Biotech: MRNA, IBB

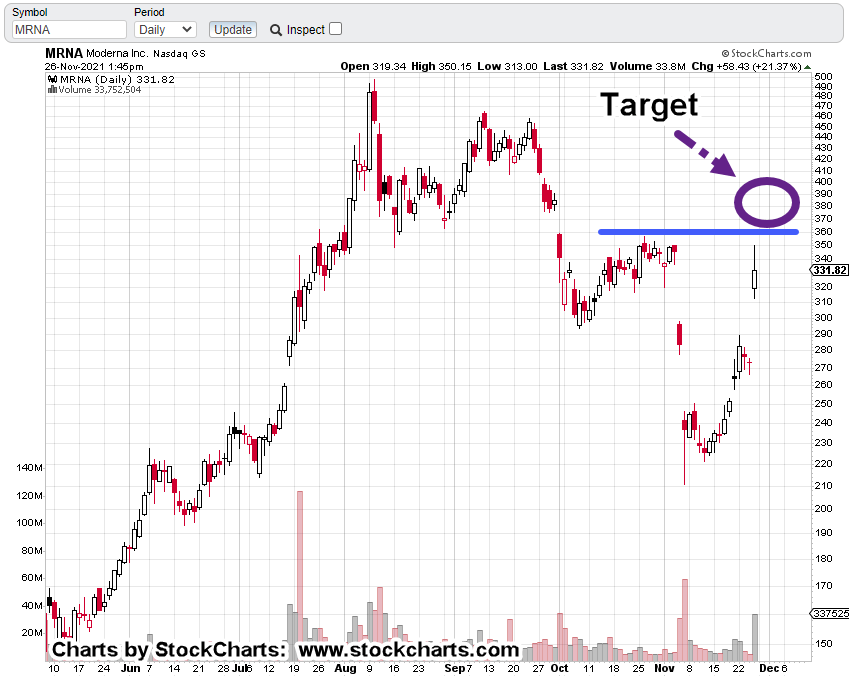
Moderna’s move above resistance (‘Target’ level in this update) seems too fast for up-thrust and reversal.

It could reverse from here.

However, the more likely scenario is the mainstream milks this whole thing all the way to Christmas and beyond.

That brings us to the sector itself, IBB:

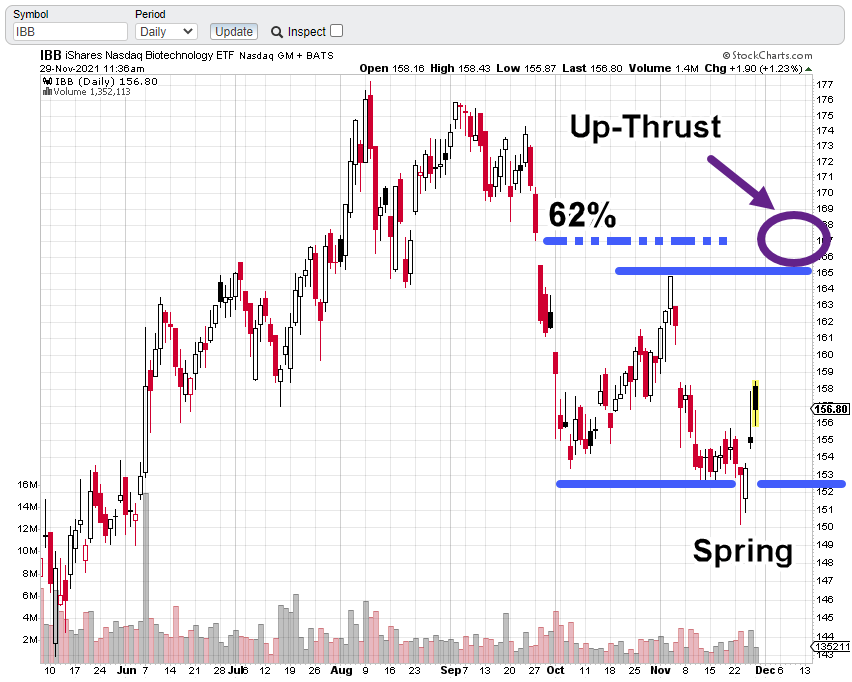
We’ll go straight to the marked-up (daily) chart.

It’s starting to look familiar isn’t it?

Spring-to-Up-Thrust … Spring-to-Up-Thrust

But wait … there’s more!

A Fibonacci 21-Days from the most recent IBB, low on November 23rd, puts the date at December 22; The Winter Solstice.

How convenient.

Of course, anything can happen between now and then. At least we have a potential target and scenario.

As with the gold miner’s (GDX) short that’s still on-going (not advice, not a recommendation), we get to see how it all plays out.

Will Biotech, IBB, be in up-thrust (reversal) position, on or around December 22nd?

Stay Tuned

Charts by StockCharts

Note:  Posts on this site are for education purposes only.  They provide one firm’s insight on the markets.  Not investment advice.  See additional disclaimer here.

The Danger Point®, trade mark: No. 6,505,279
… Cue The ‘Hype’

Right On Schedule … A New ‘Variant’

Seems like just yesterday, we were saying:

“There’s all kinds of nastiness in the guise of ‘new strains’ out there; likely to raise their heads before Christmas and probably after as well.”

Wait, … that really was, yesterday.

So, now we have the ‘Nu variant’.

Get it? A, new variant. 🙂

The ‘Epsilon’ variant (from the idiot in Brave New World) is probably being saved for last … because if anyone’s still believing the hype by that time, it won’t matter … they’ll be fully ‘boosted’.

That doesn’t mean the pros can’t make money off the herd … while there still is a herd.

Which brings us to today’s underside test action of MRNA.

Moderna (MRNA):

Well, that retrace was quick.

First, let’s show yesterday’s weekly chart.

And now, today’s

It’s true that price action is testing the underside.

However, if we go to the daily chart (below), we can see if price action can make it just a bit higher … to the 360 – 380 area, then we have an up-thrust (potential reversal) condition.

The chart looks similar to our gold (GLD) up-thrust target, linked here for reference.

Recall, for that set-up, it took two months for GLD, to penetrate resistance … and then go into a vicious reversal.

Stay Tuned

Charts by StockCharts

Note:  Posts on this site are for education purposes only.  They provide one firm’s insight on the markets.  Not investment advice.  See additional disclaimer here.

The Danger Point®, trade mark: No. 6,505,279