Has Our Hyperinflation ‘Nutcase’ Escaped?

Well, ladies and gentlemen, here we are.
We’re about to find out if silver (SLV), is headed for a breakout, sideways congestion and/or, outright reversal.
In a world that seems to be allergic to the truth (as serpentza, put it), we’re going to do just that; look at the truth, the price action itself.
The last update, link here, said to watch for an SLV, breakout that could fail, confirming a bearish divergence.
From the intro line, here we are.
We have the breakout.
All that’s missing is continuation higher or reversal (not advice, not a recommendation).
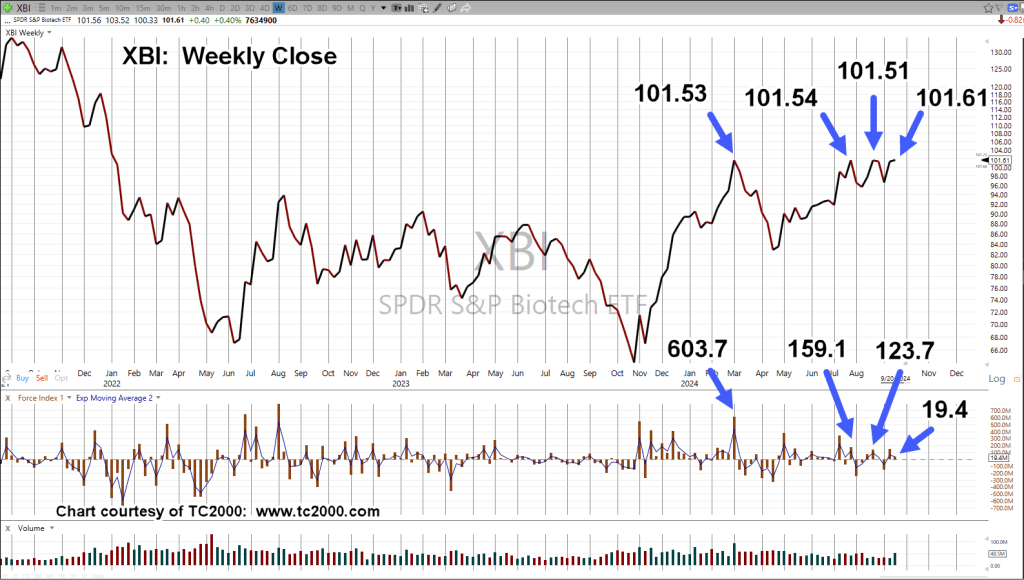
So, let’s go to the truth of the matter, the SLV chart.
Silver SLV, ETF, Daily
Years ago, Dr. Elder stated, when MACD histogram and MACD lines are parallel (bearish divergence), it’s a rare occurrence.

The coming week might be the deciding factor.
Before we leave this post, let’s throw in a bonus and consider the dollar ‘collapse’ narrative.
Dollar ‘Collapse’, Where?
Below is an updated chart of the dollar index.
Note the arrow to this link, posted nearly four years ago!
Dollar Index UUP, Weekly

It’s important to note, at the time the ‘Reversal Ready’ post was created, there was absolutely no-one (that was known) indicating the dollar index was headed significantly higher.
This is what’s meant by ‘Strategy’ in the About section.
Livermore was focused on what’s going (or likely) to happen in a big way.
Stay Tuned
Charts by StockCharts
Note: Posts on this site are for education purposes only. They provide one firm’s insight on the markets. Not investment advice. See additional disclaimer here.
The Danger Point®, trade mark: No. 6,505,279