Note: Posts on this site are for education purposes only. They provide one firm’s insight on the markets. Not investment advice. See additional disclaimer here.
The biotech short LABD-25-05, has been closed: Profit on the main position is +61.25% (not advice, not a recommendation).
While the market is hysterical, price action in XBI, indicates the current down move is losing (some) energy, hence the reason for the exit.
Biotech XBI, Daily
Exit was made at the lower channel line (demand line) contact.
The market could certainly continue lower from here.
However, from past experience and watching huge profits erode to only mediocre results, the same mistake is not being presented here (not advice, not a recommendation).
Meanwhile, the gold miners don’t look like the safe haven everybody thought they were.
Note: Posts on this site are for education purposes only. They provide one firm’s insight on the markets. Not investment advice. See additional disclaimer here.
Those on this site daily, knew something was about to happen in a big way.
It was just, when.
Now, markets are volatile if not imploding.
Nearly all sectors reversing at once.
As of this post (10:55 a.m., EST), some of those are attempting to recover (GDX, GDXJ, SILJ) with others down hard (not advice, not a recommendation).
There were plenty of clues:
Massive volume increase in GLL, strange activity in biotech, then resignation at the FDA, failure of NVDA to get back to a 50% retrace, the list goes on.
As mentioned yesterday, one sector that’s continuing lower is biotech, XBI.
Biotech XBI, Daily
There may be several trading channels in effect. Only the most aggressive (so far) is shown.
Note the locations of short positioning via LABD (not advice, not a recommendation).
As of this post, the initial LABD short, entered on March 25th, is up over +40%.
Going Forward
So, what happens now?
For this trade, Livermore said it best (paraphrasing):
Position on the right side of the market (the correct direction), then wait.
Note: Posts on this site are for education purposes only. They provide one firm’s insight on the markets. Not investment advice. See additional disclaimer here.
Sometimes, the question is not ‘what’s happening’, but ‘what’s not happening’.
In today’s case, we have gold (GLD) at new highs and the miners, not.
Not only are they not following gold higher, for the Juniors GDXJ, and the ‘Silvers’ SILJ, they both posted a new weekly low.
Junior Miners, GDXJ, Daily
Last Friday was a reversal bar.
Today (so far) we have gold at new all-time highs and the miners lagging (not advice, not a recommendation).
As of this post (12:54 p.m., EST), GDXJ, has moved up to test Friday’s low.
While price action retraces to test, it’s closing the gap on the amount of risk for a short position.
With that in mind, a direct short of GDXJ, has been opened (GDXJ-25-01) with the stop at (or to be) the session high (not advice, not a recommendation).
Note: As a result of the gold hysteria, YouTube grifting, book writing, podcast interviews, dollar collapse, and ‘It’s all coming down’ mania, instant gratification on this position is not expected. 🙂
Note: Posts on this site are for education purposes only. They provide one firm’s insight on the markets. Not investment advice. See additional disclaimer here.
Note: Posts on this site are for education purposes only. They provide one firm’s insight on the markets. Not investment advice. See additional disclaimer here.
The Good: Only the Senior Miners, GDX, have managed to claw their way past the highs set nearly five years ago in August of 2020.
The Bad: Junior Miners GDXJ, remain below that August ’20, level.
The Ugly: Silver Miners SILJ, are the worst, having their peak a bit later in February of 2021; they remain over -35%, below their highs.
The Market Rolls Over
Yesterday, Friday, was a down day for the Dow, S&P, The Qs, Transports, Airlines, Semis, nearly everyone.
For some of these indices, their all-time highs were posted months, if not years ago.
There may be some (bidding) ‘defensive’ action with gold (GLD) continuing higher; as said in earlier posts, the rest of the monetary metals are far below their highs.
Let’s look at the weakest; the silver miners, as they are likely going to be the ones most affected by an economic decline (not advice, not a recommendation).
Silver Miners, SILJ, Daily
We’re at an interesting spot.
Friday was a down day that pushed below existing support, shown in zoom area.
We have simultaneous action.
Once resistance was penetrated on March 18th, it could not hold. After eight trading days, on Friday, it posted lower on heavy volume.
However, we can see that SILJ, is now in (a minor) Wyckoff ‘spring’ position. So, the question is, what happens next?
Note: Posts on this site are for education purposes only. They provide one firm’s insight on the markets. Not investment advice. See additional disclaimer here.
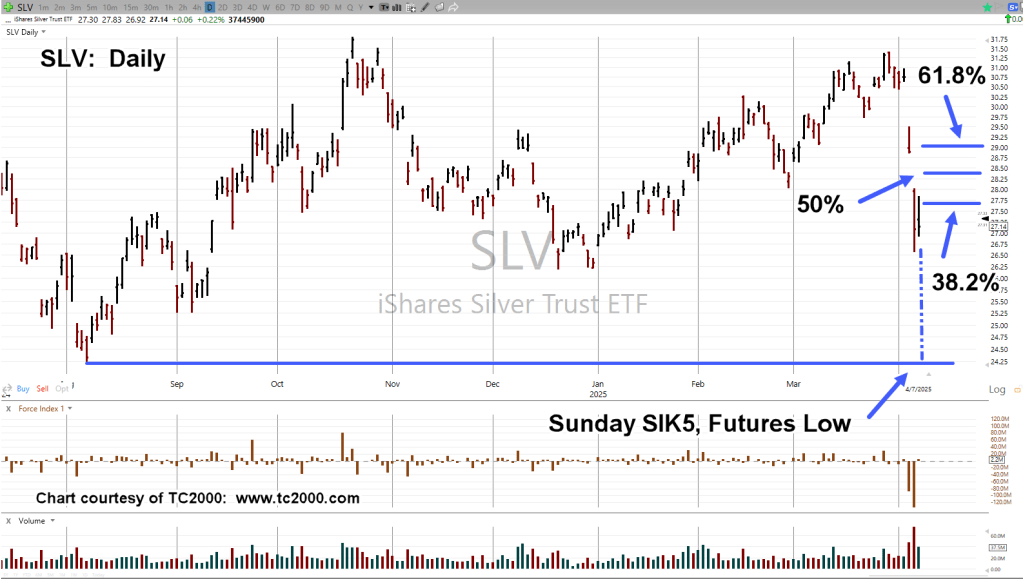
We’re just hours away from the Sunday futures open.
Yesterday, military attacks on Houthi rebels have commenced; links here, here, and here.
Middle East conflict escalates.
The question is, will the markets see it that way?
Will it be ‘escalation’, with gold futures ever higher, or is it ‘buy the rumor, sell the news’?
If we’re looking at potential gold/silver related downside, then let’s review the miners; they’ve been in a bear market for nearly five years (not advice, not a recommendation).
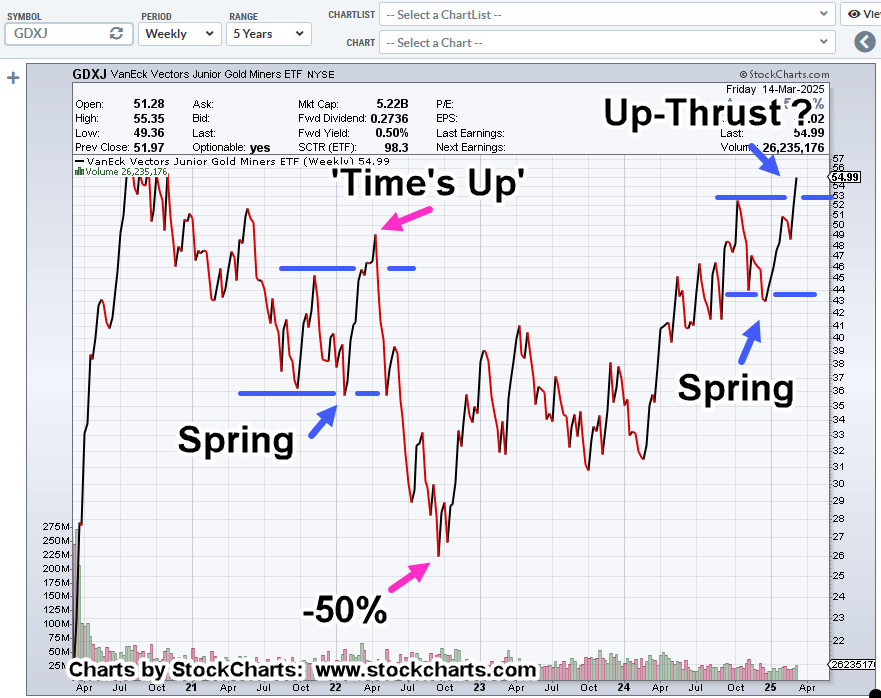
Junior Miners, GDXJ, Weekly Close
Before getting to the right side of the chart, let’s start with the ‘Time’s Up’, arrow; a reversal and decline over 50%.
At this point, gold and the miners appear to be stretched with silver currently in non-confirmation.
If it was really (simple) inflation, it would be like the 1980s, with both moving in tandem.
Then & Now
With that, what has GDXJ, done in the past?
The chart itself shows us it tends to exhibit a repeating pattern of Wyckoff ‘spring-to-up-thrust’.
We may know within hours if gold, silver, and the miners, are going to reverse or launch into some kind of extended rally (not advice, not a recommendation).
Note: Posts on this site are for education purposes only. They provide one firm’s insight on the markets. Not investment advice. See additional disclaimer here.
Out in the mainstream, they tell us the smart money (maybe, even retail) is selling, or selling short, here, here, here, here and here
There’s also recession talk, here; couple that with utter confusion, here.
Then, if we do have a ‘recession’ (or depression) it’s time to blame somebody, right?
As Dr. Elder said years ago (paraphrasing):
‘When there is a change the market, there’s a lot of turbulence before action settles into a definable trend.’
Taking everything in aggregate above, that could be where we are now.
In Style
Some of the links above, are still attempting to make a bullish argument.
For them, it’s not quite time to have a bearish stance. It’s not yet fashionable.
For this site however, every trade (453 of them) for last year, 2024 (ex. UNG), was to the short side (not advice, not a recommendation).
By the time, the bear has fully clawed the market (if or when), it’s most likely too late for any low-risk positioning.
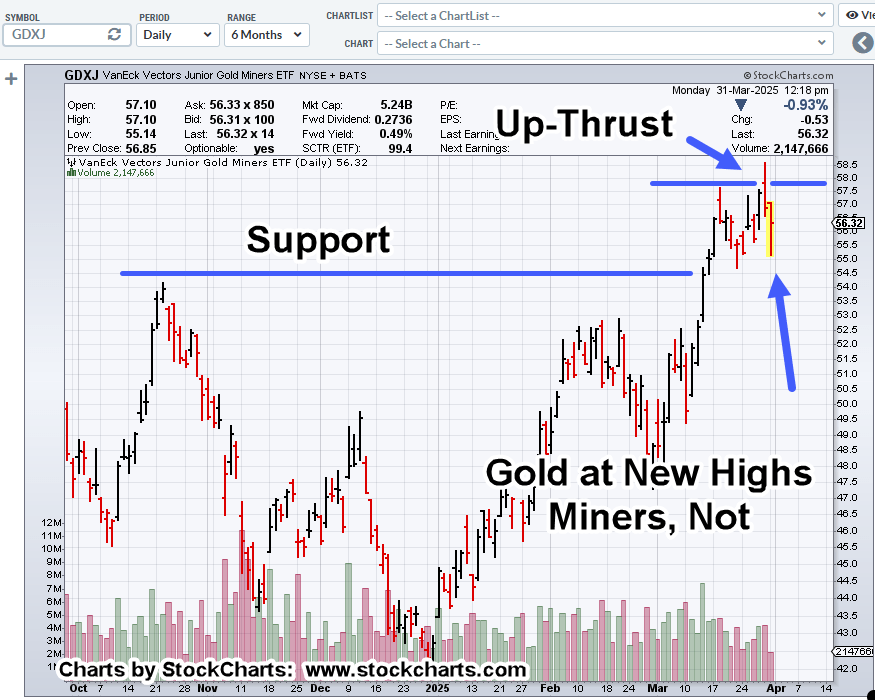
One market that may be acting as a defensive move, are the miners, GDX, GDXJ.
Junior Miners GDXJ, Daily
GDXJ, is either slipping away to the downside or it’s preparing for another attempt at higher prices.
At this point (1:12 p.m., EST), the support/axis line has not been decisively penetrated to the downside, suggesting probabilities are for higher prices (not advice, not a recommendation).
Before anyone gets overly bullish, let’s also keep in mind, the high print at the left of the chart in October of last year, is still below the print discussed in this post. over four years ago (not advice, not a recommendation).
Note: Posts on this site are for education purposes only. They provide one firm’s insight on the markets. Not investment advice. See additional disclaimer here.
Yesterday, biotech had moving average compression; today, it’s Alcoa.
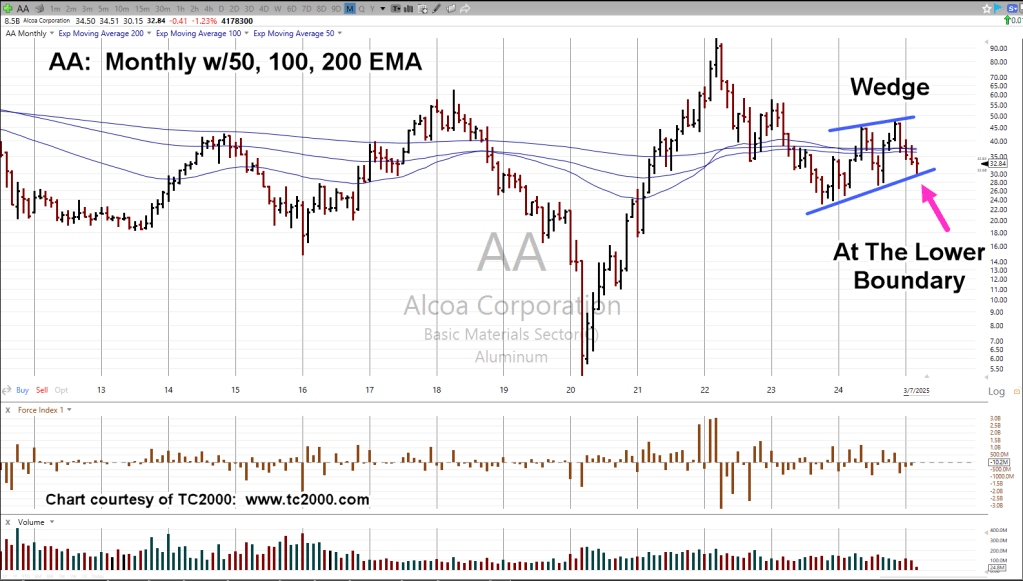
In this case, we’ll present the monthly chart, showing the long-term picture.
As we’ll see, moving average compression is rare, especially when using the longer time-frames.
In the case of Alcoa (AA), you have to go all the way back to 1978, to find a similar event.
The Big Bubble
Referring to Prechter’s analysis link here, he states that we’re [potentially], in the largest asset bubble since the South Sea, over 300-years ago.
Let’s keep that in mind. Events are happening on such a massive scale; the typical observer may not be aware of the significance and/or the rarity.
Alcoa AA, Monthly
The zoom areas are side-by-side to show the similarity.
Expanding the chart and including the wedge notation, also shows price action at the lower boundary.
It should be noted, AA, is part of the ‘Basic Materials’ sector, with tracking ETF as IYM.
Included in the IYM components, is NEM, and RGLD; this sector is correlated with the miners, GDX, GDXJ.
Positioning
It’s the trader’s discretion as what to do at this point.
This site may or may not execute a direct short of Alcoa, just as it might do with Carvana (CVNA), and maybe others (not advice, not a recommendation).
Note: Posts on this site are for education purposes only. They provide one firm’s insight on the markets. Not investment advice. See additional disclaimer here.
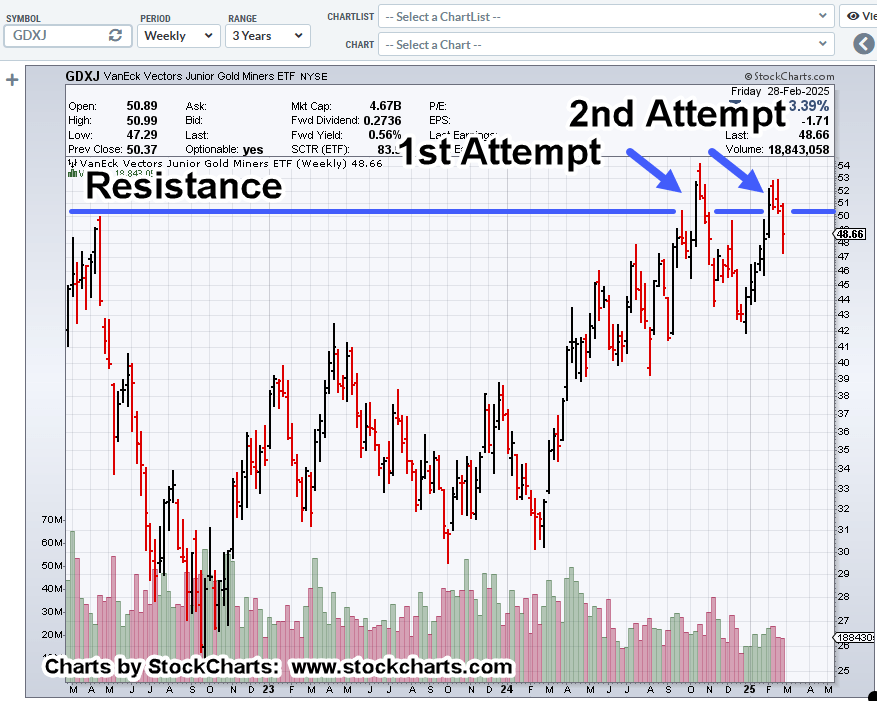
The next day, one more new daily high before reversal; short trade JDST-25-01, was closed early in that session (not advice, not a recommendation)
Note the tight price action just above resistance in the ‘2nd Attempt’; evidence of a struggle.
What we’re looking for in the coming week (best case) is to see continued GDXJ, upside to close the distance to the resistance area; thus reduce (but not eliminate) the risk.
Note: Posts on this site are for education purposes only. They provide one firm’s insight on the markets. Not investment advice. See additional disclaimer here.