Um, … Weren’t We Going To The Moon ?

One hour, and fifteen minutes after this post was released, gold and the miners topped-out.
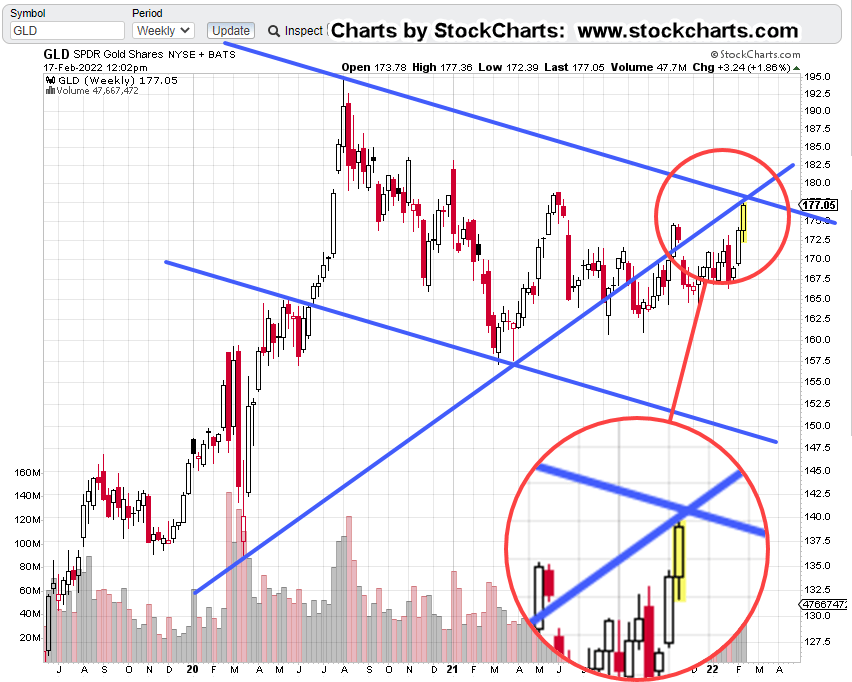
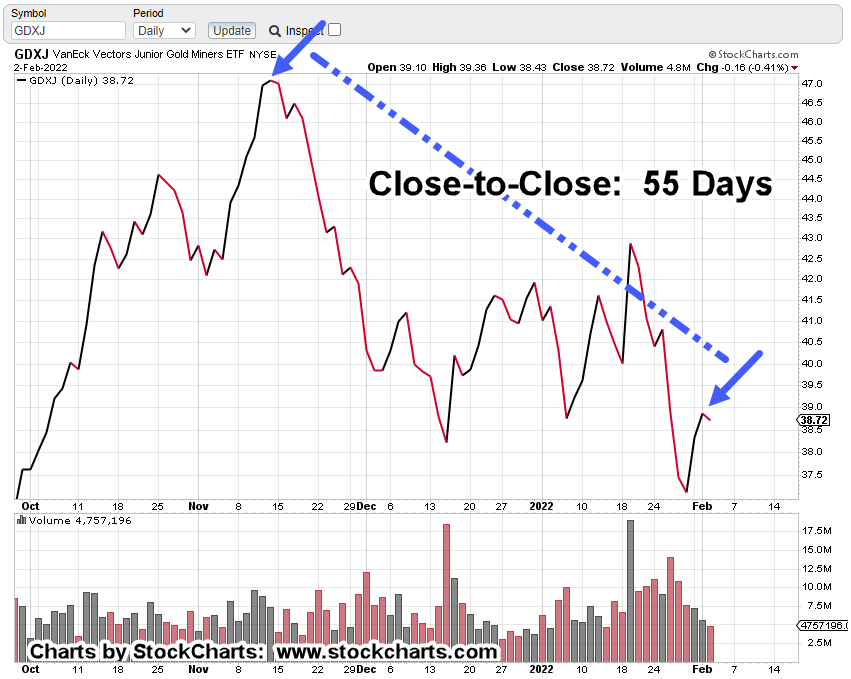
Depending on the close for today, gold futures prices may post a weekly reversal bar.
If it happens, that’s an important nuance.
The prior reversal from all-time highs … back in early August of 2020, did not happen on weekly reversal bar or even a daily bar.
What does that mean or what could it mean?
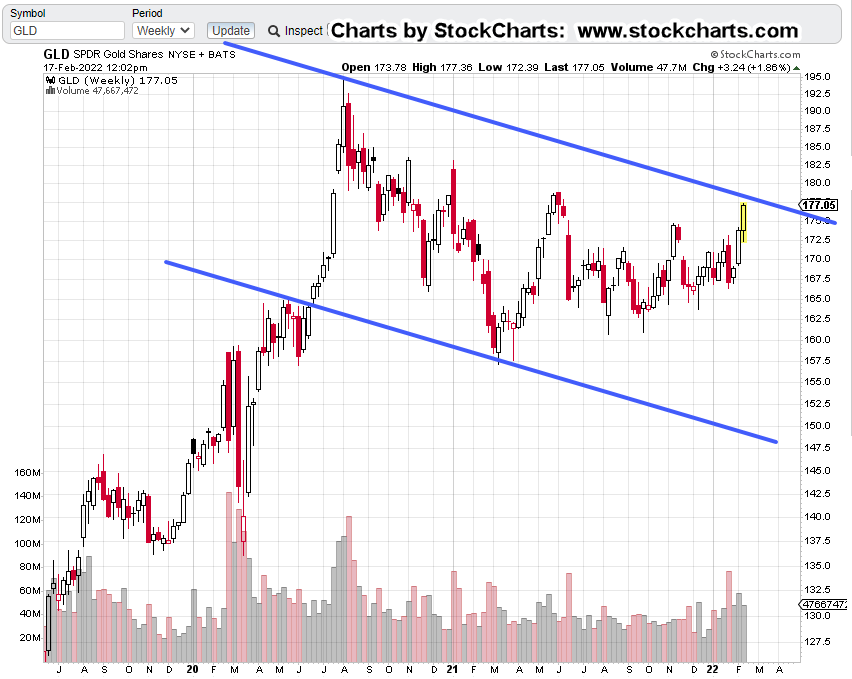
Unlike last time where gold (GLD), hovered around its all-time highs for a couple of weeks, this time, it looks like it can’t even do that.
We’re at the danger point.
For the gold tracking fund GLD, the price to watch is Monday’s open at 184.45. Closing below that level, indicates trouble for the bulls.
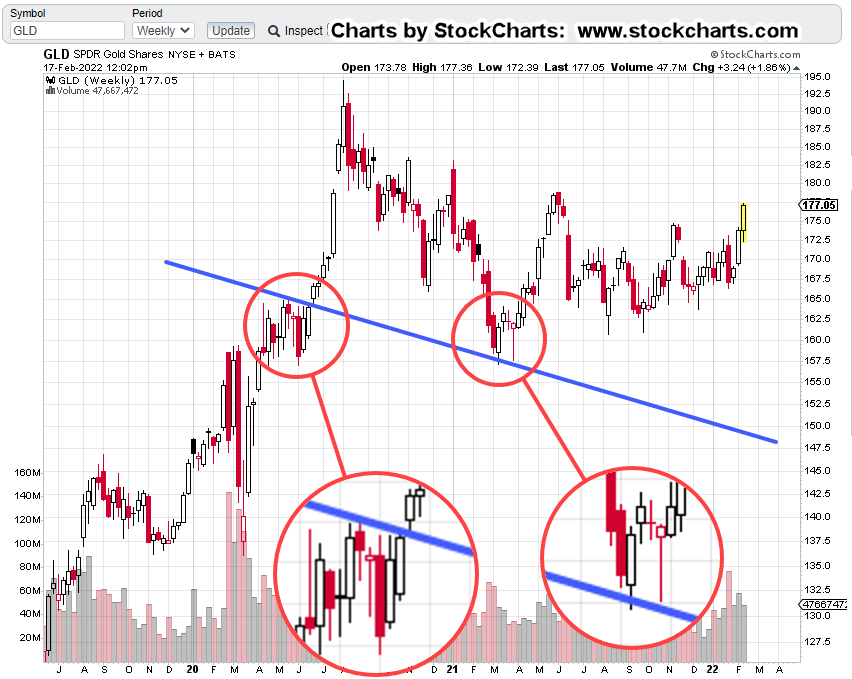
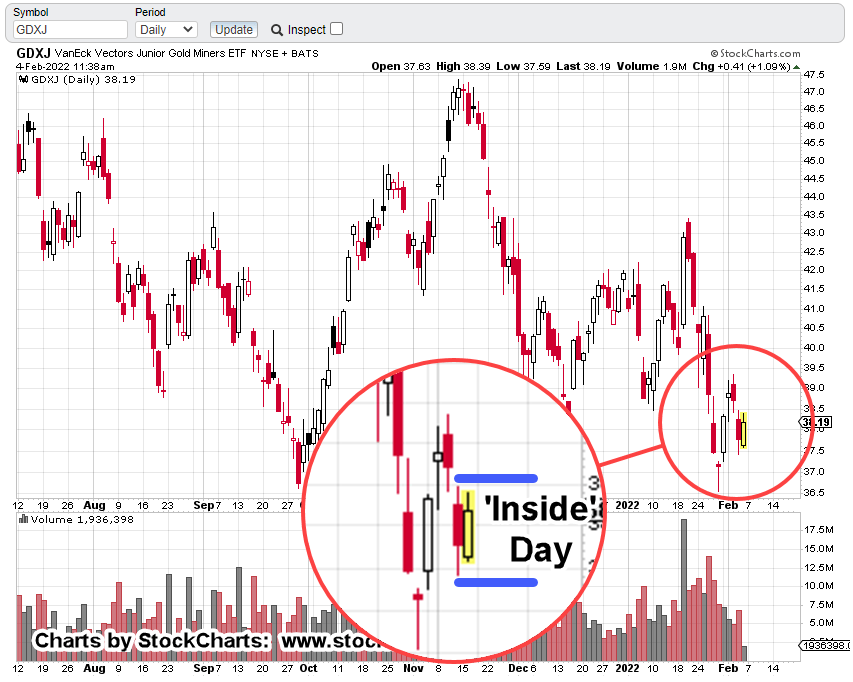
Gold (GLD), Daily Chart
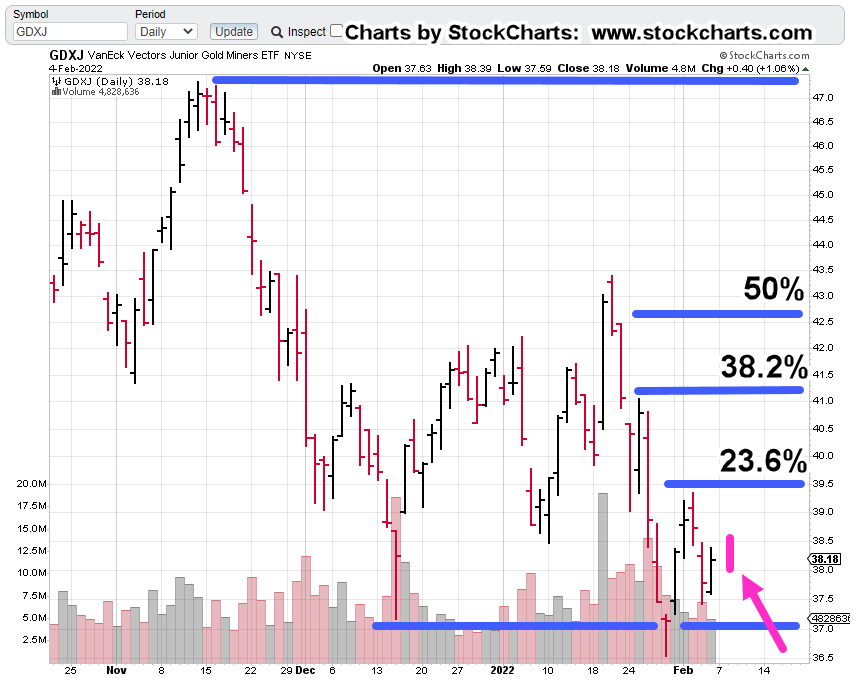
Twelve months of daily price action shows the build-up, to the blow-off.

Below, we have a ‘measured move’ target completed.

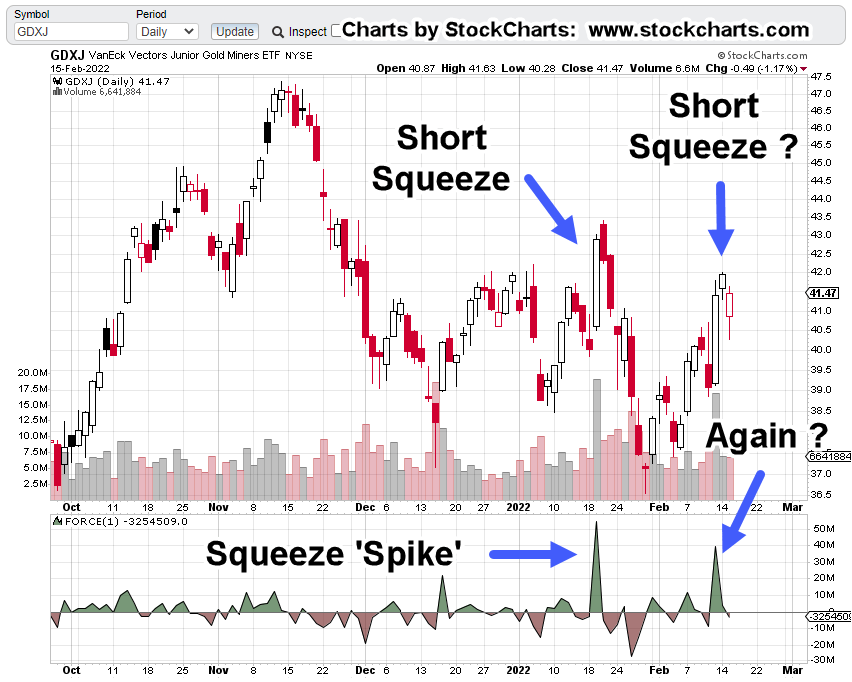
Then, we have a volume climax.

Changing of hands from strong to weak.
Such volume spikes typically indicate the potential for a long-term, sustained reversal.
Contrary View
This analysis isn’t contrary just to be contrary.
We’re looking for market truth. Meaning, ‘what’s the market saying about itself?’
Once that truth is found or at least probabilities identified, then it’s incorporated into a strategic plan.
Go-Forward Strategy
At this point, it’s more than obvious, food and the food supply, is literally going to be the choke-point.
As nations world-wide, scramble to secure reliable food sources, anything can happen. They can even resort to selling-off their gold reserves en-masse, to pay for the insane commodity prices.
Don’t think that can happen?
Well, oil futures couldn’t go negative either, right? Nickel couldn’t surge to record highs on the largest single-day jump ever, right?
London Metal Exchange (LME) would never cancel trades and fudge their numbers, right?
What couldn’t happen then, is likely to happen now.
There’s a chance gold will not post a weekly reversal at the end of this session (currently, 12:53 p.m., EST). If so, it holds open the probability for an upward test or series of tests in the coming week.
Stay Tuned
Charts by StockCharts
Note: Posts on this site are for education purposes only. They provide one firm’s insight on the markets. Not investment advice. See additional disclaimer here.
The Danger Point®, trade mark: No. 6,505,279