Volatility Event: Newmont Mining

Alignment Of The Bears

“Volatility Is Good”

Volatility cauterizes the emotions. It reveals the market extremes and shows each player’s hand; bulls and bears.

With the market just opened we’re going to look at gold’s last man standing: Newmont Mining.

‘Last man standing’ because, except for two equities far down in Senior Miner’s GDX, no one is anywhere near their mid-November highs.

The take on this: The gold market’s thinning out and ready to reverse.

A really big move

It’s easy to get lost and hypnotized with the day-to-day action. However, by pulling back, one sees the potential for a massive short (the market) opportunity (not advice, not a recommendation).

Implosion Effects: Broker Platforms Go Inoperative

Over and again, nearly each time there’s a big down move in the markets, where the Dow may lose 1,000 points or more, brokerage platforms seize up.

It happens so often; it’s probably best to incorporate it into one’s trading approach.

That’s one of the reasons, if not the main reason to work the short side (not advice, not a recommendation).

Newmont’s Short Clues

The volatility has exposed everybody’s hand on both side of the trade. That’s the good part.

We’ll touch on each technical event separately, starting with the unmarked daily chart:
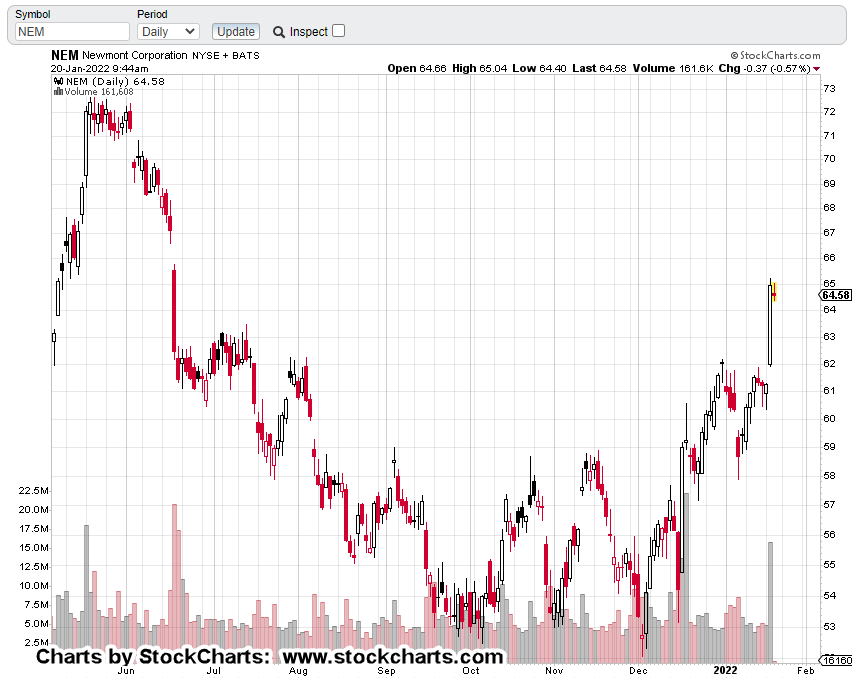
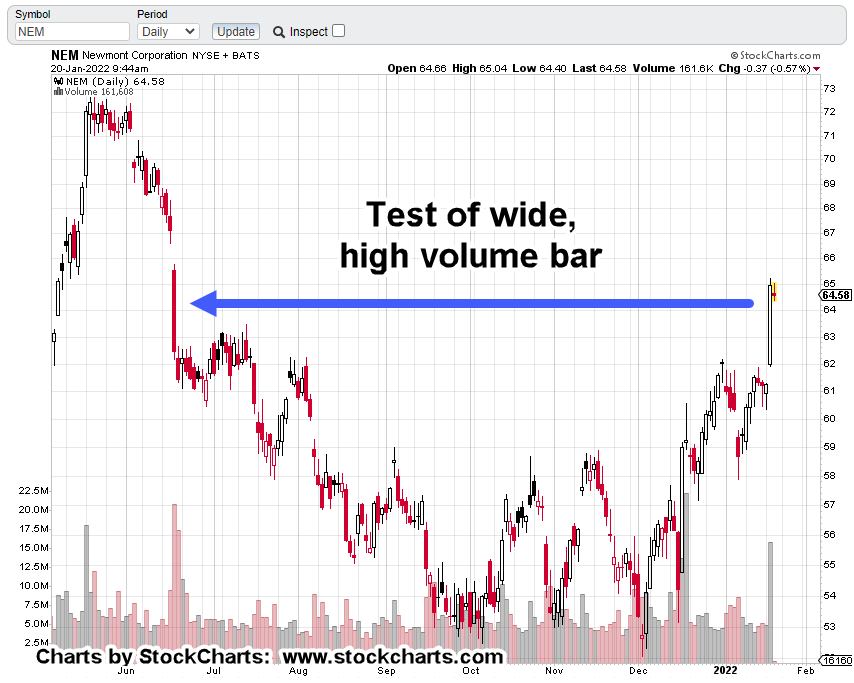
First off, markets that have wide, high-volume bars, tend to come back and test that bar. We see it below:
Next, price action’s got itself into a terminating wedge; a potential bearish reversal pattern:

Then, we have today as Fibonacci Day 34, from the December 2nd, reversal low.
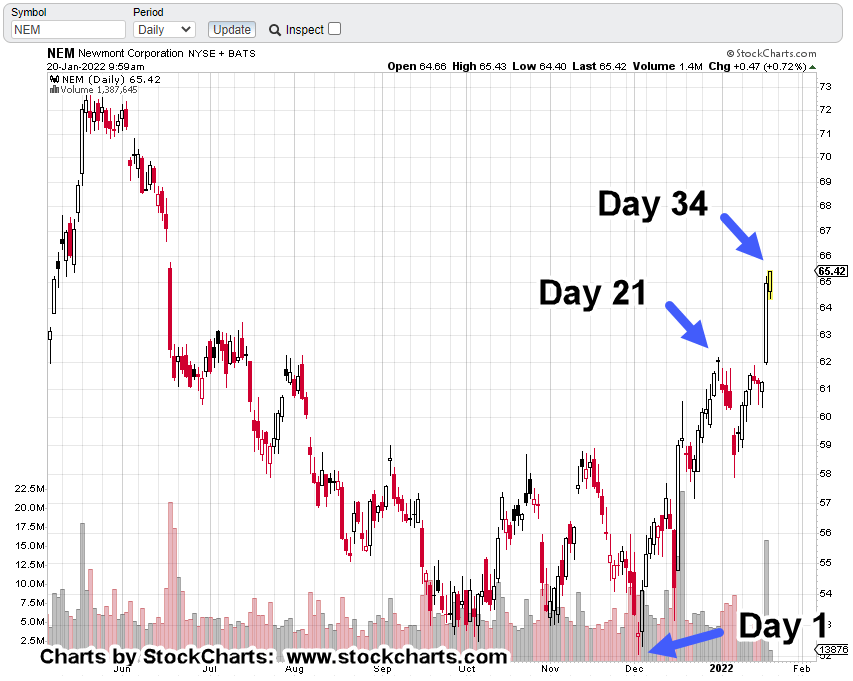
As this post is being created, NEM just made a new daily high; potentially culminating its wedge terminating move.

Big Fish, Little Hook

As Dr. Elder has said concerning stop placement, ‘You can’t catch a big fish with a little hook’.

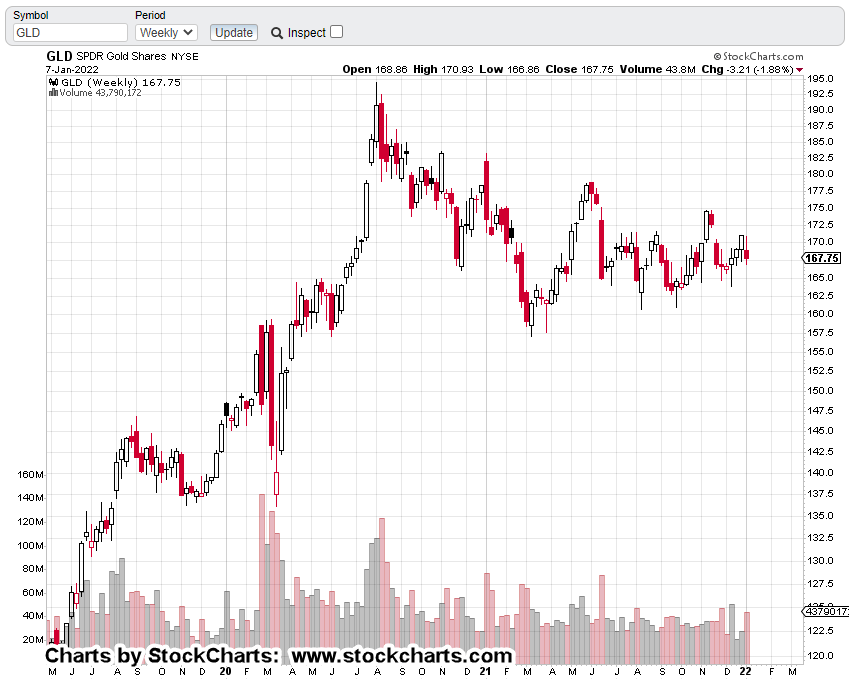
So, we have GLD, GDX and GDXJ, in a November bull trap (up-thrust), with what looks like two-months of price action to come back and test.

If that assessment’s correct and it took two months just for a test, whatever happens next, may be on the order of years to resolve itself.

From a trade standpoint, it looks like today’s low in JDST, current open position, JDST-22-01, may be a good place for a stop (not advice, not a recommendation).

Newmont, Reversing

After Newmont posted a new daily high, it’s currently trading below yesterday’s close.

Deflation Pivot-Point

We have the usual hysteria in the gold market but this time, deflationary forces may be overtaking the manic gold bulls.

Case in point:

Existing home sales look like they’re rolling over. All kinds of excuses being made about lack of inventory and the imaginary ‘Speck’ with its new variant.

The one thing not imaginary about The Speck, is this report about what’s really going on.

Massive ‘depopulation’, is deflationary.

Stay Tuned

Charts by StockCharts

Note:  Posts on this site are for education purposes only.  They provide one firm’s insight on the markets.  Not investment advice.  See additional disclaimer here.

The Danger Point®, trade mark: No. 6,505,279
Gold Test ?

Updating Now; Not Waiting For Tomorrow

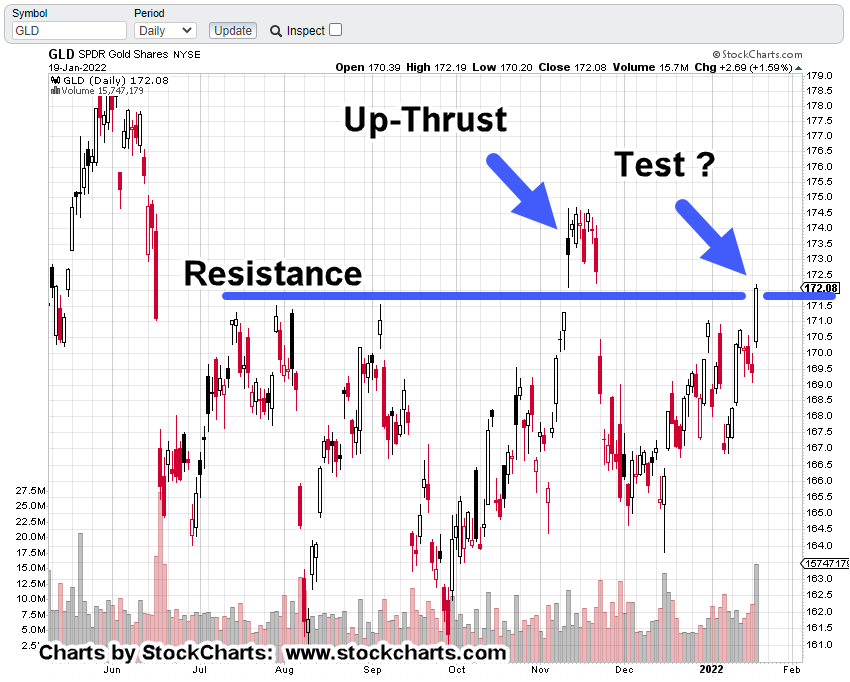
If this is a test of the mid-November up-thrust, things may happen quickly from here on out; with that in mind, it’s important to get it all (technical data) out in the open.

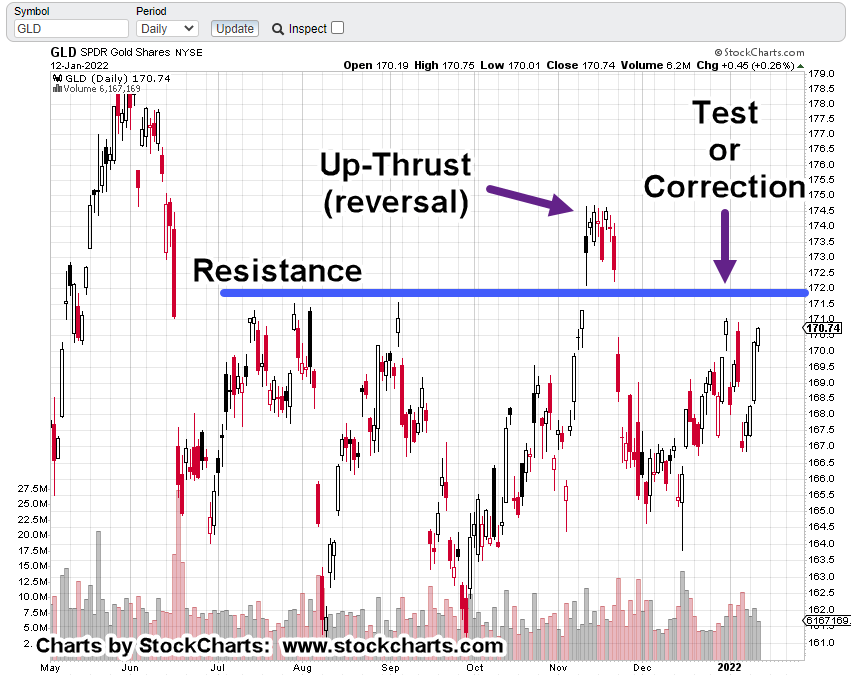
The gold (GLD) chart is similar to the GDX that was discussed in the prior update.

It could be a test of the bull trap from last November.

If that’s indeed the case, and price action reverses lower from here, the downdraft could be more than significant.

Position Change

Instead of lightening-up on the DUST-21-01 position as stated, that position was modified.

The DUST-21-01 was closed out. Then, a position in JDST opened immediately; currently labeled as JDST-22-01, with nearly the same position size.

The gold market appears to be thinning out.

We want to pick the weakest part of the sector for downside potential (not advice, not a recommendation).

The Junior Miners. GDXJ, have been lagging the Seniors GDX, for some time.

Today appeared to be a good opportunity, with everything at extremes, to make the change (not advice, not a recommendation).

Stay Tuned

Charts by StockCharts

Note:  Posts on this site are for education purposes only.  They provide one firm’s insight on the markets.  Not investment advice.  See additional disclaimer here.

The Danger Point®, trade mark: No. 6,505,279

Miners … End of the Thinning ?

There are violent moves today in gold; both gold (GLD) and the miners, GDX.

One could think, maybe rightly so, the whole market, the miners, gold and silver, are kicking off a massive bull run.

On the surface, it looks that way.

Looking deeper, maybe not.

It could be a test of the November ’21, reversal.

Looking at charts of both Newmont and Senior Miners, GDX (we’ll cover gold tomorrow), the prior assessment, the market’s thinning-out applies even more.

Everything possible is being thrown into the last man standing: Newmont.

The violence of these moves is obvious.

Newmont (NEM) and GDX: Daily Charts

We’re going to put the unmarked chart of Newmont (NEM) and GDX directly below. The key takeaway is how far above NEM, is from its mid-November highs.

Then, look at GDX and note, it’s close but well below its mid-November highs.

This market (Senior Miners) continues to thin out … and it’s doing it violently.

Newmont (NEM):

Senior Miners, GDX:

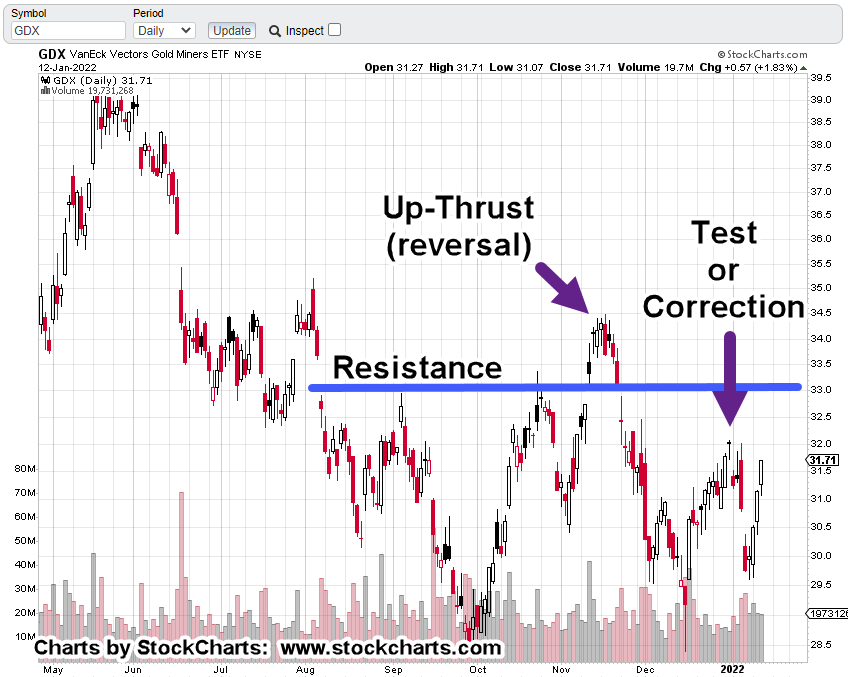
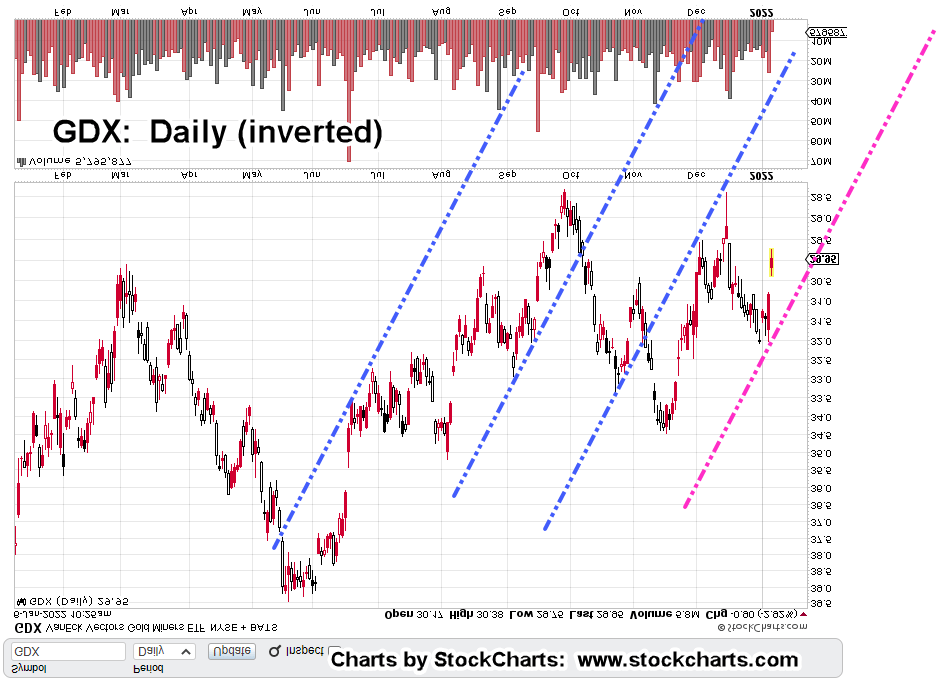
Looking at the marked-up chart of GDX, it’s possible all of the action over the past two months, was to get into position to test the upthrust:

If an up-thrust “test” is the correct way to view this action, with gold (GLD) in a similar position, and if price action can’t hold these levels, the ensuing downside stands to be even more violent.

Run Fast, Or Not At All

Before the end of this session, DUST-21-01, will be reduced to be in compliance with margin requirements.

At mid-session, that reduction would be in the area of 12% of position size (not advice, not a recommendation).

Stay Tuned

Charts by StockCharts

Note:  Posts on this site are for education purposes only.  They provide one firm’s insight on the markets.  Not investment advice.  See additional disclaimer here.

The Danger Point®, trade mark: No. 6,505,279

Gold Miners … The Short Side

The Second, ‘First Lesson’: Go Short

‘Don’t lose money’.

That’s the first lesson in trading.

The other ‘first lesson’; the short side can be (and usually is) more profitable and faster than, the long side.

Anybody’s whose paying attention at this point, knows that ‘something in the market’s going to pop’.

We, in the serfdom, don’t know what or where it is; just that there’s a sense of an event just off the horizon.

From a personal standpoint, to be holding (or maintaining) long during a market upset is the last place one wants to be (not advice, not a recommendation).

Which brings us to shorting the gold market and more specifically, the Senior Miners, GDX.

Senior Miners, GDX

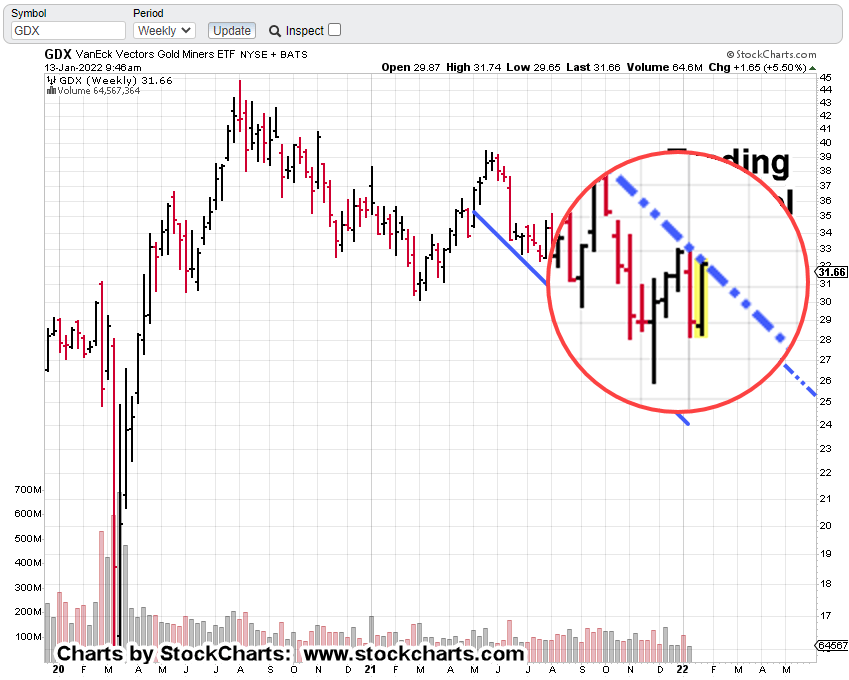
The weekly chart of GDX shows where we are; the market just opened for the day.

It might not look like much is going on … that is, until we show the trading channel.

The right-side trend-line has been purposely shown as ‘dashed-line’ so that when we zoom-in below, we can clearly see GDX, is at the danger point.

This is the exact location where risk is least (not advice, not a recommendation). We’re right at the trendline.

At this point, price action’s still posting below last week’s GDX high of 32.03

GDX Leveraged Inverse, DUST

Looking at the inverse chart DUST, we’ve just posted a new daily low (new daily high for GDX) while at the same time being at Fibonacci Day 21, from the top of the December 15th reversal/correction.

We’ve already had the ‘first correction’ as shown the trade model below.

The ongoing test of that correction was unexpected but not out of the norm for price action behavior.

If the gold miners, GDX are to reverse and continue lower in their channel, today is a high probability day for that reversal (not advice, not a recommendation).

Let’s review the trade model (checklist) thus far:

The System:

  1. The Set-Up 
  2. The ‘test’ or ‘gut-check’
  3. The first ‘correction’
  4. Continuation or Failure
    1. Trend identification
    2. Potential channel(s)
  5. Exit process
    1. Scale out
    2. Full exit
  6. Post trade evaluation

At this juncture, we’re right at No. 4, ‘Continuation or Failure.

A new daily low for GDX and corresponding new high for DUST, shifts probabilities to trade ‘continuation’.

If that happens, we’ll start looking for trendlines, if any.

Stay Tuned

Charts by StockCharts

Note:  Posts on this site are for education purposes only.  They provide one firm’s insight on the markets.  Not investment advice.  See additional disclaimer here.

The Danger Point®, trade mark: No. 6,505,279

Pivot – Point: ‘Inflation’

Major Direction Change Ahead ?

Was the inflation report ‘brutal’ or not?

The gold market, the supposed ‘inflation’ safe haven, has already decided for itself.

That is, GLD ‘blips’ higher just 0.26%. Hardly a screaming bull market.

If the worst inflation in 39-years can’t drive the gold market higher, then we’re taking the contrary view.

We may have just seen the peak of whatever’s being termed inflation.

Demand on many if not all fronts (except, maybe food) looks ready to collapse. The consumer’s tapped out; about to be taxed out as well.

Taxed out of whatever is left of their property … even if it’s stolen property.

Buried in this mainstream article may actually be some truth. ‘Supply chain pressures are easing … shipping rates coming down’.

Of course, they won’t tell why it’s happening.

It’s a double whammy of the consumer being maxed-out and literally dropping out as well.

We’re calling the video in the link, The ‘Speck-Effect’.

Let’s move on and take a look at what the gold market has to say about inflation.

Gold (GLD) Daily Chart

Price action is nowhere near a bull move and remains below significant resistance.

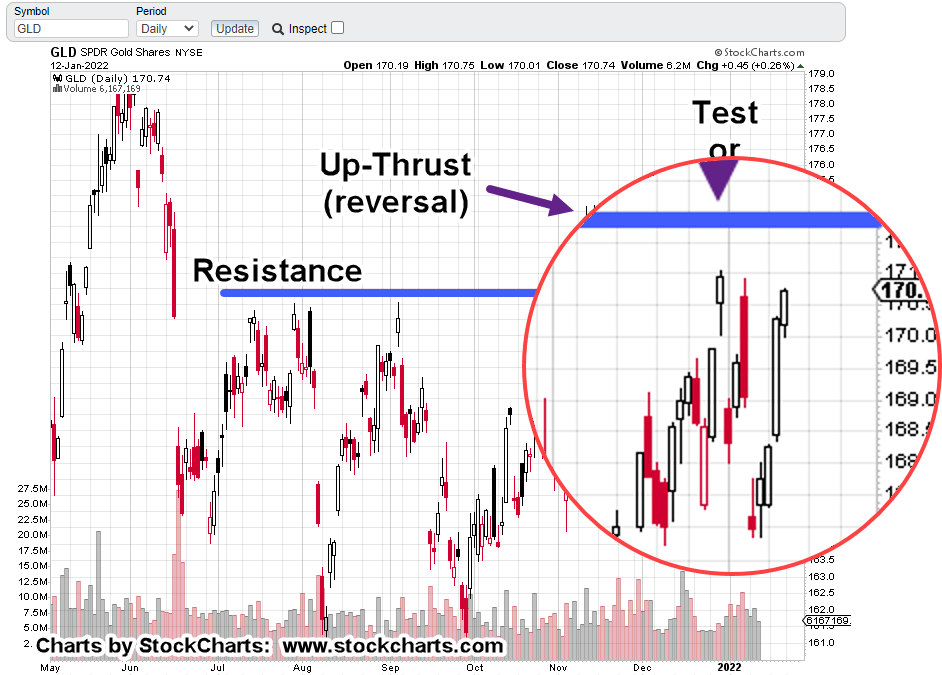
In the expanded chart below, we can see GLD literally banging about below the resistance level.

First, a test. Then a secondary test and now, what looks like a third attempt.

Note, that each subsequent test is at a lower high (thus far).

Senior Miners (GDX)

Price action in the miners, GDX is similar to GLD.

GDX remains below significant resistance.

Each upward attempt appears to be terminating at lower and lower levels.

Newmont (NEM) and DUST-21-01

Price action in Newmont (NEM) continues to look as if the entire market is thinning-out.

If there are this many price-action attempts to throw off market participants whether bulls or bears, one gets the sense the ensuing move (if/when it comes), may be literally off the charts.

Maintaining short via DUST-21-01 (not advice, not a recommendation).

Summary

We’ve just had the worse ‘inflation’ news in 39 – 40 years, depending on the source. Yet, the precious metals markets go nowhere. Therefore:

The ‘inflation narrative’ is false.

Just another lie. Probably no surprise there.

If it was true, then all commodities, gold, silver, corn, grains, oil, coffee, every last one of them, would be in a screaming bull market.

Instead, we’ve got the grains moving higher while precious metals move lower.

It can be shown that gold is now inversely correlated to corn as seen, in this post (in case you missed it).

Stay Tuned

Charts by StockCharts

Note:  Posts on this site are for education purposes only.  They provide one firm’s insight on the markets.  Not investment advice.  See additional disclaimer here.

The Danger Point®, trade mark: No. 6,505,279

Newmont: Fibonacci Count

Reversal Posting Fibonacci Sequence

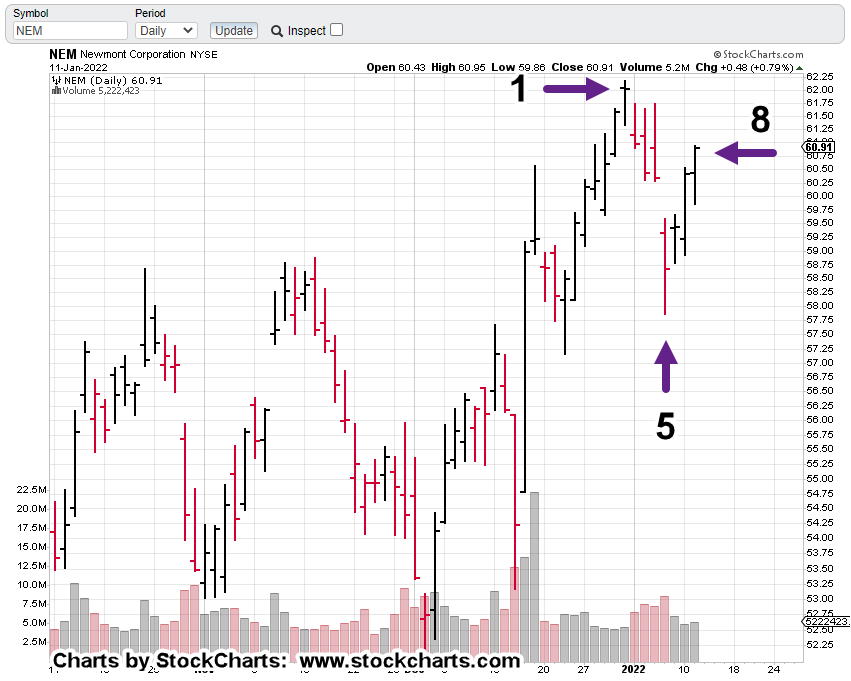
In what seems to be a surreal exercise, waiting to see what’s going to happen next, Newmont (NEM), is posting Fibonacci counts in its nascent reversal (thus far).

The usual suspects are out on YouTube … touting the next bull move in gold and the miners.

However, the market itself is saying it’s not convinced.

This is another brief update to show Newmont has apparently reversed; posting Fibonacci counts on the initial downswing and what looks to be the upward test.

Newmont (NEM) Daily Chart With Fibonacci Count(s)

It’s up to the market itself to say today was the top of the reversal test … or something else is going on and we may indeed have the gold miners in the beginning stages of a bull move.

Stay Tuned

Charts by StockCharts

Note:  Posts on this site are for education purposes only.  They provide one firm’s insight on the markets.  Not investment advice.  See additional disclaimer here.

The Danger Point®, trade mark: No. 6,505,279

Gold … $1,300/oz, Or Lower ?

From Stacking, To Panicking

It may go down as the biggest strategic ‘stacking’ blunder ever:

The consumer’s maxed-out, food supply chain’s being systematically destroyed and now, gold’s set to down-draft nearly 20% … just for starters.

For those still thinking it’s all about inflation, how about this personal anecdote (skip to Analysis, Gold (GLD), if not interested).

Anecdote:

A recent trip to the local Ford dealer to obtain an engine part, specifically, a “Camshaft Synchronizer”, i.e., what used to be called a ‘distributor’, a very common part, resulted in this conversation.

Ford: ‘Ok, part number F8DZ-12A362-AA.

Don’t have it. It’s on back-order. We’ve got an order for 347 units, with no ETA‘.

This part’s used on V-6 production engines going back decades. It happens to be a weak point in the design. When it goes out, the engine quits.

With literally millions of these engines on the road, how can there be no repair parts available?

None of the retail dealers in town had one either; not AutoZone, not O’Reilly’s, nobody.

Another Ford dealer located 50-miles away, had one unit and so the order was able to be filled.

If your car/truck is dead-in-the-water, how much would you be willing to pay to get it back on the road?

Imagine if there’s some gearhead Bubba out there who’s stockpiled a thousand of these things … how much could he charge for them?

Now, that’s what I call ‘Stacking’. 🙂

Controlled demolition of the supply chain: Not inflation.

Which brings us back to gold (GLD).

Analysis, Gold (GLD)

Weekly chart of GLD below and then inverted.

Inverted with projection.

Old Time Projection Method: The P&F Chart

Since it was Wyckoff analysis that helped us plan and spot the gold reversal, we’ll use a method equally as old to project where GLD could go (not advice, not a recommendation).

The P&F Chart.

Using the two methods above, we’ve got a combined projection in the range from GLD: 119 – 140; a decline in the vicinity of: -16.50%, to -28.96%

Is anyone even remotely prepared for this?

Important Caveat

There’s been no wedge breakout … yet. So, the projection’s a little ahead of itself.

What we do have, is a miner’s market that doesn’t look like it’s waiting around for gold.

For the miners, other factors could be coming into play; not the least of which is massive corporate stupidity.

Remember this post?

If your management’s focused on solving problems that aren’t even real … how can they ever hope to run a complicated and dangerous mining business?

Gold Steady, Miners Down

Yet another scenario, is that gold could remain steady or even rise and yet the miner’s collapse.

How can that be?

Let’s remember where a good chunk of gold is being produced: Australia and Canada.

We’re not going to get into what’s going on in these two countries except to say, they’re not exactly outfitting themselves for continued sucess: quite the opposite.

How long will it be before we hear about mines being shut down as a result of staffing shortages.

Stay Tuned

Charts by StockCharts

Note:  Posts on this site are for education purposes only.  They provide one firm’s insight on the markets.  Not investment advice.  See additional disclaimer here.

The Danger Point®, trade mark: No. 6,505,279

Trade Anatomy

Leg Bone Connected To The Knee Bone …

If you can’t draw your trade system on one side of a paper napkin, it’s too complicated.

Just to be clear, ‘simple’, does not mean ‘easy’.

What’s presented on this site and essentially in real time, is a particular method of approaching and trading the market (not advice, not a recommendation) using a culmination of research and education (i.e. losses) that span the course of over thirty years …’thirty-five’, to be exact. 🙂

That culmination has resulted in the following ‘system’.

Being from the engineering field, it’s probably no accident that system takes the form of a ‘checklist’.

However, make no mistake. The checklist is about as far as engineering can go. The rest (reading price action) is mostly art and intuition.

The System:

  1. The Set-Up 
  2. The ‘test’ or ‘gut-check’
  3. The first ‘correction’
  4. Continuation or Failure
    1. Trend identification
    2. Potential channel(s)
  5. Exit process
    1. Scale out
    2. Full exit
  6. Post trade evaluation

Let’s take a look at how that system’s applied to the current (open) trade: DUST-21-01.

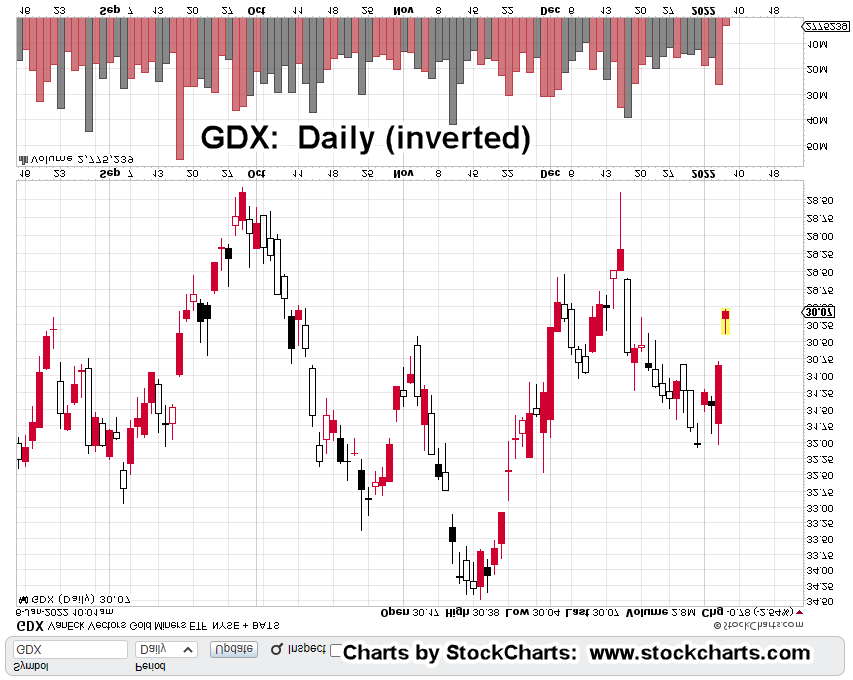
Since we’re short the Senior Miners GDX (not advice, not a recommendation), we’re going to use the daily chart but invert it (to approximate DUST) as shown below:

Marking up the chart with the above ‘checklist’ reveals the following:

As this post is being created, GDX is collapsing through support levels while DUST screams higher.

In the past two days, unless price action was monitored minute by minute, there was no time to get aboard comfortably (i.e., with low risk).

This plays directly into “Turkey’s” admonition a century ago about ‘not losing your position’.

The First Correction: Complete

With that under our belts, it’s time to get to work identifying trendlines, channels or potential traps for either the bulls or bears.

As a starting point, the daily chart of GDX is compressed and marked up with past trendlines and a potential line (magenta).

Looking closer

This series of trendlines is rising (using inverse fund DUST) at approximately +725%, annualized.

We can also see from the zoom area; price action can go sideways for some time before contacting the trend to either verify or negate.

Using DUST as the proxy, that sideways action can be as long as fifteen trading days. Just long enough to discourage the late comers; bulls and bears alike.

Stay Tuned

Charts by StockCharts

Note:  Posts on this site are for education purposes only.  They provide one firm’s insight on the markets.  Not investment advice.  See additional disclaimer here.

The Danger Point®, trade mark: No. 6,505,279

Dominoes … Begin To Fall

Juggernaut Set In Motion


This just out from Activist Post, shows we’re in yet another ‘never before seen’ event.

One of the references in the article can be found at this link.

Many times on this site, the ‘reduction in size’ has been discussed.

Now, the official numbers are starting to show-up. The bottom line? Retail demand is going to evaporate.

As a side note, it’s interesting that YouTube now has videos on how to spot Myocarditis …. something we’ve (in the serfdom) have never heard of … until now.

While everyone seems to be focused on the overall markets, S&P, Dow, and QQQ, underneath the radar, gold and the miners continue to rachet themselves lower.

Senior Miners, GDX & Inverse DUST

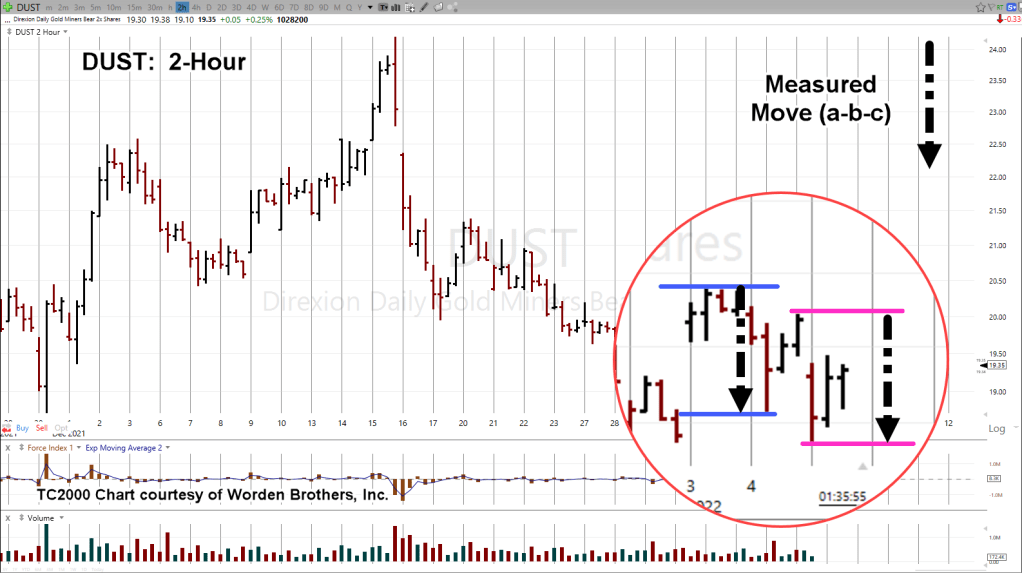
The 2-Hour chart of inverse fund DUST shows we’re still at the danger point discussed yesterday.

The zoom chart (below) has an interesting distinction.

The distance between the blue-line trading range and the magenta-line trading range, is the same. The black-dashed arrow is equal length.

This implies that yesterday’s move, along with today’s may be an ‘a-b-c’ correction. A counter-trend move.

If so, the main direction has changed from down to up (for DUST).

Summary:

Still at the danger point, we remain short this sector (not advice, not a recommendation).

The good part, if price action reverses in DUST and begins to pressure the most recent lows, it’s an indication something else is afoot and the trade is failing.

Stay Tuned

Charts by StockCharts

Note:  Posts on this site are for education purposes only.  They provide one firm’s insight on the markets.  Not investment advice.  See additional disclaimer here.

The Danger Point®, trade mark: No. 6,505,279
Gold’s ‘Last Chance Saloon’

If This Move Fails, It’s Over

Gold bulls are doing everything they can to re-establish the up-trend.

This morning’s action was a deep upward test of miners GDX, and not as deep for gold itself (GLD).

The bulls were able to open higher in both GLD and GDX; then driving action upward into an early morning test.

At this juncture (mid-session) that test is wavering.

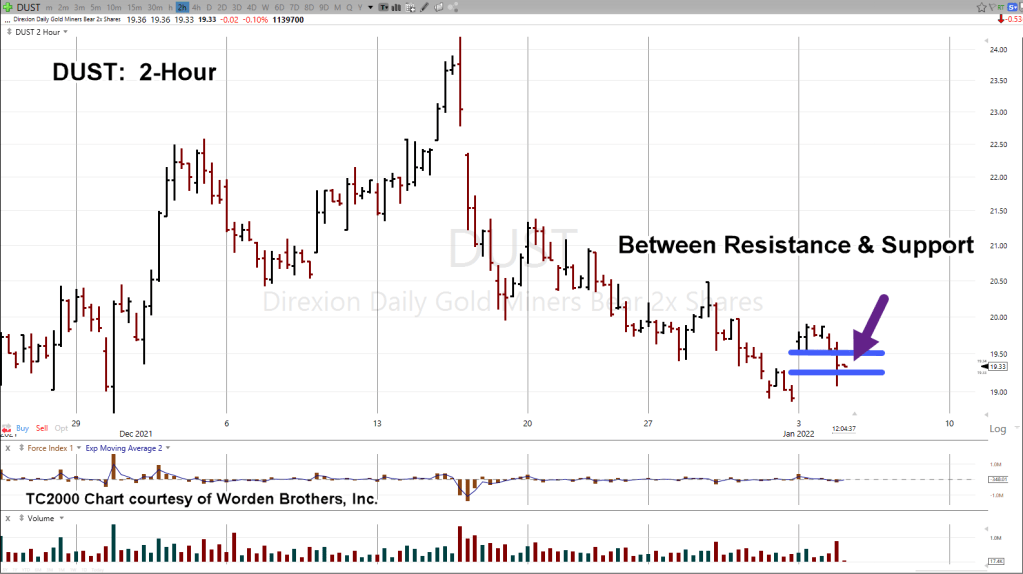
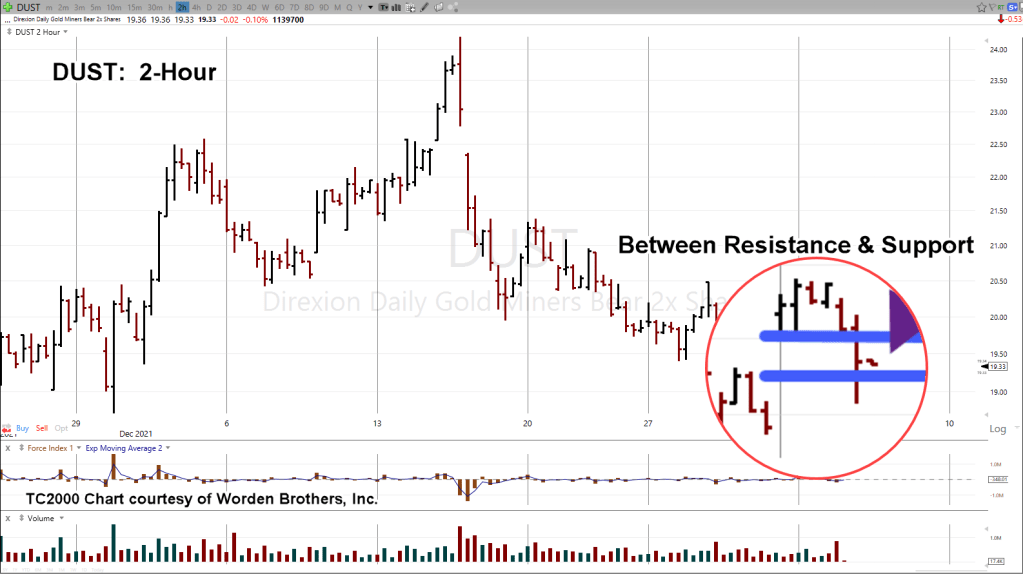
We’re going to inverse fund DUST, on the 2-Hour basis to show the fight that’s taking place.

GDX Leveraged Inverse DUST:

Un-marked 2-Hour chart

Adding the notes.

With Zoom.

As this update is being posted, it’s still unknown which direction DUST is headed; currently trading at DUST 19.35.

Summary:

We’re at the danger point where action can go either way.

If the gold bulls can’t hold and DUST makes a new daily high (GDX, new low), we have a decent confirmation, we’re at the end of ‘the first correction.’

Stay Tuned

Charts by StockCharts

Note:  Posts on this site are for education purposes only.  They provide one firm’s insight on the markets.  Not investment advice.  See additional disclaimer here.

The Danger Point®, trade mark: No. 6,505,279