Herd Behavior … After The Top

Correction, Or Collapse

Structural Damage, SOXX
Even though technical conditions show we’re at least in a correction, if not outright reversal or collapse, record inflows for 2022, vs. 2021, present the herd-driven behavior of the public (and funds), to go long.

According to the link above, flows have been out of bonds and lesser performing equities, into equities that have gone down less.

In addition, you can see some of that flow (not addressed in the article) going into gold and the mining sector.

Stepping Back

Pulling away from charts and indicators for a moment, figuratively closing one’s eyes to get a ‘feel’ for what’s happening, it looks like the following:

We’re in a (potential) massive juggernaut reversal that’s been decades in the making; possibly having origins going all the way back to the ’87, crash, the ’95, bull market and then, repeated bubbles of 2000, ’07, and now.

At this point, it looks like the ‘average investor’ is doing the only thing they know how to do … that is, go long.

Those with at least some market knowledge, just got decisively whacked with their ‘put buying‘ strategy as the market has rallied strongly off the lows.

Pavlovian Panic

We’re witnessing the knee-jerk reactions of a public that’s been conditioned for decades, not to ‘think’, but only ‘do’.

Expect this type of behavior to go parabolic if the markets really do turn lower on a sustained, long-term basis.

Prechter has written extensively about crowds or the herd; especially in his text The Wave Principle of Human Social Behavior.

We can see this visceral behavior real-time, in other seemingly unrelated markets. Two examples below:

First, we had oil futures going negative for the first time in history; then we have LNG tanker rates going negative first time as well.

The model seems to be:

“Everybody wants it, and then, they don’t”.

The crowd runs to and fro, effectively leaderless.

With that said, one can make a case we’re just beginning, or already in an economic collapse; now being followed by the early stages of a market collapse.

Meanwhile, The Elephant Gets Bigger

Let’s not forget the massive elephant that’s just now getting so large, it can’t be ignored (time stamp 2:40).

Recall the example at this link … disparate crowds have a tendency to come to the same decision and modify behavior, all-at-once.

You have to wonder, when that crowd is going to simultaneously press the Sell, button.

Hit, In The SOXX

Unprecedented events are everywhere. That includes the massive, ‘never before seen‘, thrust lower in the SOXX.

The uptrend shown in the weekly chart of SOXX, has been decisively broken and with enormous volume.

The week ending Friday January 28th, saw 16.7-million shares traded … the most ever for the index (ETF).

More detail on trend break

Then, There’s Elliott Wave

Before the ‘Elliotticians’ get miffed by the previous (cookie cutter) comments, here’s this:

When this method works … it’s great.

It provides good projection areas and the useful ‘Fourth Wave of Lesser Degree’, targeting.

Note: A quick internet search for this Fourth Wave method (authored by Prechter) turns up nothing.

Logging onto ‘Club EWI‘, putting in ‘Fourth Wave’ has no items found.

One can try contacting Elliott Wave International, to request a copy of this targeting method. It may still be available (for a price).

The data used by this author to target the 4th wave retrace (shown below), is from a hard copy, dated, 1/8/2003. That information was excerpted from The Elliott Wave Theorist, July 9th, 2002.

First, the 2-Hour chart from Thursday’s update is repeated below with the ‘lesser degree’, added in magenta font:

Getting closer-in on the 4th-wave area below:

It’s subtle and difficult to spot. The price action congestion area is the ‘4th wave of lesser degree’.

Summary:

The previous update showed entry points for what is now SOXS-22-01 (not advice, not a recommendation).

Friday’s price action put this position well in the green; getting it to +24%, based on the close.

The table below are the ETFs being tracked along with the leveraged inverse fund tickers.

The percentage gain/loss, is for this past Friday’s action and shown for the inverse funds.
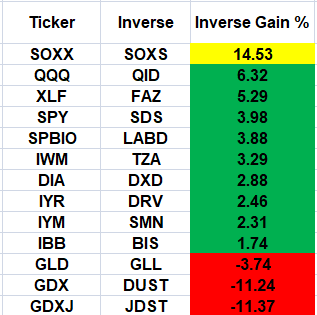
Obviously, the semiconductors were hit the hardest on Friday and so, SOXS, had the largest gain.

A good stop level for SOXS would naturally be Friday’s low (not advice not a recommendation). If we really are in an Elliott Wave 3, down … price action’s expected to continue its decline with haste.

Stay Tuned

Charts by StockCharts

Note:  Posts on this site are for education purposes only.  They provide one firm’s insight on the markets.  Not investment advice.  See additional disclaimer here.

The Danger Point®, trade mark: No. 6,505,279
Gold, Before The Open

Gold Miners GDXJ, To Close The Gap ?

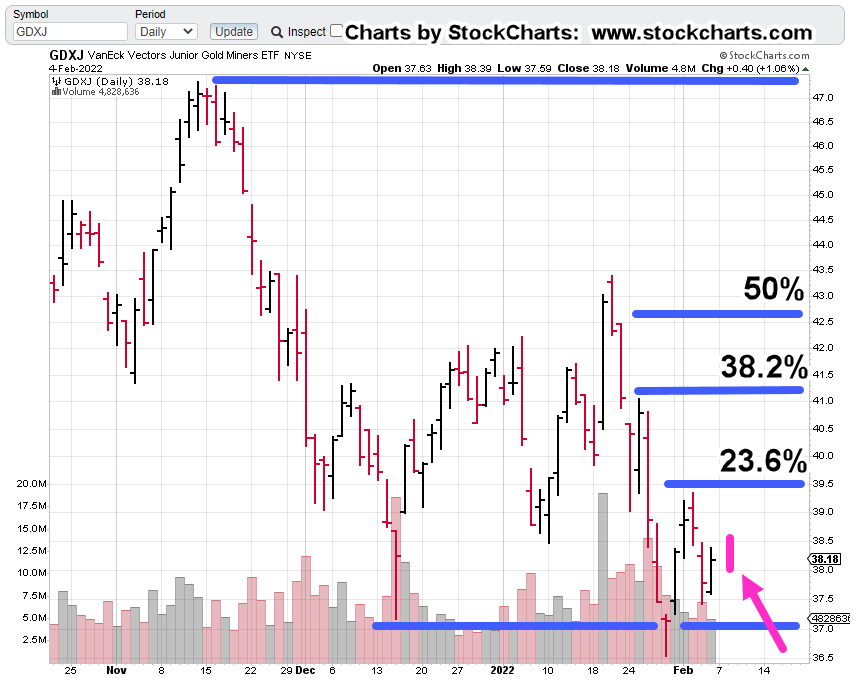
The magenta arrow and bar show pre-market action in Junior Miners GDXJ, about 25-minutes before the open.

Fibonacci retrace levels as noted.

The zoom chart shows a gap that action may be trying to fill and then? Is there something more?

Sated earlier, a 23.6%, retrace is rare and 38.2%, more common.

Summary:

The market looks to open higher.

If so, typical behavior is to come down for a test and then continue upward if that’s the overriding direction.

If the expected test fails, action may continue lower.

Once again, we’re at the danger point. The action itself defines the trading response.

Friday saw a partial exit of the short JDST-22-01, position in anticipation of higher prices (not advice not a recommendation)

Today may see the rest of the exit if the pivot higher is confirmed (typically within the first hour).

The fact pre-market trading is subdued with just (so far) a half-point or about 1.0% gain, still suggests weakness.

We can see price action penetrated support (bottom blue line) on the chart and so GDXJ, is in ‘spring position’. However, thus far that spring appears to be weak.

There’s a lot going on at this juncture.

JDST-22-01, Position Table to be updated and posted later.

Stay Tuned

Charts by StockCharts

Note:  Posts on this site are for education purposes only.  They provide one firm’s insight on the markets.  Not investment advice.  See additional disclaimer here.

The Danger Point®, trade mark: No. 6,505,279

‘Four Generations’

The Average Life Of A Fiat Currency

What if the ‘imminent collapse’ of the dollar is overblown by about 50 – years?

According to this just out, on private gold-filled currency, the article states average life of a fiat currency, is four generations. It goes on to say there are exceptions like the British Pound, continuing on even after hundreds of years.

The Black Swan

In Taleb’s book ‘The Black Swan’, he says it’s an event that nobody expects. It has long lasting repercussions and permanent change.

However, what most if not nearly everybody ignores or leaves out, is his alternate definition. That is:

A Black Swan can also be a future event that’s widely accepted as fact, that does not happen !!!

Is that where we are with the U.S. Dollar?

Even though the dollar has not collapsed and in fact, has rallied as we’ll see below, the ‘collapse’ talk continues unabated.

It’s easy to talk about dollar collapse.

It’s what gets the clicks. No matter that an actual collapse may be years if not decades away.

As of this post, how many ‘monopoly money’ YouTube videos can be found? Seems like it’s the same number or more than, ‘gold to skyrocket higher’.

Well, so far, gold has not skyrocketed higher.

On top of that, this site’s even provided an exclusive correlation that gold’s moving inversely to corn.

See ‘Insight Note at the end of this post.

Ever since the ‘Derecho‘, it’s never been the same.

Back to the dollar.

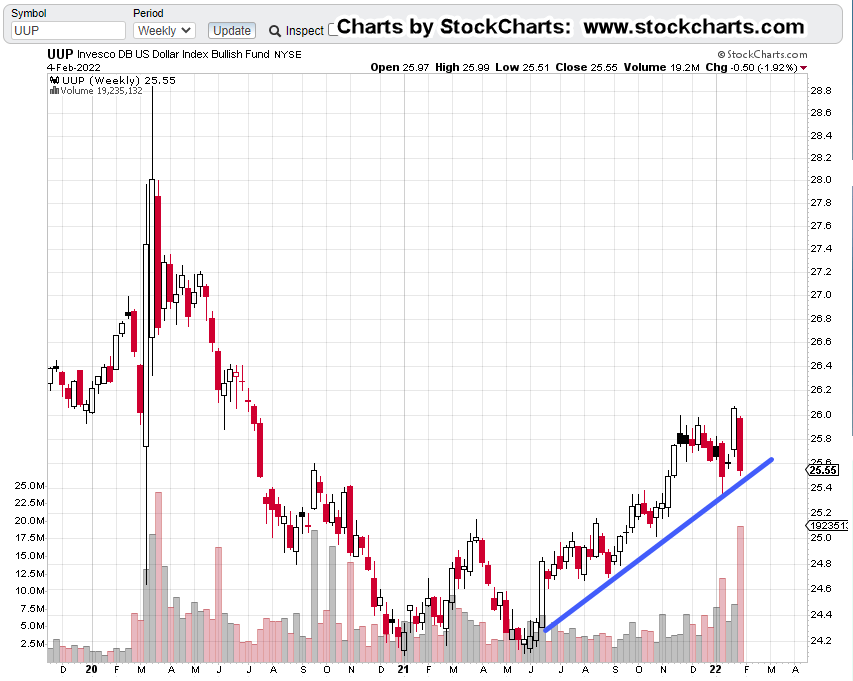
No doubt, the dollar was whacked over the past trading week. Let’s take a look at what the UUP, price action is saying about itself.

Dollar, UUP, Weekly Chart

The unmarked chart shows the dollar oscillating, testing support for six-months at the beginning of 2021.

Then, in mid-June ’21, UUP pivoted decisively higher (gold, GLD, pushed lower) and never came back to those levels.

Of course, this past week The Usual Suspects were out talking about the dollar and ‘monopoly money’.

Since the ‘gold skyrocketing higher’ forecast failed spectacularly, along with it being the investor’s fault, we then had the ‘clueless‘ and now, it’s ‘monopoly money’.

The chart below shows last week’s bloodbath has served to bring UUP, down to an established trend-line.

It’s important to note, with all that (down) volume, the most since early 2020, UUP was not able (thus far) to break through the trend (blue line).

That leaves the dollar at or near, the danger point.

Continued, sustained selling, risks breaking the uptrend.

If the opposite takes place and UUP starts to rally, last week may have been an inflection point (to the upside).

Gold (GLD) and the dollar appear to still be inversely correlated.

Summary:

Ever since removal of the link to gold in 1971, the dollar has the potential to collapse at any moment.

However, in this case, we at least have some historical precedent that on average, fiat currencies tend to last four generations before becoming worthless.

Wyckoff sates in his writings over and again, ‘somebody always knows something’.

If there’s a collapse afoot, he tells us to look at what the market is saying about itself (not advice, not a recommendation).

Stay Tuned

Charts by StockCharts

Note:  Posts on this site are for education purposes only.  They provide one firm’s insight on the markets.  Not investment advice.  See additional disclaimer here.

The Danger Point®, trade mark: No. 6,505,279
Insight Note:

It’s been a strange coincidence over the past year or so, ideas presented on this site make their way to certain YouTube sites either in the titles, or within their content.

The timing of this phenomenon, that within a day or two, ‘post it first here, see it on YouTube there’, has occurred more times than one would consider as just ‘coincidence’.

Admittedly, the insights (making their way to certain YouTubers) have not been exclusive … that is, until now.

Recognition of the Gold/Corn inverse correlation, first posted here, is unique to this site.

As far as is known, this correlation has not been presented on any other financial site or YouTube channel or any other medium.

It may be an important data-point and map into this site’s long-time premise; it’s the corn and the grain first, then gold and silver (not advice, not a recommendation).

For more detail, search for Genesis 41.

When ideas from others are incorporated into the analysis presented on this site, full acknowledgement of the source is cited.

As Dr. Elder said in his book ‘Come Into My Trading Room’:

“I have zero respect for thieves”

He’s talking about the theft of his book title: “Trading For A Living”. He goes on to say, (paraphrasing)

‘Do you really want to use market analysis or input from someone that can’t think for themselves?’

Authorization:

Therefore, this footnote is authorizing the further use of the Gold/Corn inverse correlation by others in the industry if they so choose with the following caveat:

If one of the sites monitored (or some other media) uses this exclusive insight, and does so without referencing the source, it puts this author in the unenviable (but not unfamiliar) position of calling out the thief by name … not unlike what Stew Peters is doing (to the hoax/genocide perpetrators) on his broadcasts.

This market environment’s providing a fantastic public service:

It’s separating out the hucksters, the shysters and the otherwise incompetent from those who are, or who are striving to provide a service or useful insight.

The general investing public may find out soon enough, they’re on their own. Maybe unbeknownst to them, they’ve always been on their own.

End

‘Unbelievable’ Numbers

Good News Is Bad News. Bad News Is Good News

For all of us serfs in the banana republic proletariat, it’s near if not impossible, to keep up with the lies.

The latest ‘employment‘ report is just one example.

This video from Jerimiah Babe, posted a few days ago has a different story. Check out the intro and then farther on at time stamp: 9:00.

For a second opinion, we can go to Dan, at i-Allegedly.

On his latest post, fast-forward to time stamp 7:00, where he walks through an outdoor restaurant area that’s completely vacant.

The ’employment’ report is vapor. Judging from the comments (at ZeroHedge) most everyone seems to be aware of the fakery.

Naturally, with all of this uncertainty and rampant inflation, the logical place to go would be the gold market.

Junior Miners, GDXJ

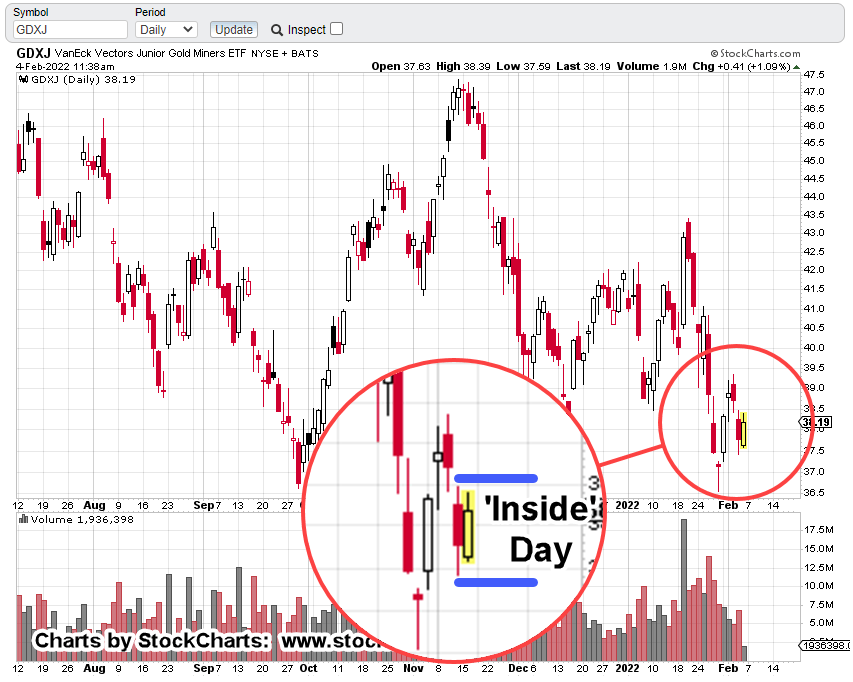
As this post is being created (mid-session), the Junior Miners are at the danger point. Price action’s at a location where it’s decision time.

So far, it’s an ‘inside day’. We don’t have a new daily high or low from the previous session.

The Fib retrace of 23.6%, discussed previously is holding for now. That weights action to the downside.

Posting a new daily high would begin to erode the set-up; potentially indicating GDXJ, is going to attempt a retrace to the Fib 38%, level.

If that higher retrace becomes a more favorable probability, the JDST-22-01, trade will likely be closed out (not advice not a recommendation).

The chart below shows the inside action thus far.

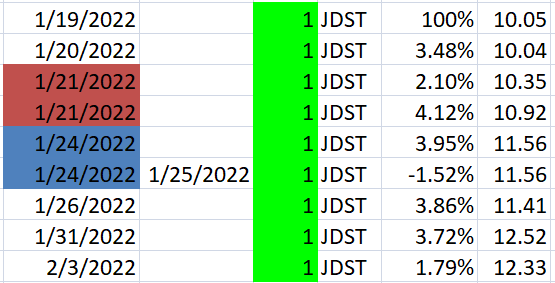
The table below has the current positioning JDST-22-01, via inverse fund JDST (not advice, not a recommendation).

As always, the sell finger is on the trigger. Description of color coding and table layout is in this post.

Summary:

Trade decisions posted on this site are defined by the price action itself (not advice, not a recommendation). Wyckoff analysis does not concern itself with what’s obviously fake.

Wyckoff focuses strictly on what the market is saying about itself.

At this juncture, price action’s saying that both bulls and bears, are at the danger point.

Stay Tuned

Charts by StockCharts

Note:  Posts on this site are for education purposes only.  They provide one firm’s insight on the markets.  Not investment advice.  See additional disclaimer here.

The Danger Point®, trade mark: No. 6,505,279

Junior Miners, Stall-Out

First To Reverse

For the evening/overnight session, both gold and the S&P futures have opened lower.

The S&P is down 50-pts, nearly 1.10% (at about 8:15 p.m. Eastern) and already penetrating the last session’s low.

The number of technical factors concerning gold, the miners and especially the Junior Miners GDXJ, is significant.

We’ll cover just a few in this update.

Junior Miners, GDXJ: Daily

The un-marked daily chart shows GDXJ oscillating but in a general downward trend:

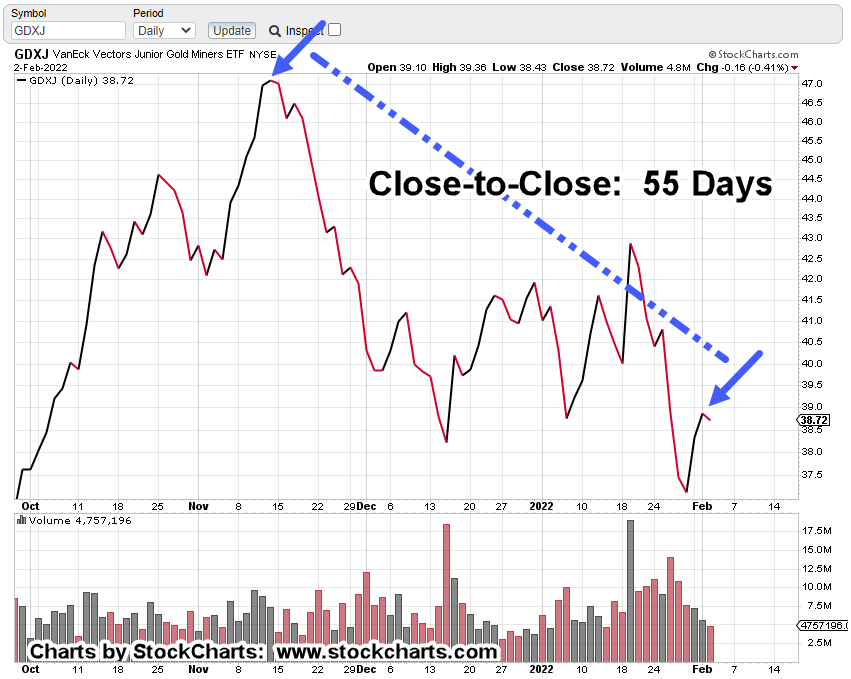
The next chart shows price action posted a reversal bar right at Fibonacci 23.6%, for the entire move; from the breakout highs in mid-November ’21, to the lows on January 28th, this year.

A ‘Fib’ retrace of 23.6%, is rare and if it holds, indicates significant weakness.

The next two charts present a case for why this shallow retrace may indeed hold and thus, indicate the start of the next leg lower.

On a print basis, it’s been a Fibonacci 55 (+1) days from the GDXJ print high on November 12th, 2021, to the high posted today (2/2/22).

The next chart shows that November 12th, 2021 was also the closing high of the breakout set-up.

The Important Part:

Yesterday, was the closing high of GDXJ (so far) and that makes it a perfect Fibonacci 55-Days, from peak-to-peak.

The last update on the miners showed significant down-pressure at support levels, unlike previous visits to the area.

Looks like we’ve had the rally that was forecast; that rally may now be fading.

“It’s reasonable to expect an attempt to rally in the coming week … but with this much down force, a successful rally is not the high-probability outcome.”

Gold Could Hold

Already discussed, is the idea, the actual price of gold may hold steady or even go higher and yet the mining sector collapses.

As Dan from i-Allegedly posts in this report, Italian wine makers are having a hard time getting corks for their bottles. That’s right, corks !!!

Does anyone really think a massive mining outfit is going to be able to source all they need to continue operations without interruption?

Let’s not even get started with the ‘sustainability’ corporate failure already baked into the cake 🙂

‘Stackers’ … We’ve Got You Covered

That’s right, if the last report was not enough, we now have this: Fertilizer plant on fire … imagine that.

Right in time for spring planting.

But wait, there’s more; look at the fire chief’s comments. How many “33s” can you count?

For we wrestle not

“For we wrestle not against flesh and blood, but against principalities, against powers, against the rulers of the darkness of this world, against spiritual wickedness in high places.”

Sorry for those who think it’s all a ‘myth‘. I’m with Good Patriot on this one (time stamp 17:09); that we’re in a battle surpassing all that’s come, since 33 AD.

Gold & Silver

Hard assets: Good to have for sure (ammunition, seeds and egg-laying hens may be better) … but if we’re really in a similar event to Genesis 41, that means the corn and grain come first, then gold and silver.

Summary:

This post started with the S&P down about -0.80% and it’s now down -1.10%, posting a new daily low.

Gold is down slightly, holding steady but that’s already been discussed above.

Remaining short the sector via JDST-22-01 (not advice not a recommendation).

Position size on JDST-22-01, has been increased. More on that in the next report.

Stay Tuned

Charts by StockCharts

Note:  Posts on this site are for education purposes only.  They provide one firm’s insight on the markets.  Not investment advice.  See additional disclaimer here.

The Danger Point®, trade mark: No. 6,505,279
Junior Miners, Trading Clues

Clues For Entry, Clues For Exit

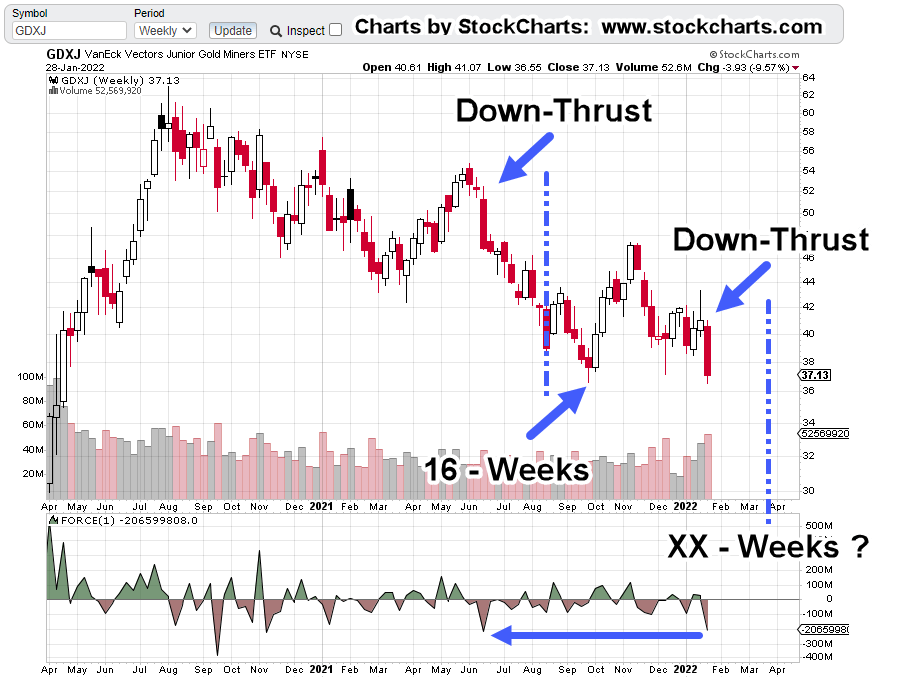
The last time weekly down-thrust energy (Force-Index) was this deep, GDXJ price action ratcheted lower for 16-weeks before a significant reversal.

That reversal took place at support where GDXJ, is now. However, back then (week of October 1st), contact with support was on weakening Force-Index; this time, it’s increasing.

It’s reasonable to expect an attempt to rally in the coming week … but with this much down force, a successful rally is not the high-probability outcome.

Summary:

One possible clue for exit of short position, JDST-22-01, is to look for continued downside action but with divergent (lessening) thrust energy; not advice, not a recommendation.

Stay Tuned

Charts by StockCharts

Note:  Posts on this site are for education purposes only.  They provide one firm’s insight on the markets.  Not investment advice.  See additional disclaimer here.

The Danger Point®, trade mark: No. 6,505,279

It’s The Poo … Turning Into Gold

Wait, What ? … We Really Do Need Cows ?

Unprecedented times, yields unprecedented events.

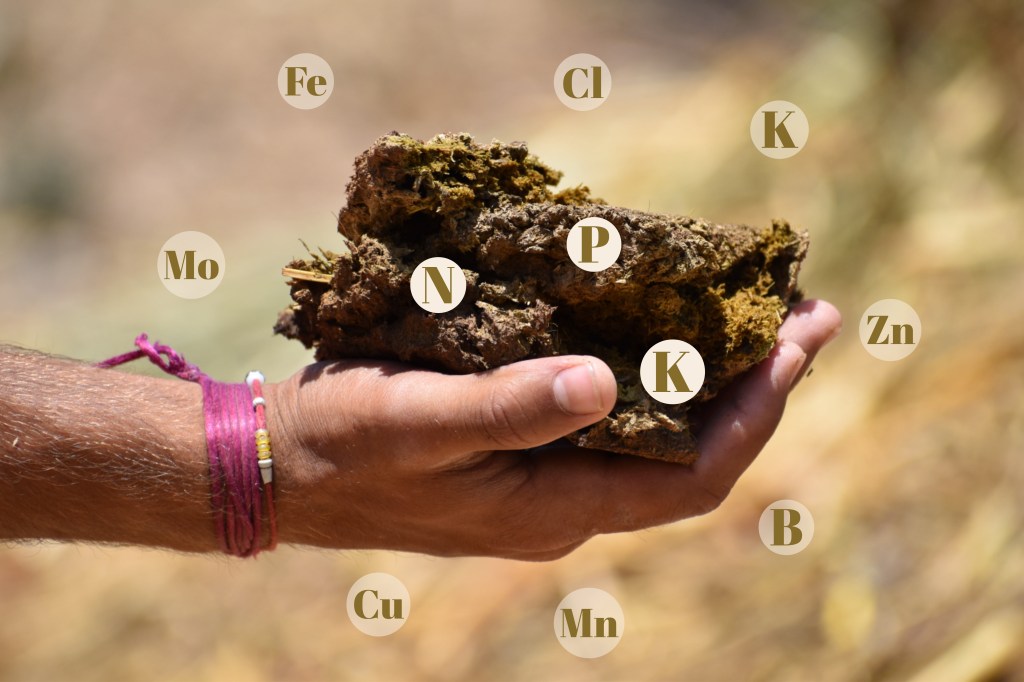
It looks like cow dung (i.e., fertilizer) is literally turning into gold.

From the October 12th, 2021, update:

“What happens when the public realizes all-at-once, it’s the food supply that’s not ever (in quantity) coming back?”

Of course, in our upside-down world, if dung is turning into gold, well then gold must be turning into, um, something akin to dung; and so, it is.

For those who have been monitoring this site and others like ice age farmer, this news is nothing new.

The assessment that gold (GLD) was in a reversal (up-thrust) test, published hours before the Fed announcement, appears to be correct.

From the mining sector, the Junior Miners (GDXJ) have been hit the hardest being down about – 10.7%, for the week (early session).

Junior Miners, GDXJ:

We’re going to use the weekly close chart of GDXJ, as presented in the January 24th, update; more specifically, this statement:

“If GDXJ really has pivoted more aggressively to the downside, price action will ‘get itself into the channel’ by accelerating sharply lower.”

So, let’s take a look.

GDXJ, Then:

GDXJ Now (early session):

It’s still a long way to go before the close. However, action seems to be accelerating lower into the new more aggressive down-channel.

More detail in the zoom chart below.

Positioning

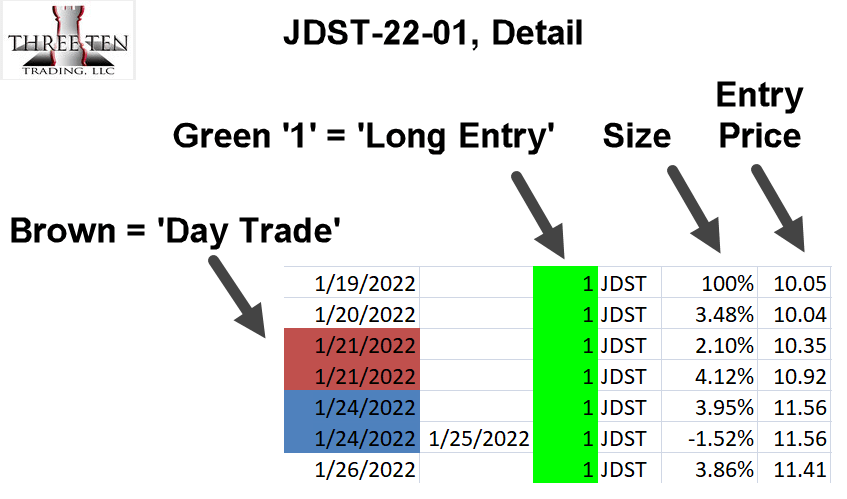
As a courtesy, although not obligated in any way, the following is from the company’s trade spreadsheet (not advice, not a recommendation).

The ‘share size’ has been changed to indicate percentage of the position.

Frist, we had DUST-21-01, closed out (details discussed here) and then JDST-22-01, opened. We’ll call that initial open as 100%.

Then, additions were made and one reduction before adding again. Those changes are shown as percentages of the original size.

Example: If the original entry on 1/19, was 10,000 shares of JDST, then on 1/20, that amount was increased by 348, shares and so on.

The table below provides the dates and entry/exit prices (not advice, not a recommendation).

Summary:

There may still be opportunity to increase position size.

However, it’s obvious at this point, the market’s in decline and volatility likely to increase all the more.

It’s literally been four months or longer, to plan this trade. As of this post, the combined position is up a nice +31%

The next order of business is to monitor action and locate potential exit targets and stop levels.

Meanwhile, the cow dung becomes ever more valuable. 🙂

Stay Tuned

Charts by StockCharts

Note:  Posts on this site are for education purposes only.  They provide one firm’s insight on the markets.  Not investment advice.  See additional disclaimer here.

The Danger Point®, trade mark: No. 6,505,279

Fighting The Last War

Because, Last Time Will Work This Time

Gold fund GLD, saw record inflows for the past year.

So, that’s the place to be, right?

In a rare (media) event, the answer may be included in the above link.

The analyst in the article is quoted as being “surprised” the actual metal, gold, has not moved appreciably higher as a result of massive ETF inflows.

Since before 1980 when gold reached an all time high (back then) of $850/oz., its’ been ‘inflation, inflation, inflation’.

That Was Then:

It’s been forty-plus years (some would argue more) of non-stop inflation.

At some point, the music stops; we seem to be very close.

Everybody stampeding into gold and related markets (i,e., the miners) appears to be fighting the last war: Inflation.

Where We Are Now:

In Steven Van Metre’s latest update, he presents just how precarious and fragile is, the current market environment.

It’s a short video, just under 13-minutes; it’s worth the time.

The internet’s been the great equalizer and so everyone has access to the same information.

After watching his video (time stamp 6:07), it raises the question as to why anyone, or any financial manager, would want to be long in the equity market (not advice, not a recommendation).

To Be, Or Not To Be, ‘Certified’

Let’s just throw in that ‘certified’ management actually underperforms non-certified peers. At least in the case of the CFA (Chartered Financial Analyst).

In the article above, it even states that ‘experience’ is a deciding factor. Imagine that. 🙂

One has to be smart to pass the certification tests. No doubt. However, ‘smart’ does not equal ‘savvy’.

Taking all of this into account, it’s reasonable to think we’re possibly just one ‘fat-finger’ away …

Gold Finished Testing ?

We’re a few hours from the Fed announcement but the market looks like it’s already made a decision.

The daily chart of gold (GLD) shows all that’s happened since the potential for up-thrust breakout was first presented.

The zoom chart shows price action right at the support/trendline of the terminating wedge.

More importantly, we see that action is below the established resistance line; possibility indicating the test is complete.

Stay Tuned

Charts by StockCharts

Note:  Posts on this site are for education purposes only.  They provide one firm’s insight on the markets.  Not investment advice.  See additional disclaimer here.

The Danger Point®, trade mark: No. 6,505,279
Gold Miners: Now, It’s Obvious

It Was Never A Bull Market

The bottom’s falling out of the equity markets and the miners are going right along with them.

For long-time users of this site, this lack of a sustainable bull market in the mining indices was identified long ago.

Fifteen months ago, we had the following post. Let’s review and give it an update:

‘What’s wrong with this picture?’

The Charts:

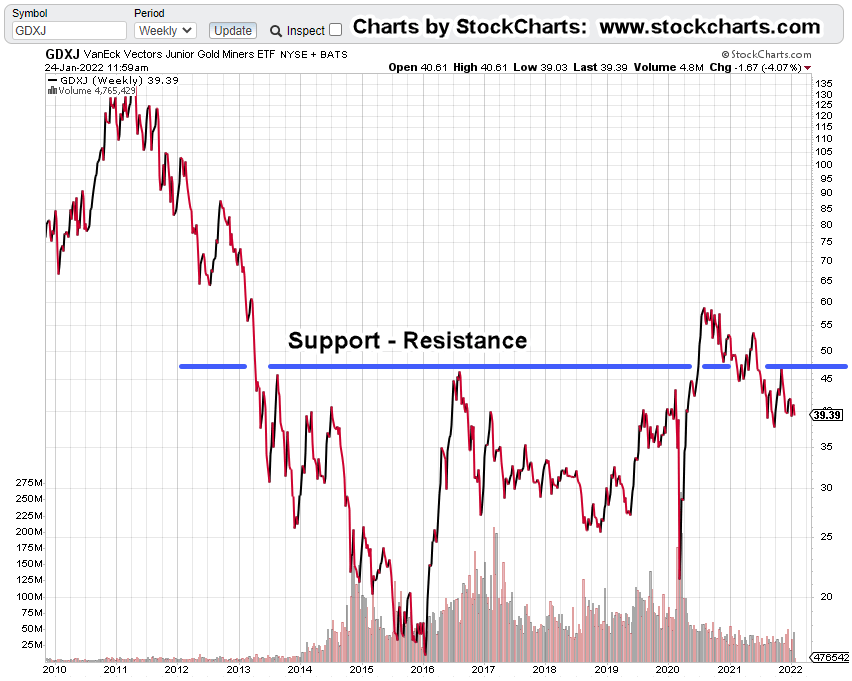
First off, we’ll re-post the weekly close chart of Junior Miners, GDXJ as it was then (October 25th, 2020):

The following quotes were also part of that report:

“One way to look at it is, the junior sector does not believe gold (and silver) prices can be sustained at current levels.”

“Or, if they are sustained, there must be something else at work that would prevent them form obtaining a substantial profit.”

Now we know, nearly a year and a half later, that “something else at work”, is what we call The Speck and the Speck-Effect.

Not only that, energy (and money) that’s being diverted to solve non-problems (covered in the last post) may be having an effect as well.

Let’s not forget supply chain problems with no end in sight.

If there ever was a case for Wyckoff analysis, this is it.

Reading price action, making calculated (intuitive) decisions will keep one away from what by now, has become useless prattle from the mainstream sources.

Remember ‘blue skies ahead’?. Seems like it was almost yesterday … oh, wait. 🙂

This garbage-in, garbage-out, is not exclusive to just the financial media.

As Dr. Vernon Colman points out in his video (linked here), it seems to be pervasive in all types of media world-wide.

Junior Miners GDXJ, At Present:

Here’s how the weekly close of the Junior Miners looks today (approximately, mid-session):

Downside Trading Channel(s)

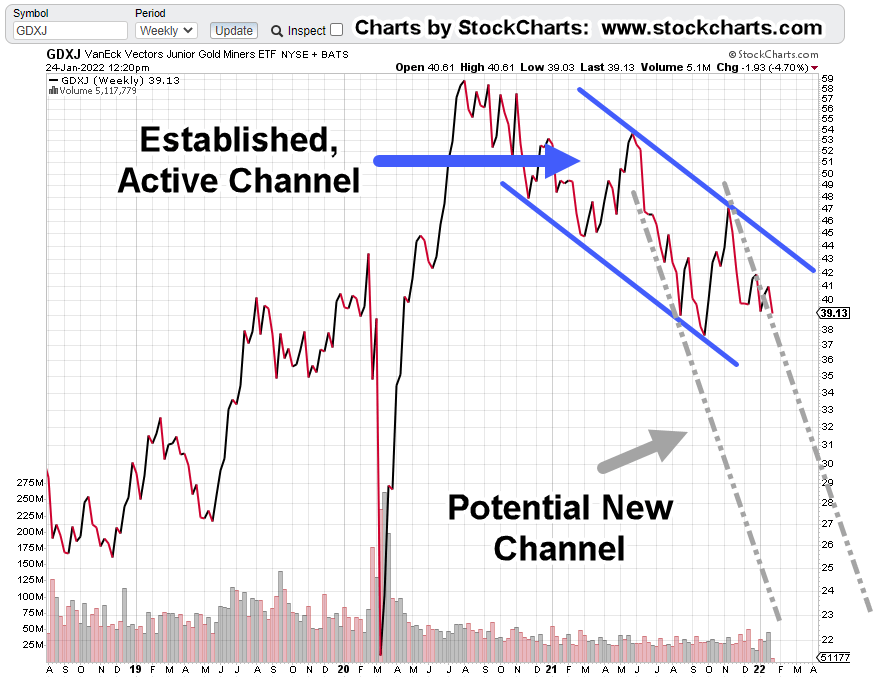
We’ll stay with the weekly GDXJ but zoom in and mark it up:

GDXJ, has been in a well-established down-channel, beginning around late November of 2020.

As shown with the grey dashed-line, there’s a possibility of a new more aggressive channel.

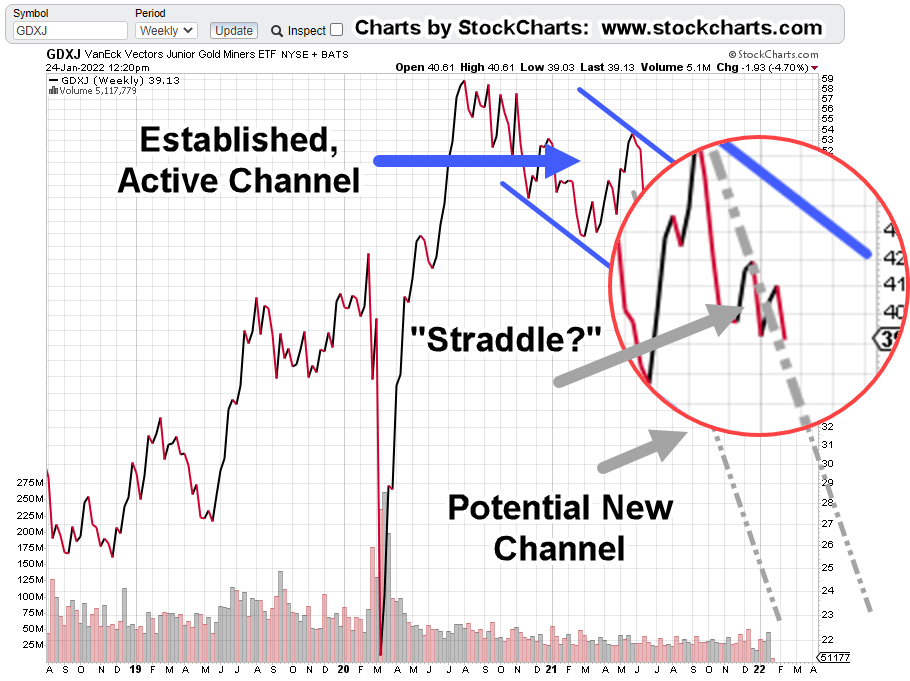
The chart below shows the potential right-side trend line is currently being ‘straddled’ by price action; this can happen when the equity or index is unsure there’s been a change.

If GDXJ really has pivoted more aggressively to the downside, price action will ‘get itself into the channel’ by accelerating sharply lower.

Where’s It Headed?

For this update, we’re going to use the P&F projections for GDXJ. Fibonacci projections (which have a similar target) may be covered in tomorrow’s update … price action depending:

Downside projection is for a drop of approximately – 35% to -50%, from current levels (not advice, not a recommendation).

Summary:

As always, anything can happen. The markets could be rescued yet one more time.

However, at this juncture we’re at least in the established down channel shown above. Price action will let us know if there’s been a decisive acceleration to the downside (grey dashed-line).

Remaining short GDXJ via JDST; labeled as JDST-22-01 (not advice, not a recommendation).

Stay Tuned

Charts by StockCharts

Note:  Posts on this site are for education purposes only.  They provide one firm’s insight on the markets.  Not investment advice.  See additional disclaimer here.

The Danger Point®, trade mark: No. 6,505,279
Straight Talk On Gold

The Air’s Going Out

It’s time for the truth on gold and the miners.

Before we get to the charts, we’re going to start with an unlikely source:

Dr. Vernon Coleman

His latest video post is here; it’s important to watch in its entirety.

At time stamp 13:30, in the link, he says that restrictions are backing off, not because of any real change of conditions; no, they’re backing off to clear room for the next scam.

Useful Idiots

For obvious lies to have any effect, one has to have a whole pack of idiots to believe them.

The last post showed with the anecdotal ‘Target’ update, of that, there is no shortage.

So how does one think a dirty, dangerous mining operation is going to be functional with an ever declining or impaired workforce coupled with a potential ‘climate lockdown’?

Let’s not forget, these operations are also working to solve problems that don’t exist (i.e. ‘sustainability’ and ‘net zero’).

Was it like this in 1929 ?

The latest post from Economic Ninja, talks about the market becoming more “narrow” … which is just an alternate term for “thinning-out”.

All of this brings us to the market at hand: Gold and the miners.

Newmont Mining (NEM):

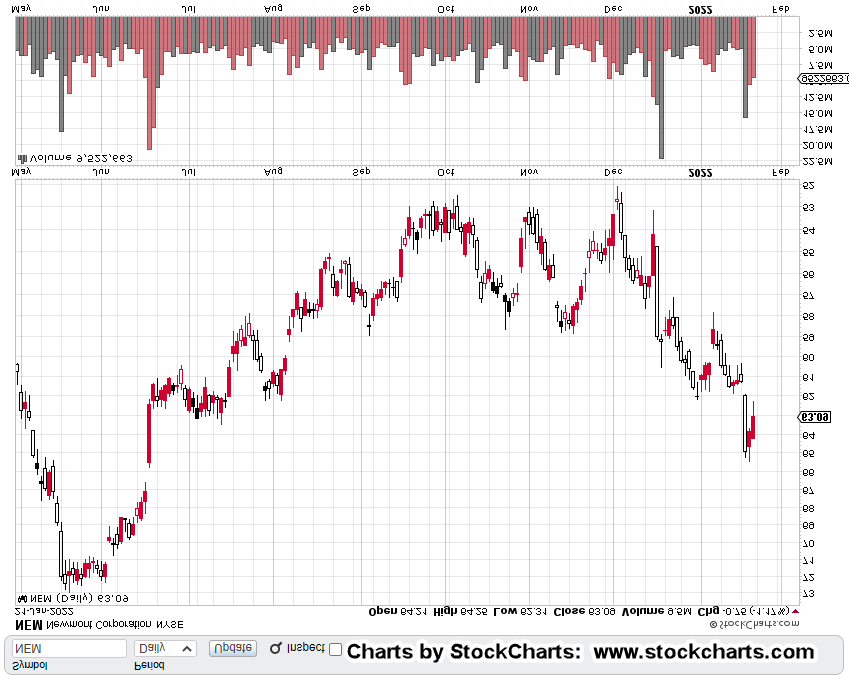
We’ll go straight to the inverted daily chart of NEM:

This prior post did an excellent job showing the potential bearish reversal conditions for NEM.

However, there’s at least one more bearish condition and that is, ‘up-thrust’.

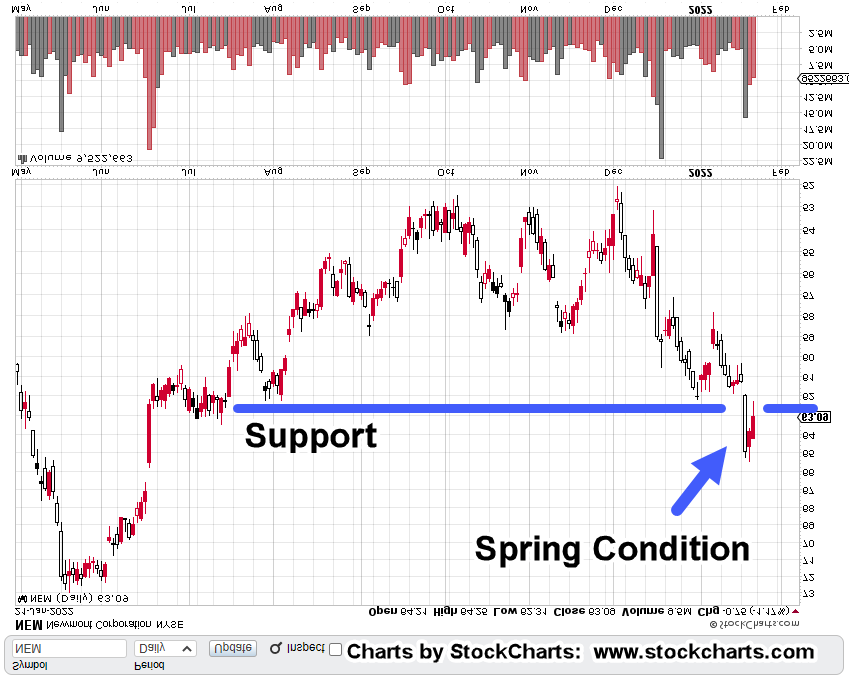
Remember, that if it’s ‘up-thrust’ on the regular chart, it becomes ‘spring’ on the inverted.

The zoom chart below shows price action has come back to test support quickly; an indication the downside thrust cleared out the weak hands and allowed strong hands to take positions.

We’re talking ‘inverted’ here.

So, what’s likely happened in the real (non-inverted) world:

The herd has bought into the inflation narrative.

They think Newmont, the miners and the gold market, are breaking out to the upside. Meanwhile, back at the ranch, the professionals have likely used the opportunity to sell or sell-short.

Back In The Day

Way back in the day, when Steven Van Metre, still had his 1970s wood-paneled office, he used to talk about how the Fed knows its actions are deflationary.

Also, how the Fed was in no way going to educate the public; so, they let that public believe that it’s all about inflation and dollar destruction.

The herd is nearly always on the wrong side of the trade. Here’s a blast from the past to help make that case.

Data Dump & Asset Transfer

With so many bits of data swirling around like Cryptos, Digital Dollar, UBI, Supply Chain Destruction, Depopulation, Neo Feudalism, and on, who of us in the proletariat, really know how it’s all going to play out?

However, there’s one thing of which, we can be sure:

It’s an asset transfer of Biblical proportion.

Next On The Schedule

This post is already long and we’ve not discussed the mining indices and downside projections.

Depending on price action or news, we’ll cover that in tomorrow’s update.

Stay Tuned

Charts by StockCharts

Note:  Posts on this site are for education purposes only.  They provide one firm’s insight on the markets.  Not investment advice.  See additional disclaimer here.

The Danger Point®, trade mark: No. 6,505,279