Supposed ‘Safe-Haven’, Goes South

With this morning’s turmoil, gold “should” be higher, right?
Before we even get started, everyone needs to know or be reminded, the word “should” is a ruse; it’s a trap.
Just like there’s no crying in baseball, there’s no “should” in the markets.
Instead, we replace that word with any of the following: Expectation, probability, empirical, set-up, and not the least of which is, ‘price action’.
Case In Point
Gold is down hard but it should be higher.
Coming from that perspective, then leaves you scratching your head, attempting to figure out ‘why’ gold has not moved higher.
With that, off we go on a never-ending rabbit trail having full encouragement of the financial press; making sure you never find the answer.
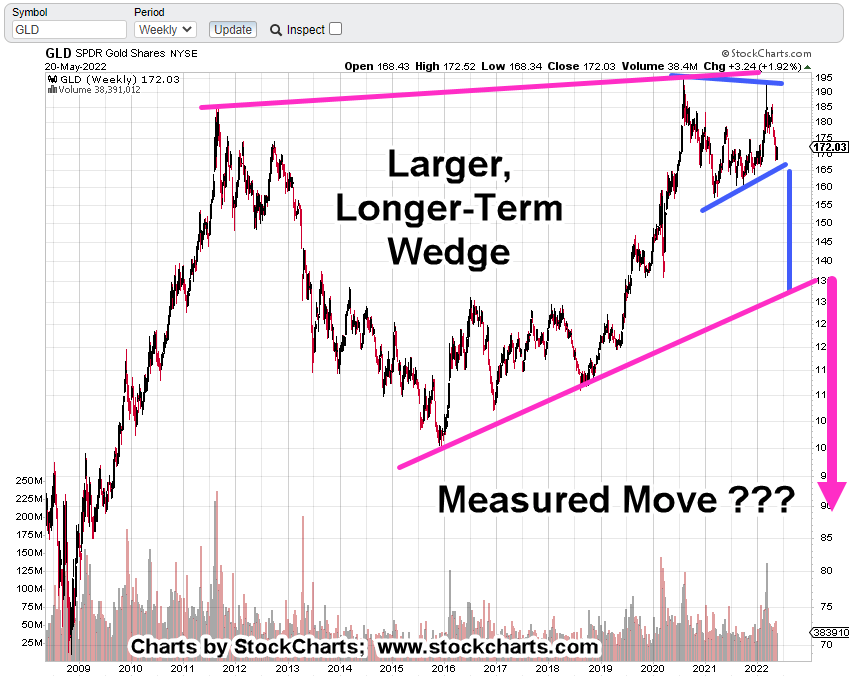
On the flip side, coming from a Wyckoff perspective, we look at gold (GLD) and ask the following:
What is the market saying about itself?
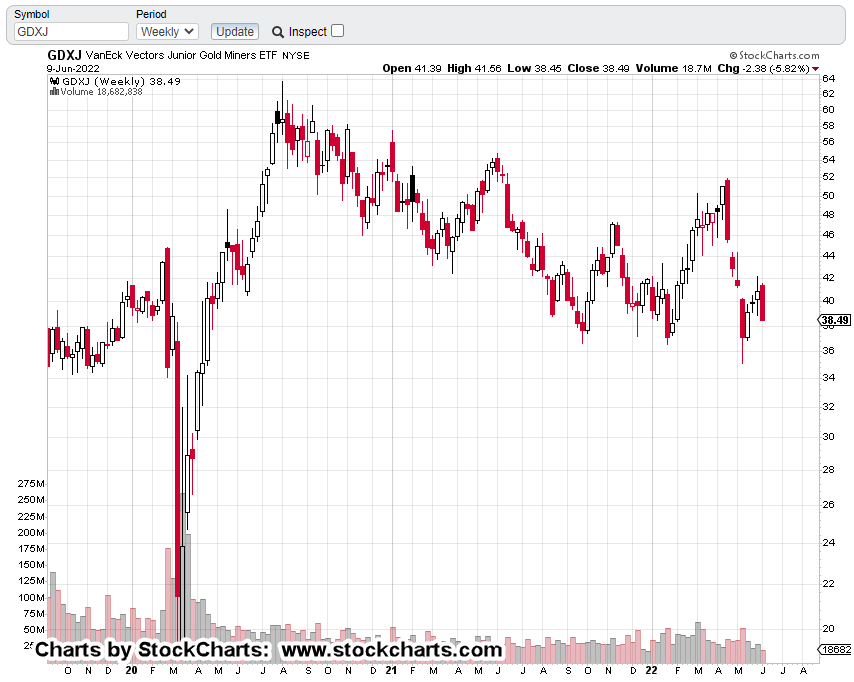
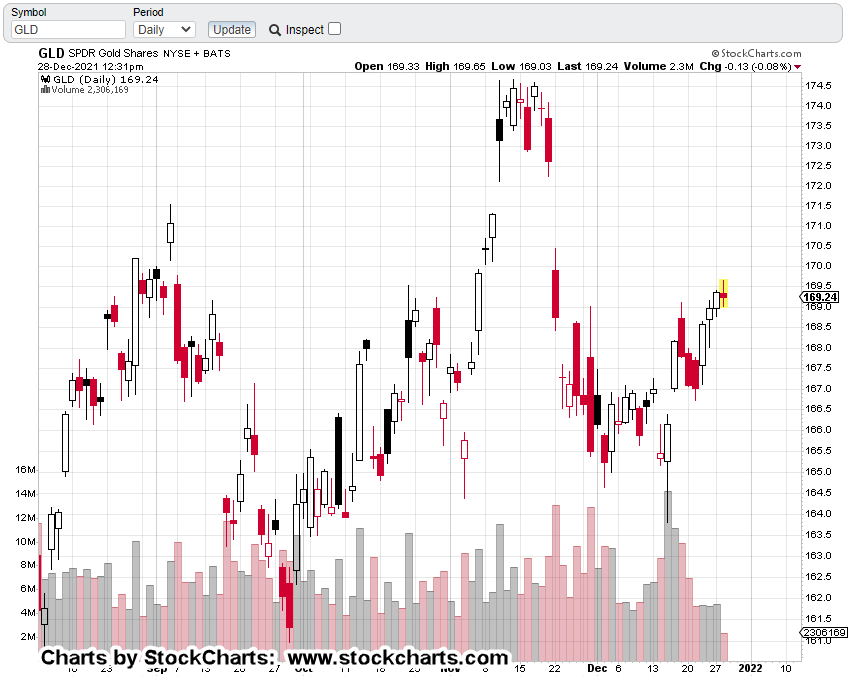
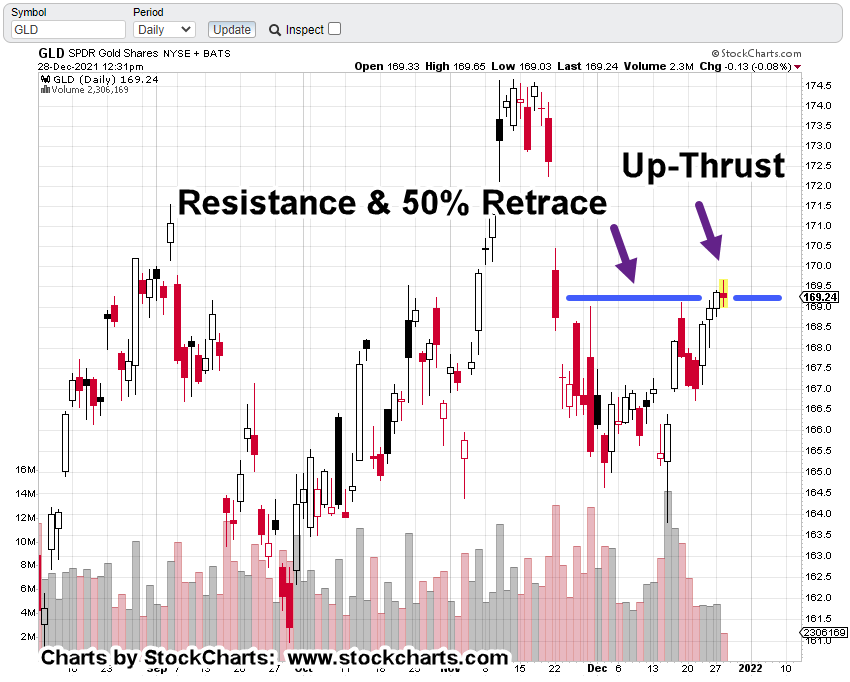
That brings us to Friday’s action and the chart of gold (GLD), below.
Gold (GLD), Daily
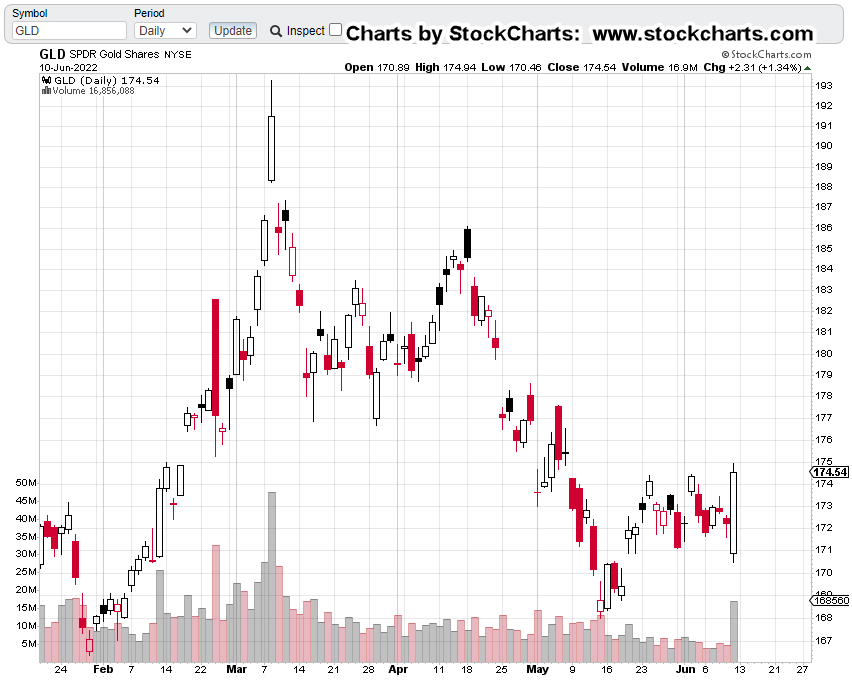
Long-time users of this site may instantly recognize the set-up.
To help make it more clear, we’ll go down to the hourly chart and mark it up.
Gold (GLD) Hourly

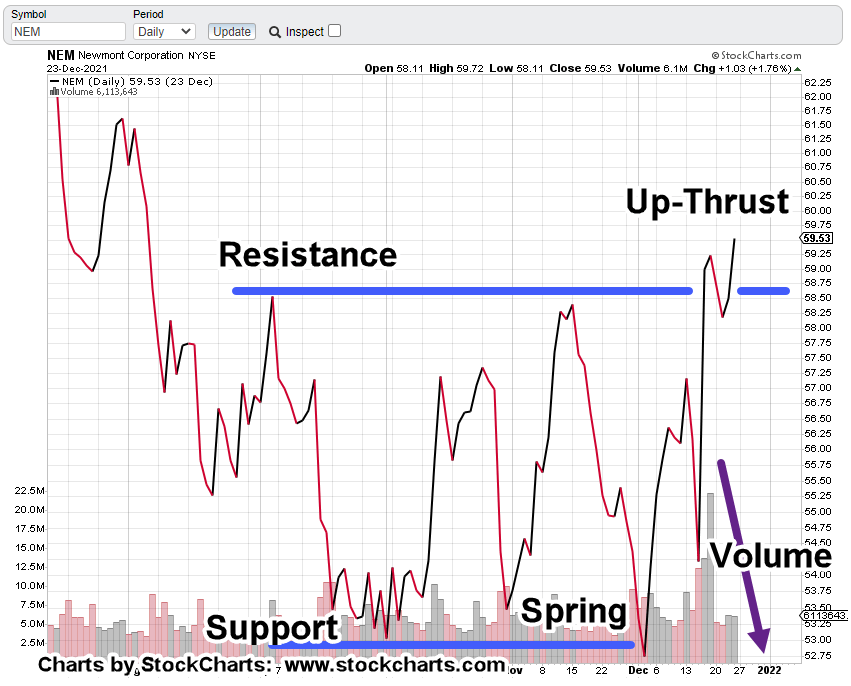
There we have it.
The repeating pattern of “Spring-to-Up-Thrust.
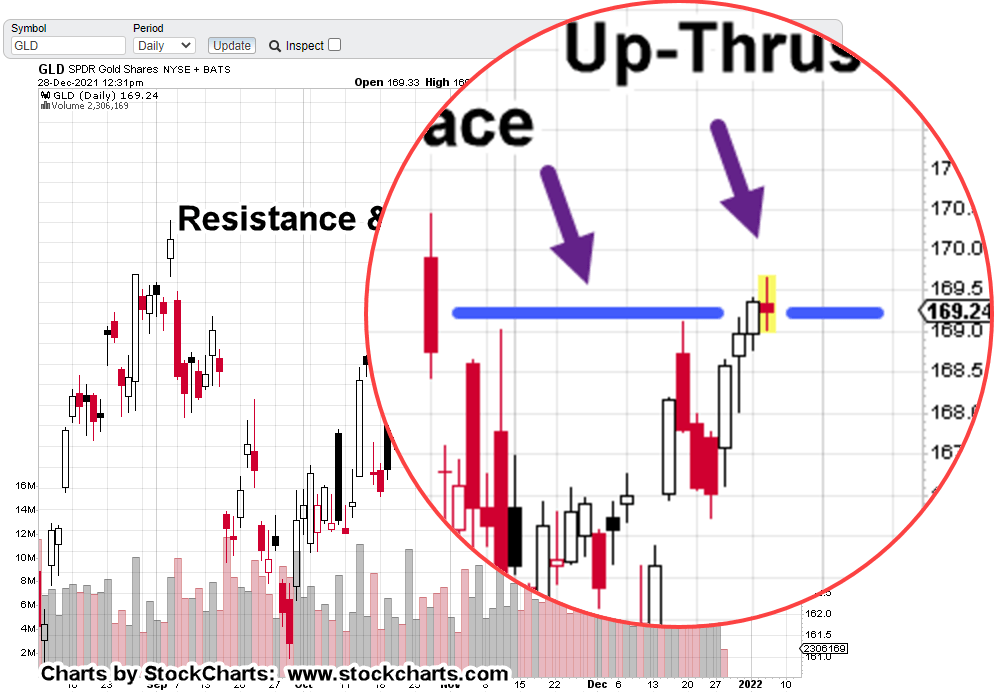
Let’s go back to the daily and put in the same notations.
Gold (GLD), Daily

Following on with this morning’s action we have this.

Price action has already posted a new daily low; adding confirmation, the trend remains down.
The fact there was heavy volume this past Friday, sets the hook even deeper into the bulls.
This action, up-thrust plus volume, may result in yet another sustained pivot to the downside.
Summary
It took me twenty-years of diligent search to eventually find the answers to market behavior.
That answer came in 2007, in the form of Wyckoff analysis and the late David Weis, with his video, linked here.
I was fortunate to be mentored by him before he became somewhat of a star … having a waiting list a mile long.
After that, was the constant study of his daily market updates for more nuggets of wisdom.
In a nutshell:
Gold (GLD) reversed today, because price action got itself into an up-thrust condition after launching from a spring set-up.
That’s it.
There’s no CNBC, no Fed, no Fast Money, no Russians, no Hyper-Inflation; just the market, itself.
Stay Tuned
Charts by StockCharts
Note: Posts on this site are for education purposes only. They provide one firm’s insight on the markets. Not investment advice. See additional disclaimer here.
The Danger Point®, trade mark: No. 6,505,279