All The Same ‘Look’

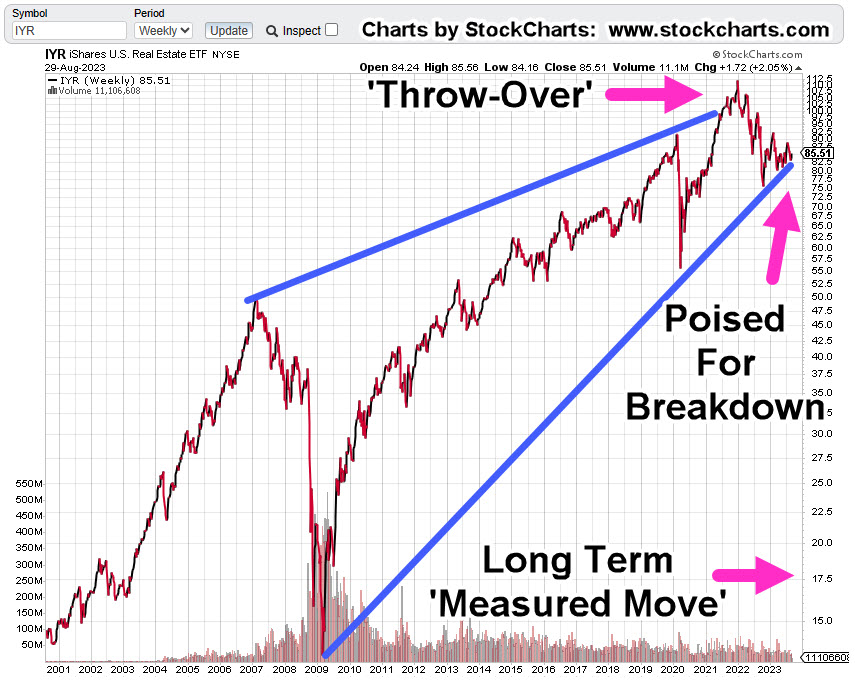
Did we just have the largest bull trap in market history?
Now, after the bulls (may) have been caught off-guard, we have this; the specter of ‘deflation‘ and demand destruction.
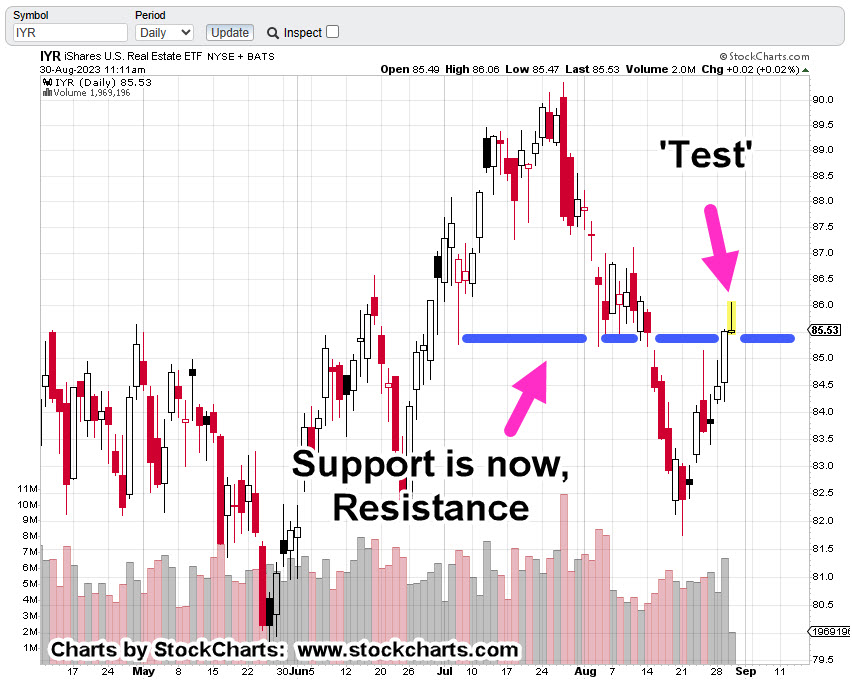
Last Tuesday’s CPI report provided a backdrop for the continued squeeze higher.
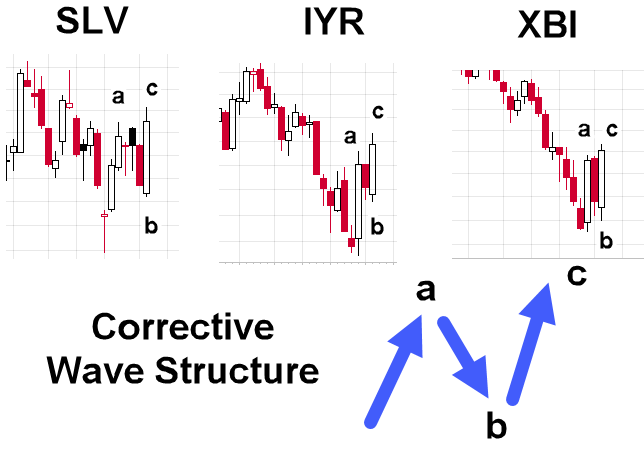
Over the past several weeks, at least three markets have developed the same (bearish) ‘look’.
They’re posting corrective ‘a-b-c’ price action, going against the main trend.
SLV, IYR & XBI, Weekly
Take a look, all similar in their formation.
Positioning
As of the close on Friday, I have positioned short in all three markets (not advice, not a recommendation).
The IYR short was initiated this past Wednesday, the Silver short on Thursday, then just minutes before the close on Friday, the biotech short.
Trades are labeled as SRS-23-04, ZSL-23-01, LABD-23-13
Next Steps
The coming week is likely to see one, or a variation of the following: all trades stopped out, one or two trades with discretionary exit, then followed by potential concentration on the best candidate.
Stay Tuned
Charts by StockCharts
Note: Posts on this site are for education purposes only. They provide one firm’s insight on the markets. Not investment advice. See additional disclaimer here.
The Danger Point®, trade mark: No. 6,505,279