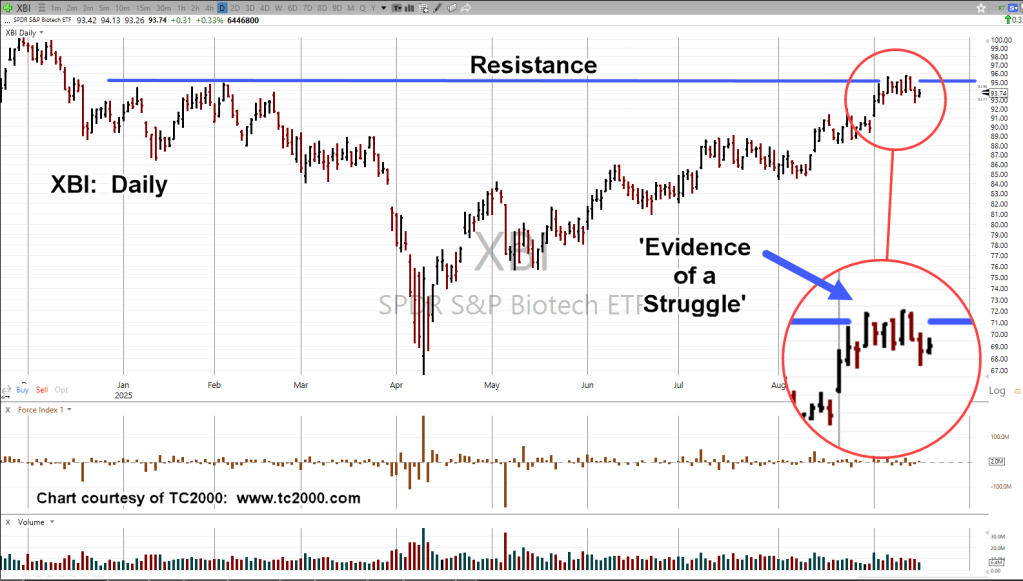
Breakout Into Resistance

Both biotech funds, IBB, and XBI, are now in an up-thrust (potential reversal) condition.
In each case, the ETFs have pushed through a long-established trading range, straight into resistance.
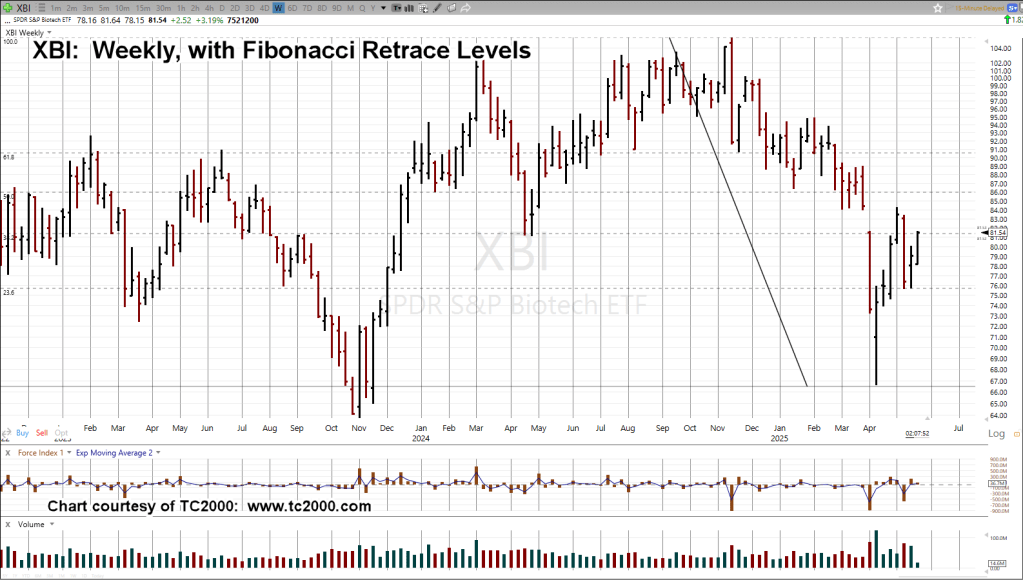
The last update focused on less liquid IBB, because it was not known if heavily traded XBI, would push through its trading range (being the weaker of the two).
Since that initial update, both indices are now above their trading range.
Of course, what happens next is the question.
Biotech XBI, Weekly
The blue line is long established resistance.
The black dashed line is the top of the trading range and the up-thrust condition.
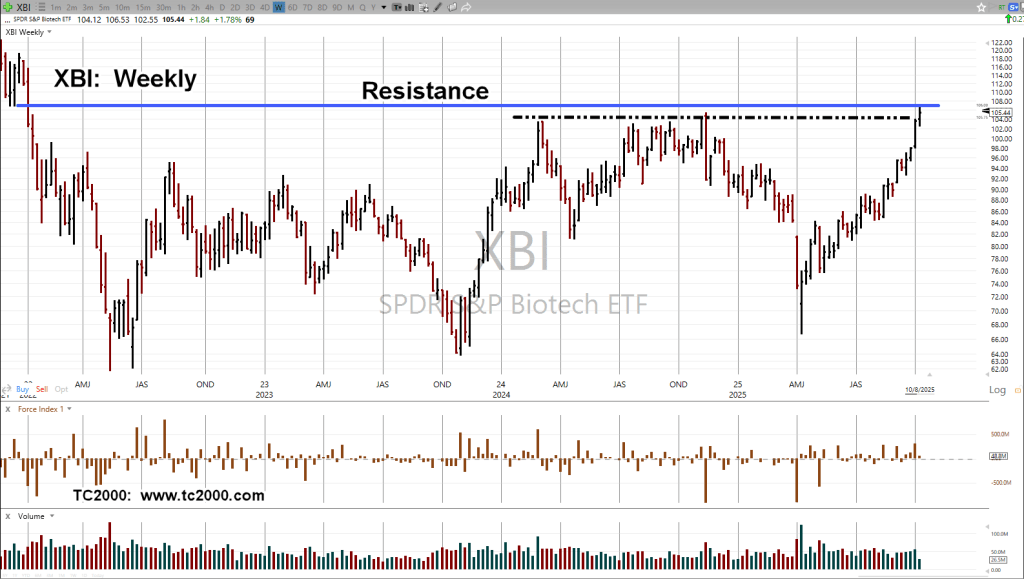
At this point anything can happen.
XBI, could reverse immediately or grind its way along, dissipate momentum, or even move higher.
We’re at the point where the risk of being wrong on a short position is least (not advice, not a recommendation).
Stay Tuned
Charts by StockCharts
Note: Posts on this site are for education purposes only. They provide one firm’s insight on the markets. Not investment advice. See additional disclaimer here.
The Danger Point®, trade mark: No. 6,505,279