Note: Posts on this site are for education purposes only. They provide one firm’s insight on the markets. Not investment advice. See additional disclaimer here.
For the past six months, the overall strategic assessment of silver has been consistent; sideways to bearish.
Stategic, because there are always opportunities for bulls and bears if your timeframe is short enough.
Six months ago in May, the high for silver SLV, was 29.56. So far this month, the high is 30.01, a +1.52% difference.
Not exactly ‘sideways’ but as we’ll see below, it’s potentially bearish (not advice, not a recommendation).
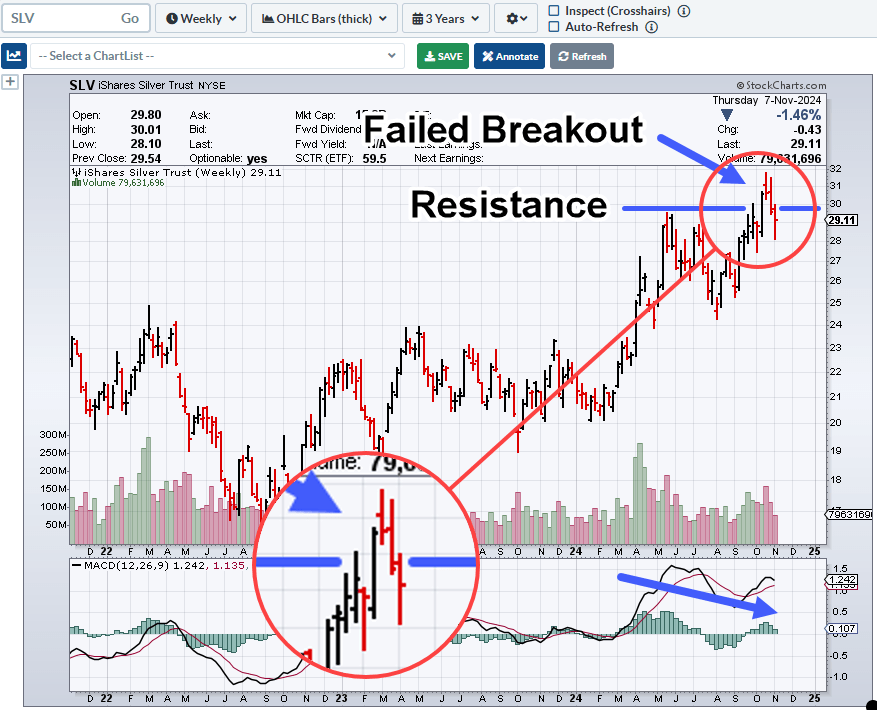
Silver SLV, Weekly
The measured move, discussed back in May, link here.
Back then, at the link above was this:
“The coming week could see SLV, inch its way higher to the measured move or continue the testing (possibly, reversal) action it started last week.“
Well, it took SLV, nineteen-weeks to ‘inch its way higher’ to just tap the measured move target.
All of which brings us to the next chart.
If the wedge is in-effect and SLV breaks down, depending on location, SLV, target could be in the vicinity of 20 – 22 area (not advice, not a recommendation).
Note: Posts on this site are for education purposes only. They provide one firm’s insight on the markets. Not investment advice. See additional disclaimer here.
For silver bulls, it must feel like the old Rod Stewart song, from the early 70’s, ‘In a Broken Dream’;
‘Right now, is where you are … in a broken dream’
Especially so, for those allowing themselves to be subjected to non-stop propaganda about a ‘hyperinflation breakout’ or that silver’s going to ‘close the gap’ with gold.
So, it’s been nearly six months … where is it?
Meanwhile, back at the ranch during those same six-months, the press and YouTube grifters et al., were ignored.
Analysis was fact based; what’s the market saying is the most likely thing to happen?
The last post, link here, said to watch out for a failed breakout (Wyckoff Up-Thrust).
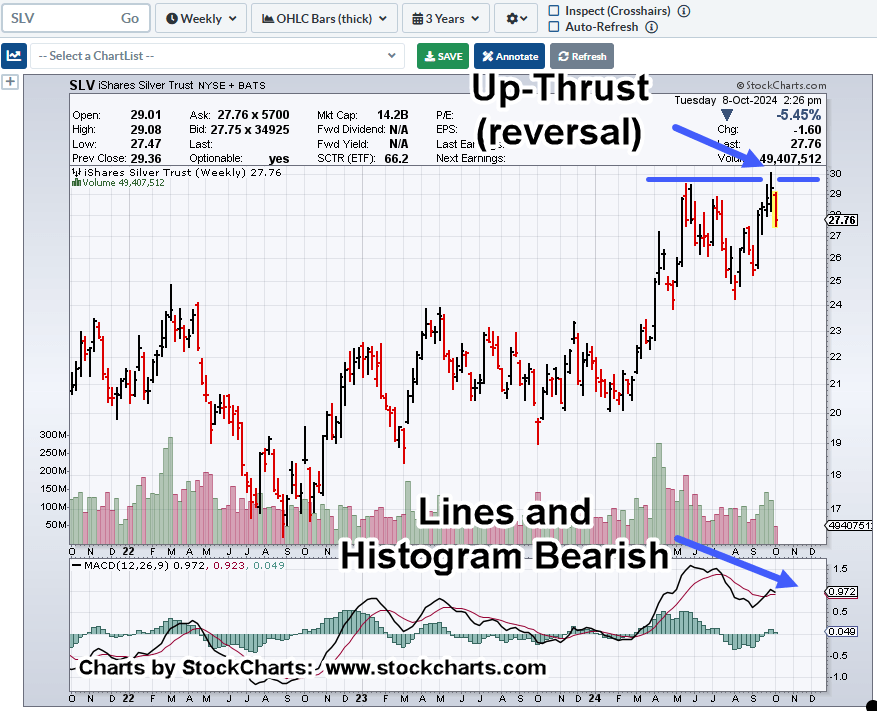
Silver SLV, Weekly
SLV price action has posted a new weekly low; both MACD lines, and histogram, show bearish divergence.
Of course, anything can happen. Silver could move higher.
However, the chart says, at this point, probability for (significantly) higher action is low (not advice, not a recommendation).
Note: Posts on this site are for education purposes only. They provide one firm’s insight on the markets. Not investment advice. See additional disclaimer here.
We’re about to find out if silver (SLV), is headed for a breakout, sideways congestion and/or, outright reversal.
In a world that seems to be allergic to the truth (as serpentza, put it), we’re going to do just that; look at the truth, the price action itself.
The last update, link here, said to watch for an SLV, breakout that could fail, confirming a bearish divergence.
From the intro line, here we are.
We have the breakout.
All that’s missing is continuation higher or reversal (not advice, not a recommendation).
So, let’s go to the truth of the matter, the SLV chart.
Silver SLV, ETF, Daily
Years ago, Dr. Elder stated, when MACD histogram and MACD lines are parallel (bearish divergence), it’s a rare occurrence.
The coming week might be the deciding factor.
Before we leave this post, let’s throw in a bonus and consider the dollar ‘collapse’ narrative.
Dollar ‘Collapse’, Where?
Below is an updated chart of the dollar index.
Note the arrow to this link, posted nearly four years ago!
Dollar Index UUP, Weekly
It’s important to note, at the time the ‘Reversal Ready’ post was created, there was absolutely no-one (that was known) indicating the dollar index was headed significantly higher.
This is what’s meant by ‘Strategy’ in the About section.
Livermore was focused on what’s going (or likely) to happen in a big way.
Note: Posts on this site are for education purposes only. They provide one firm’s insight on the markets. Not investment advice. See additional disclaimer here.
If you know something’s coming, then you can keep your head when it actually happens.
Nothing seems to bring out the (dollar collapse) pundits more than precious metals and specifically silver; we can throw in Nvidia as well, but that’s another story.
Strategically, Wyckoff analysis all the way back to April, of this year has proven correct.
That is, silver is not launching into some kind of hyperinflation breakout; it would have already done so.
No, silver is either preparing for a downside reversal or sideways congestion (not advice, not a recommendation).
We have one datapoint after another, the consumer is strapped; corporations, industries using silver are collapsing, going bankrupt; bullion dealers themselves have said silver demand has evaporated and on it goes.
With that, let’s look at what silver (SLV) is telling us.
Silver SLV Tracking ETF, Weekly
As of this post (10:45 a.m., EST), silver (SLV) is nearing yesterday’s high of 29.44
We’ve got a weekly bearish divergence that will be in effect if there’s a breakout and downside reversal (not advice, not a recommendation).
Of course, the question is, what happens if/when we get a breakout?
One thing is almost for sure, the ‘dollar collapse’ pundits, YouTubers et al., will be out in force. 🙂
Note: Posts on this site are for education purposes only. They provide one firm’s insight on the markets. Not investment advice. See additional disclaimer here.
Note: Posts on this site are for education purposes only. They provide one firm’s insight on the markets. Not investment advice. See additional disclaimer here.
Those who ‘drank the Kool-Aide’ about silver being bolstered to astronomical heights because, you know, ‘solar energy’, must be a little upset by now.
Just like the fabled ‘interest rate cut’, it’s not happening.
Although for interest rates, we’re just shy of two weeks away to find out; meanwhile, since the last report, the bond market has been bid up again, pushing rates down (again), so, we’ll see.
Back to silver.
We have yet another so-called ‘green energy’ company going bankrupt. That’s not so much news, except for this statement from the report (paraphrasing):
‘Solar demand has declined across the entire industry’
Um, it’s called an economic depression (not advice, not a recommendation).
While we’re talking collapse, let’s just throw in the Chat GPT (Artificial Intelligence) collapse as well, link here.
With all of that as the backdrop, let’s see what silver is up to these days.
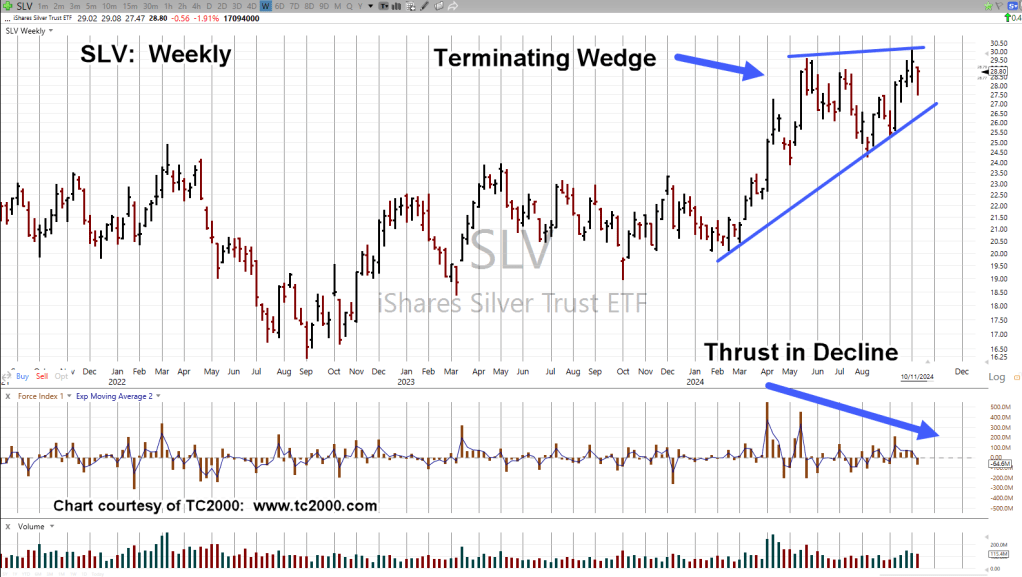
Silver, SLV ETF, Weekly
A terminating wedge with an MACD crossover.
We’re at the spot with price could go either way. There has been no wedge breakout to the upside, or down.
If we do get an upside breakout, the position of the MACD is set-up for a potential bearish divergence.
Covered many times on this site; the possibility that precious metals could move higher as a result of the miners imploding.
Adding to that idea are the components of tracking SILJ, silver miner EFT. How many of these outfits have an actual P/E?
PAAS does not, HL … no, CDE … no, NEXA … no, GORO … no, and on it goes.
Note: Posts on this site are for education purposes only. They provide one firm’s insight on the markets. Not investment advice. See additional disclaimer here.
Things just aren’t working out for the silver bulls.
The metal is down yet another 1% in today’s session.
Not only that as we’ll see below, but we could also be in a downward trading channel as well.
Talk about a ‘hyperinflation breakout’ has all but disappeared and we’re back to the (very lame, by now) excuse that it’s all because of those evil ‘manipulators’.
Leaving delusion behind, back to reality, price action itself, this site’s been consistent for over five months.
That is, silver’s exhibiting characteristics of a downside reversal or sideways congestion (not advice, not a recommendation).
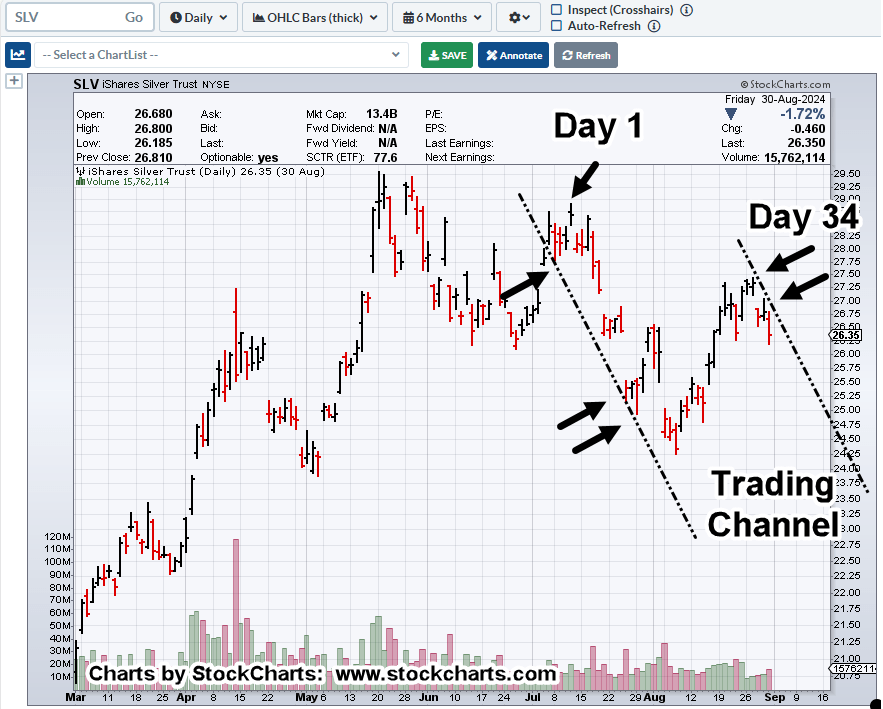
Silver SLV, Daily
From the chart above, we can see the right-side being confirmed over the past four or five sessions (black arrow contact points).
Also noted, there’s a Fibonacci time correlation between the intermediate high on July 11th and the right-side channel line contact on August 27th.
July 11th, was also the SOXX top.
About two decades ago, Prechter first proposed, ‘It’s all the same market’; meaning, that it’s the liquidity in the system that’s moving prices.
As that ‘liquidity’ dries up with more demand for cash (fiat, or not), the expectation is for the market indices to respond to that demand (not advice, not a recommendation).
Note: Posts on this site are for education purposes only. They provide one firm’s insight on the markets. Not investment advice. See additional disclaimer here.
Looks like the silver wipeout took more than a few by surprise.
However, that’s not the real story.
Some of the comments on various YouTube ‘analysis’ sites are to the effect:
I don’t know what to believe. I don’t know what’s real.
The inference is, that silver ‘should’ have gone higher.
There was supposed to be some kind of massive breakout as we head into hyperinflation, right?
Track Record, vs. ‘Should’
Part of the reason for posts on this site is to establish a track record.
The silver analysis over the past four months is the best recent example.
That assessment never wavered; price action in SLV, is consistent with either an outright reversal, or sideways congestion (not advice, not a recommendation).
It is not consistent with a hyperinflation breakout.
Longtime visitors to this site would have least known that ‘something’s up’ with silver.
Its behavior does not fit the narrative.
Anything Can Happen
As always, the market can reverse and do something unexpected.
Price action could change character.
If so, the objective is to identify that change early, then assess opportunities (if any).
Note: Posts on this site are for education purposes only. They provide one firm’s insight on the markets. Not investment advice. See additional disclaimer here.
Especially shocking after having been subjected to non-stop delusion (now going on four months), and being ‘certain’ precious metals were headed higher.
Enough already.
Silver (SLV) is currently trading down a whopping -4.7%, in the pre-market session. Gold (GLD) is lower by about -1.2%.
Silver analysis has been consistent; SLV, price action itself, indicates a top and reversal or at best, sideways congestion (not advice, not a recommendation)
If one wants to review, starting back in April, we have:
Now, this update essentially completes the process.
Silver, SLV, is about to open well below resistance as shown in the ‘Stalls-Out, update.
The Battle Against ‘Tik-Tok’ Brain
Fewer and fewer have a brain … like this (warning, profanity).
This guy sounds very much like the one in the ‘About‘ section. 🙂
Housekeeping: UNG, JDST
As can be inferred, a short trade via JDST, has already been opened: JDST-24-05.
Depending on today’s action, the stop listed is likely to be moved higher (not advice, not a recommendation).
Nat-Gas (UNG), on the other hand, is not behaving as expected.
The initial position UNG-24-11, was reduced by 80%, as a result of yesterday’s action. It’s likely that position will be closed out completely during this session (if not already).
Note: Posts on this site are for education purposes only. They provide one firm’s insight on the markets. Not investment advice. See additional disclaimer here.