Massive Volume & Gap

From a Wyckoff and David Weis analysis perspective, wide high-volume, price bars tend to be tested.
What does that tell us (to anticipate) with Micron’s huge gap-up with volume?
When we go to the chart, we see more … a lot more.
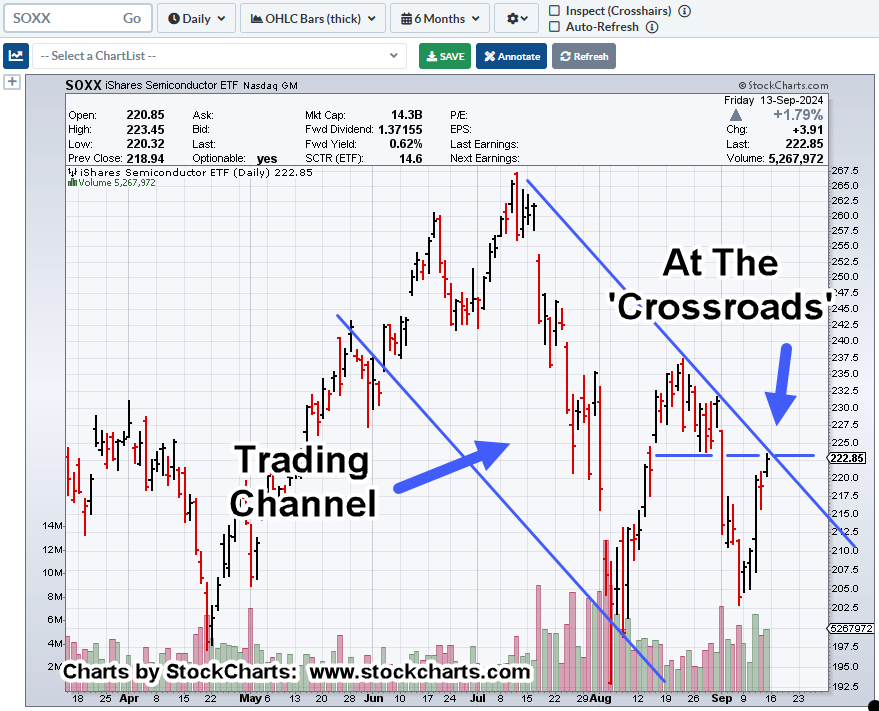
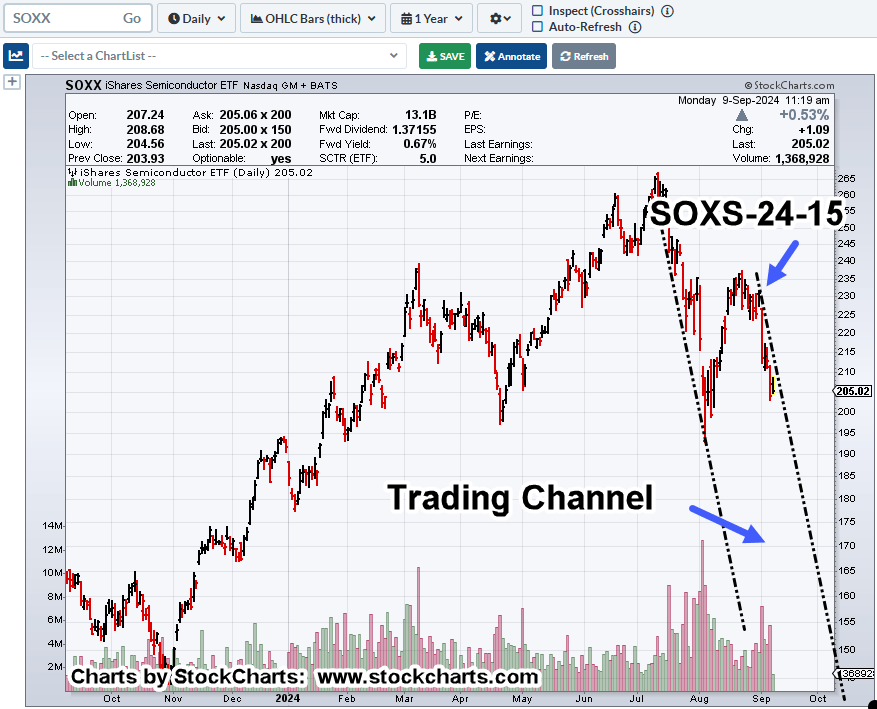
Frist off, let’s not forget, Micron’s Number Nine, in market cap within the SOXX, tracking ETF.
Its price action behavior (significantly) affects the index.
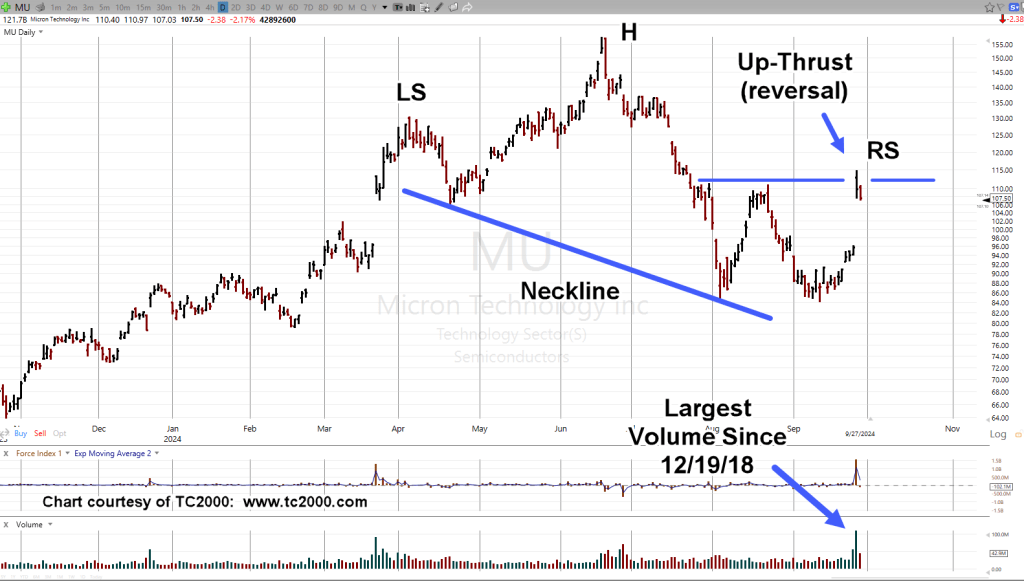
Micron Technology MU, Daily
We’ve got a (possible) Head & Shoulders. with an Up-Thrust, precipitated by good news (here and here).
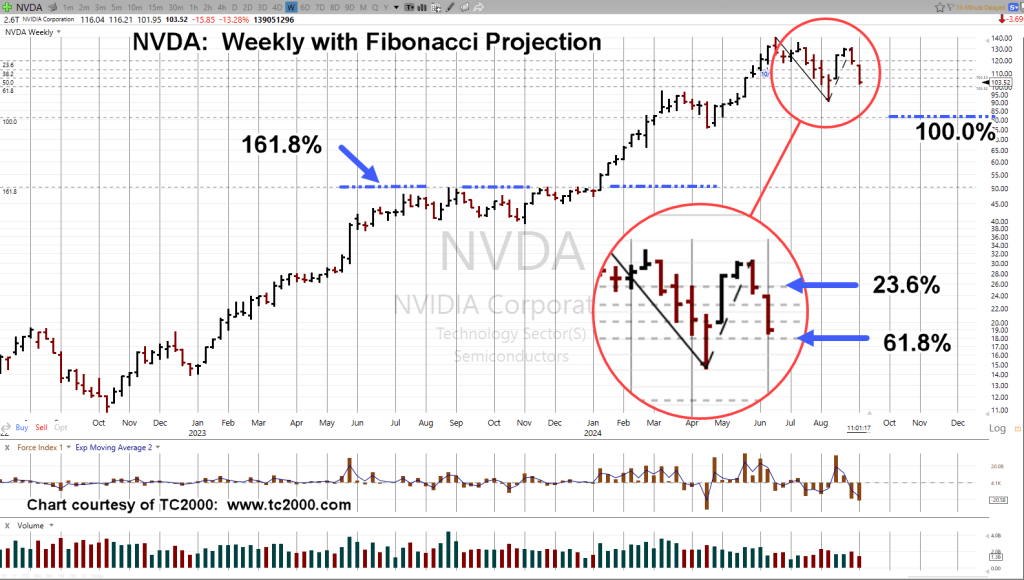
It’s been 70 (trading) Days since Nvidia hit all-time highs; a high forecasted, then confirmed here and here:
Back then, was this:
“With the prior update letting us know the air is going out of support for continued A.I., today’s action may be a significant reversal (not advice, not a recommendation).”
It was significant. Nvidia has not been there since.
Implications
The implication with the (still holding) Nvidia top, is the A.I. bubble has burst.
Possibly the largest asset bubble in world history.
What we’re seeing with Micron, is potentially the last gasps of short covering, with an attempt to mount a rally in an overall deflating market (not advice, not a recommendation).
Stay Tuned
Charts by StockCharts
Note: Posts on this site are for education purposes only. They provide one firm’s insight on the markets. Not investment advice. See additional disclaimer here.
The Danger Point®, trade mark: No. 6,505,279