Testing The Underside

After the ‘test’, is that when the plug is pulled?
It’s the market’s job to frustrate (nearly) every single participant, bull or bear, into submission, into giving up and exiting just before the real move gets underway.
How many times have you heard (or experienced) the following:
“The market stopped me out, then took off for a huge gain … without me”.
Experience (i.e. many losses) is the ability to know when the trade (premise) is broken or just going through a test. 🙂
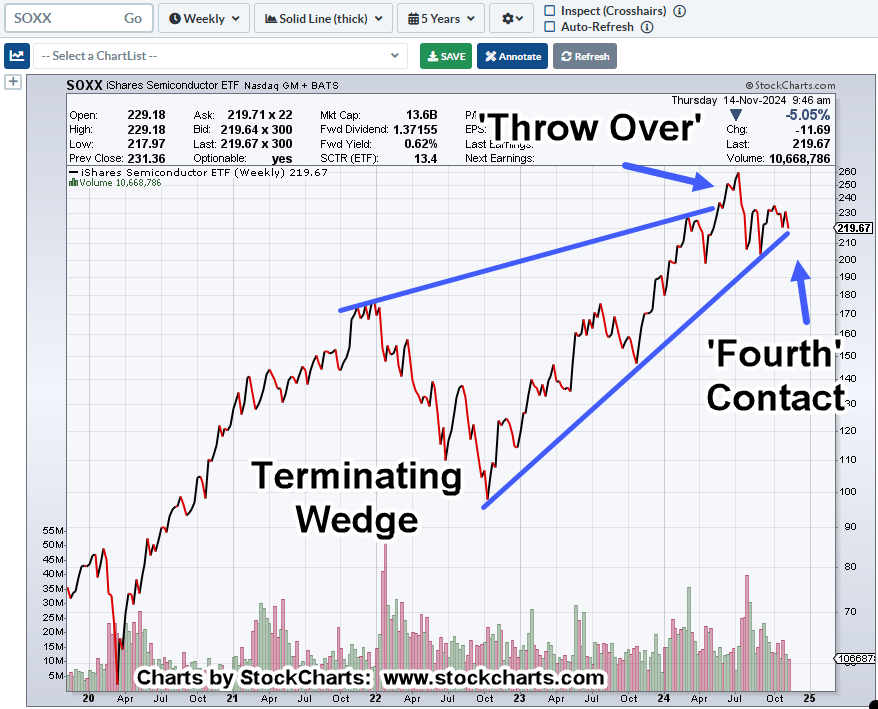
Looking at the SOXX, it’s a compelling (test) picture (not advice, not a recommendation).
Semiconductors SOXX, Weekly
Prior updates (here and here) have shown the similarities of the A.I. bubble to the dot-com bubble of the 2000s.
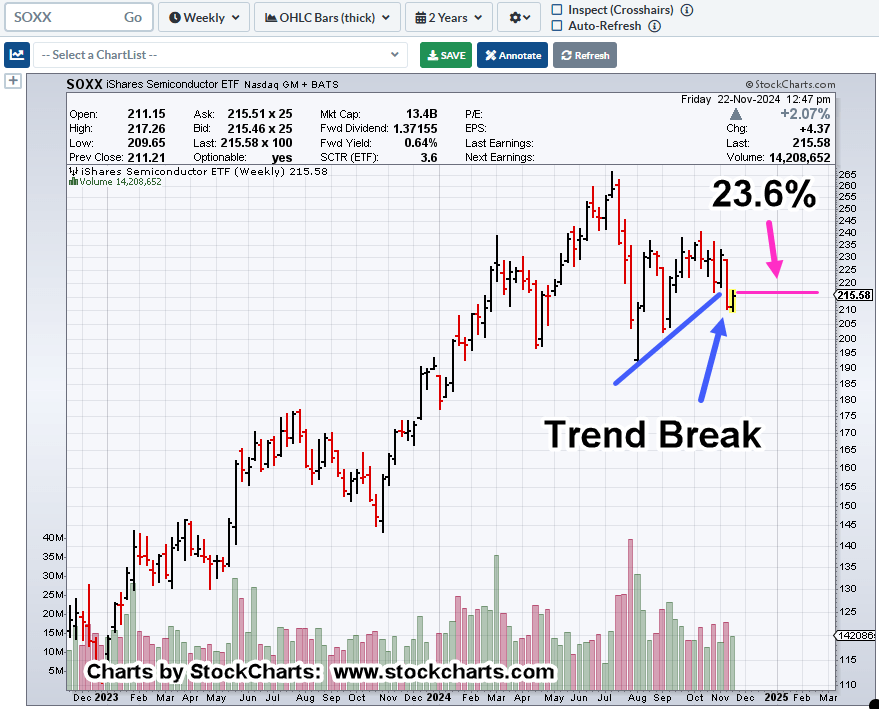
One of the events watched for, was the ‘trend break’.

As of today, the market is currently testing that break.
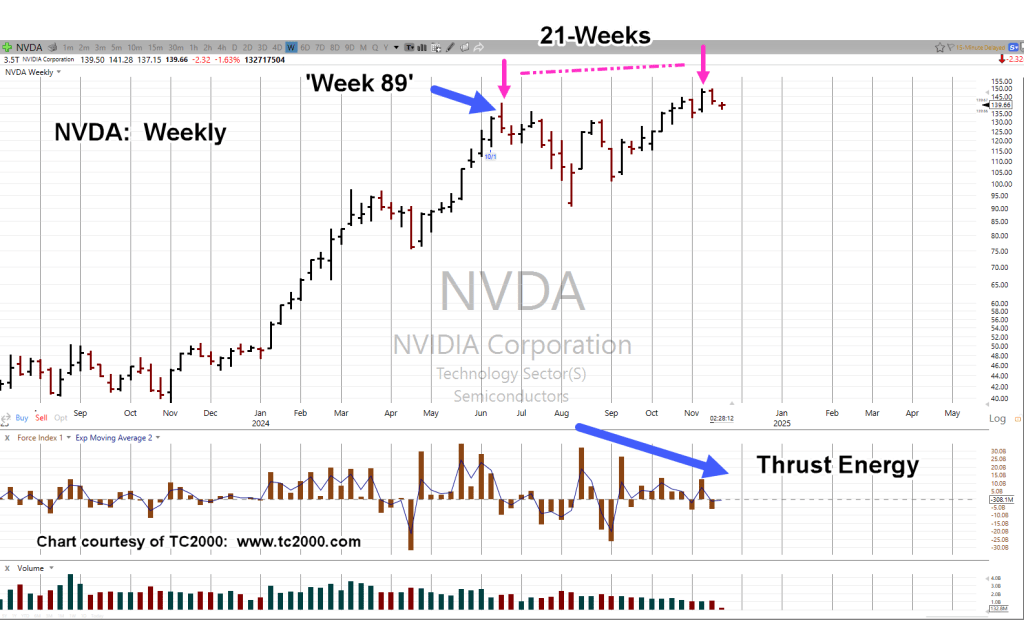
The fact we have a new weekly (retrace) high as well, presents a Fibonacci time correlation.
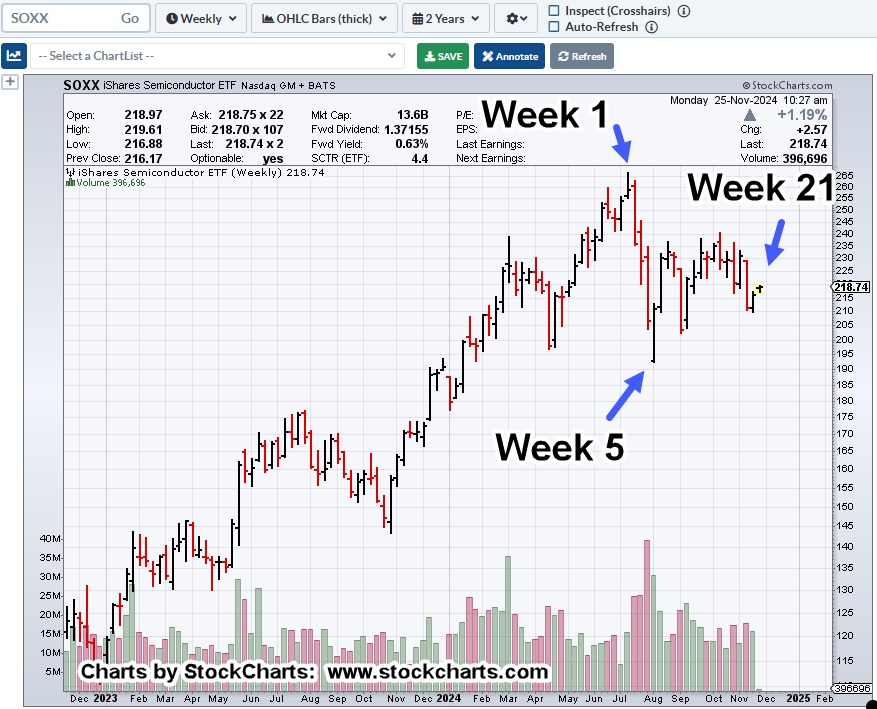
This week is Fibonacci 21-weeks from the all-time-high in the SOXX.
A downside reversal from this point may indeed tell us, ‘The plug has been pulled’ (not advice, not a recommendation).
Stay Tuned
Charts by StockCharts
Note: Posts on this site are for education purposes only. They provide one firm’s insight on the markets. Not investment advice. See additional disclaimer here.
The Danger Point®, trade mark: No. 6,505,279