We’ve got the daily chart of LABD, leveraged inverse fund Biotech, SPBIO, above.
Next, we highlight the tight price action and note the failed push lower:
Scroll up and down between the two charts and you can see, this is an area where the market has firmed-up.
Tight action is usually (not always) a pre-cursor of an upcoming move. One side is taking control; about to take the market their direction.
Note: The last two days (including today) show a pivot of sorts … still very young.
Positioning:
The tight stop on the DRV position was hit early in the session. Exit was performed at DRV 4.4336 (not advice, not a recommendation).
That freed-up capital was then allocated to a position in LABD (again, not advice, not a recommendation).
The stop is tight at LABD 18.79.
Stay Tuned
Note: Posts on this site are for education purposes only. They provide one firm’s insight on the markets. Not investment advice. See additional disclaimer here.
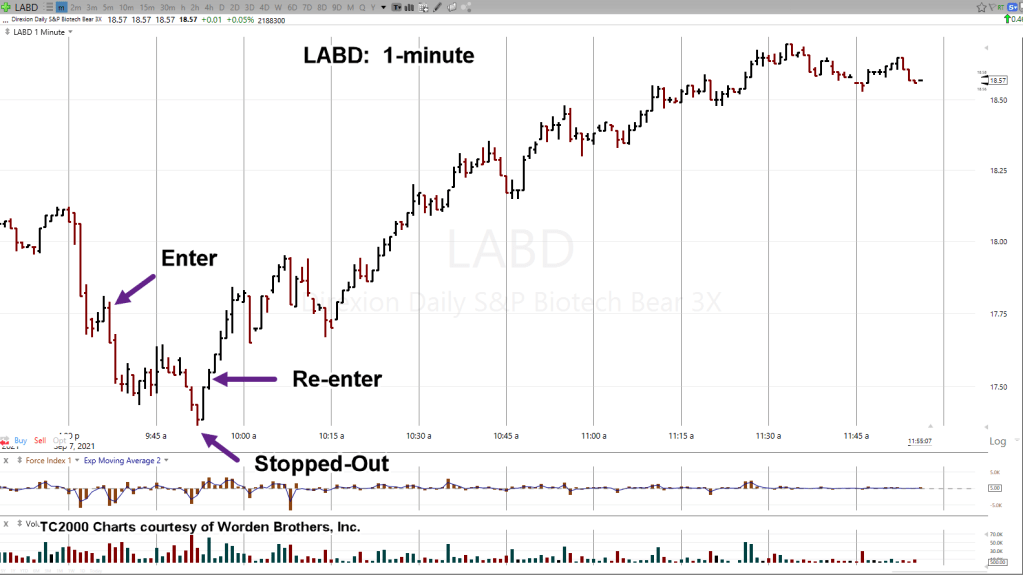
Using the prior day’s analysis that a short entry was low risk, the first attempt was long LABD 17.78, tight stop at the prior day’s low of 17.38 (not advice, not a recommendation).
As the chart shows, it did not take long to get stopped out and have LABD post a daily low of 17.37.
Immediately after the exit (within seconds), price action began to recover. The behaviour of this action gave the go-ahead to make a second entry.
After the second entry, price never came back. The stop on the position was changed to be the low of the day: 17.37 (not advice, not a recommendation)
Stay Tuned
Note: Posts on this site are for education purposes only. They provide one firm’s insight on the markets. Not investment advice. See additional disclaimer here.
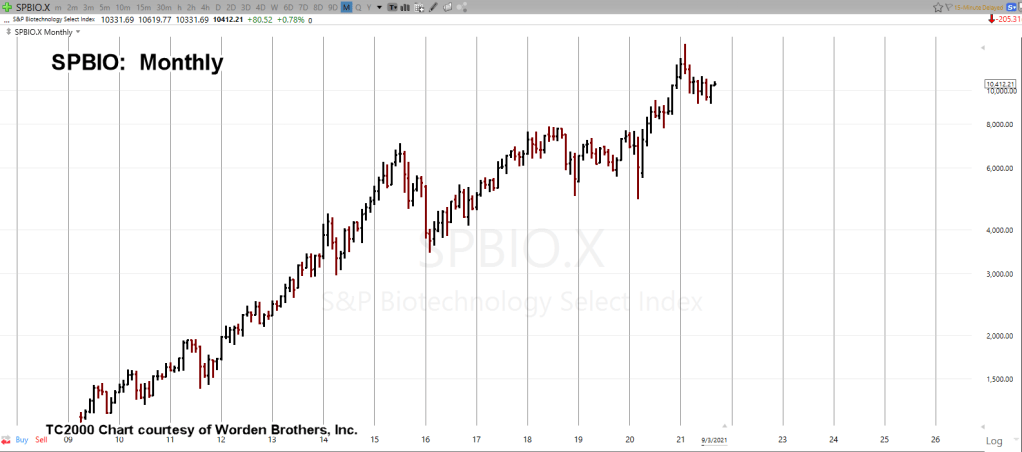
The big picture for biotech SPBIO, is above. The monthly chart shows a steady progression higher since 2009.
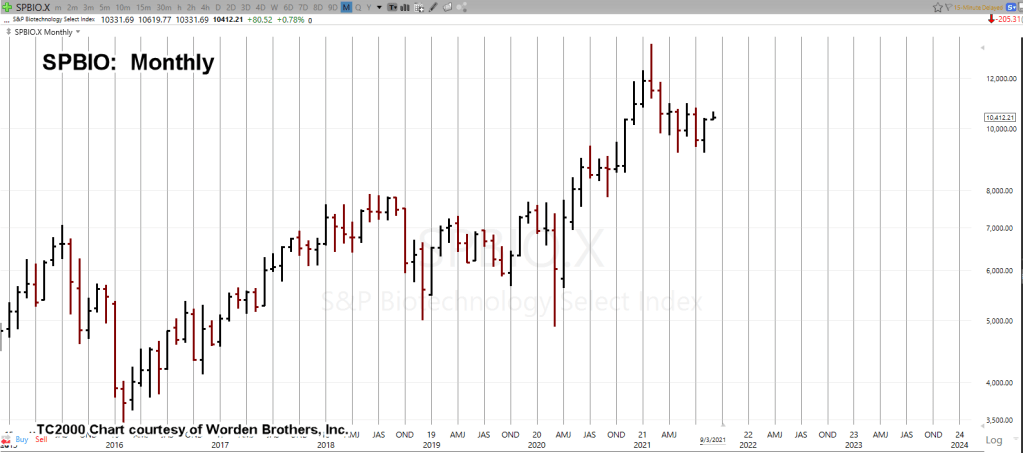
Stretching the monthly out a bit gives us the next chart:
The two months of reversal back in February – March of this year are clear. Those two bars have yet to be negated. We’re still in a reversal lower until price action pushes back into that range.
Zooming into the monthly bars at the right side highlights a market anomaly; something called ‘the clustering of the closes’.
You can’t see it, unless you’re looking for it. Note how the blue line intersects a good number of the opens and the closes.
This location is an area of resistance. So far, price action can’t get appreciably higher than the resistance (blue line) area.
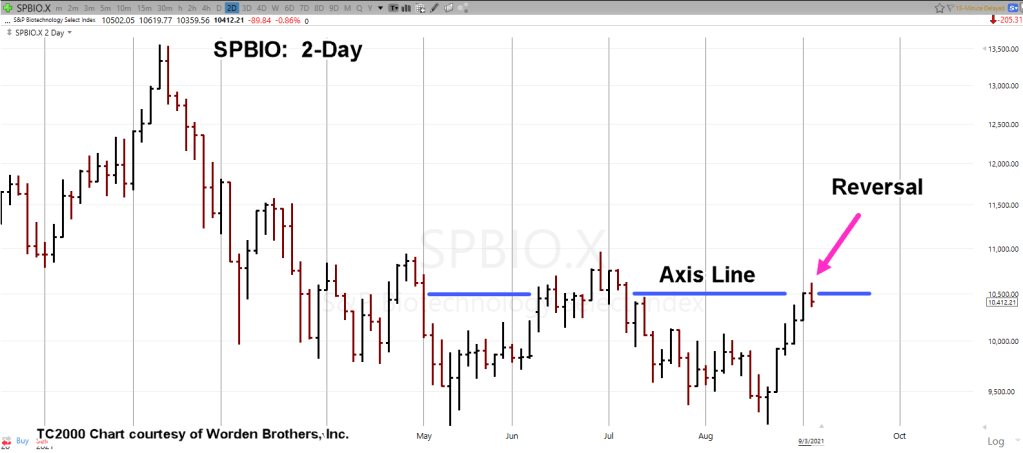
Drilling even further down to the 2-Day chart and we see the straight up action for the past two weeks … that has now contacted the axis (resistance) line and reversed.
So, was that two weeks a short squeeze?
Typically, once the shorts have covered, there’s not much left holding up the market.
Unless there’s a gap higher above the axis line at the next session, risk of going short at this location is low (not advice, not a recommendation).
Stay Tuned
Note: Posts on this site are for education purposes only. They provide one firm’s insight on the markets. Not investment advice. See additional disclaimer here.
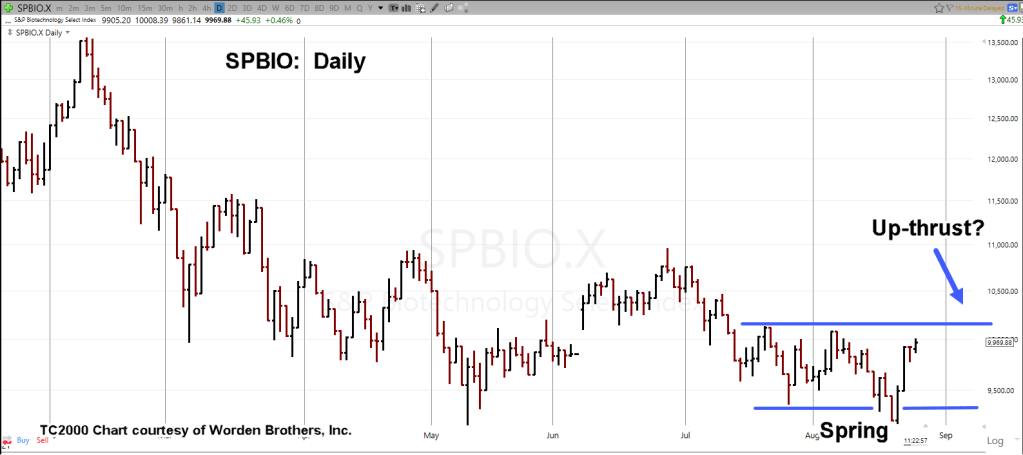
Biotech SPBIO, just went into a spring condition and is now in a rally.
From the sage observations of David Weis, we can expect … or at least start to look for, an Up-thrust.
The unmarked daily chart of SPBIO, is below. The charts that follow, show the potential up-thrust area. After that, we have a Fibonacci 23.6%, level added.
Just to add intrigue, September 7th, is 12-days from the August 20th low … well within acceptable range for a Fibonacci 13-Days.
Spring and Up-thrust notations:
Fibonacci retrace level:
Stay Tuned
Note: Posts on this site are for education purposes only. They provide one firm’s insight on the markets. Not investment advice. See additional disclaimer here.
Note: Posts on this site are for education purposes only. They provide one firm’s insight on the markets. Not investment advice. See additional disclaimer here.
Note: Posts on this site are for education purposes only. They provide one firm’s insight on the markets. Not investment advice. See additional disclaimer here.
Our ‘parabolic’ report on MRNA, was posted before the open, August 10th.
That post included the following summary:
‘This is the type of parabolic rise (and blow-off top) typically seen in commodities.’
Then, about seven minutes after the open, MRNA peaked and reversed into a two-day collapse over -25%.
Down-thrust energy, the amount of downward force in price action, was literally off the chart; the strongest ever recorded since MRNA, started trading in December of 2018.
Price action leads the news. This case was no exception.
This report, just out on ZeroHedge shows there’s a half-hearted attempt to draw attention to a so-called ‘rare’ side effect.
Even so, the insiders probably figure the jig is up and they’re bailing out.
The biotech sector (SPBIO) continues its bear market decline. Yesterday, it closed down over -32%, from its February 2021, highs.
Note: Posts on this site are for education purposes only. They provide one firm’s insight on the markets. Not investment advice. See additional disclaimer here.
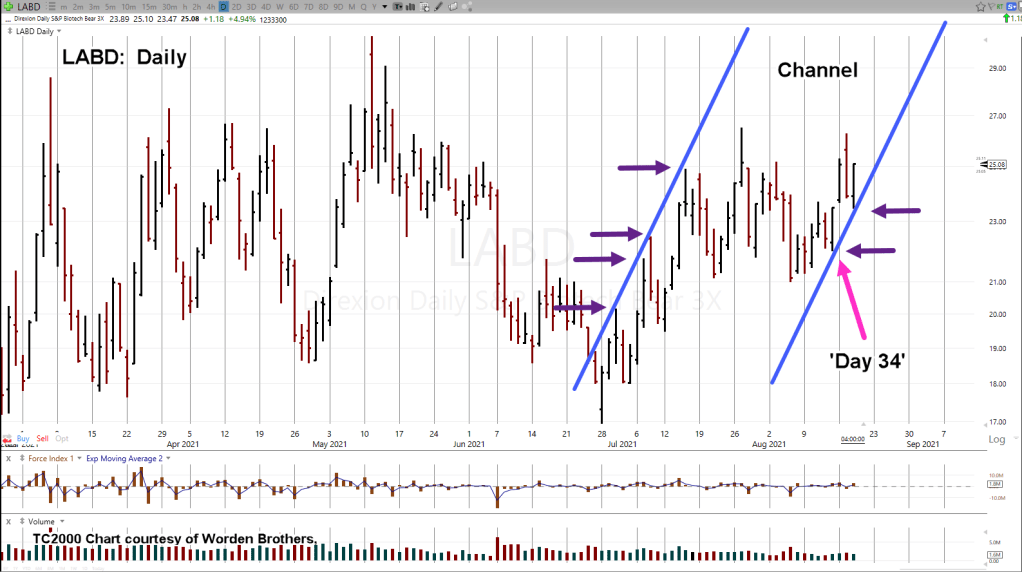
For months, the biotech SPBIO and its leveraged inverse fund LABD have shown a repeating trendline characteristic.
This time around, the two right-side trend contact points (shown above) are LABD’s (Day 34) outside up reversal and today’s Fed minutes release, reversal.
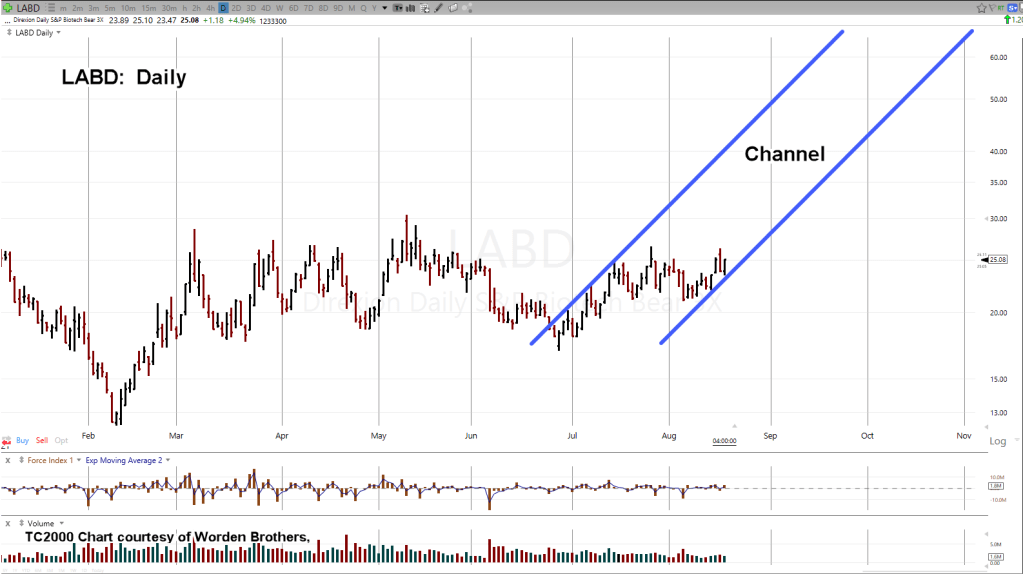
The chart below is a compressed version of LABD. It gives a better perspective on the gain potential.
Looking at the chart it’s clear why so much focus has been placed on strategically shorting biotech (not advice, not a recommendation).
If there’s a decisive SPBIO break lower, the gain potential for inverse LABD is significant.
Time frame for exit (not advice, not a recommendation) unless price action dictates otherwise, is still planned for mid-October.
Stay Tuned
Note: Posts on this site are for education purposes only. They provide one firm’s insight on the markets. Not investment advice. See additional disclaimer here.
If the mainstream media is good for anything, it’s the ability to keep the herd, the retail, (Robinhood kids, et al.) fully distracted until it’s absolutely too late for action.
Even though this report from ZeroHedge gives all kinds of ‘signals’ saying we’re not there yet; It even goes as far as showing there’s no yield curve inversion. Of course that means ‘no risk’ of bear market.
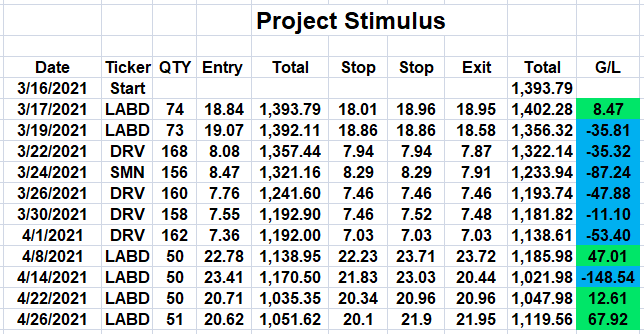
Then going on to say, ‘None of these measures indicate a bear market is near’. I mean, you can’t make this stuff up.
What’s the table above (yesterday’s close) say about what’s really going on?
At this point it’s obvious the media are not going to discuss the on-going bear market in biotech, SPBIO.
Doing so, would require some kind of investigation as to why? That would open Pandora’s box and have everyone digging for truth … something to be avoided (censured) at all costs.
Amateurs always want (need) to know why.
Livermore was never concerned with the why. He looked for ‘what’. What is the price action doing now or what is it likely to do.
As Wyckoff said, ‘the why always comes out later … after the fact’
‘Why’ is a useless trading strategy.
However, in the case of biotech, we can take a good guess what the ‘why’ is all about.
Fall and Winter are very close now. As this interview with Stew Peters reveals, Fall and Winter are when we get the real picture of ‘side effects’.
Biotech is ahead of the pack on the downside and for good reason.
Positioning:
Positions have not changed except for additions of LABD as SPBIO declines and LABD heads higher (not advice, not a recommendation).
As a reminder, this site’s not interested in day trading or even swing trading unless that’s all the market offers.
No, we’re interested in positioning strategically.
This type of trading is modeled after the host’s twenty-four years of experience with aircraft flight test and certification.
A typical project would take five to seven years to complete; have a near infinite number of complex stages along the way with each one a profession unto itself.
At this juncture, biotech may be poised for the largest implosion ever seen in market history.
Stay Tuned
Note: Posts on this site are for education purposes only. They provide one firm’s insight on the markets. Not investment advice. See additional disclaimer here.
I’ve never seen such an on-going event result in so many people using Biblical standards to ether describe the battle, or to say this could be it. We need to keep our lampstands ready.
Note: Posts on this site are for education purposes only. They provide one firm’s insight on the markets. Not investment advice. See additional disclaimer here.