Note: Posts on this site are for education purposes only. They provide one firm’s insight on the markets. Not investment advice. See additional disclaimer here.
Note: Posts on this site are for education purposes only. They provide one firm’s insight on the markets. Not investment advice. See additional disclaimer here.
Like something straight out of The Princess Bride, this morning’s Broadcom (AVGO) explosion, probably doesn’t mean what the ‘investing’ public thinks it means (not advice, not a recommendation).
The link above, tells us AVGO, has launched higher on a ‘bold A.I. forecast’.
A Forecast !!! … what maybe could, or might happen in the future, if nothing bad happens along the way, … maybe.
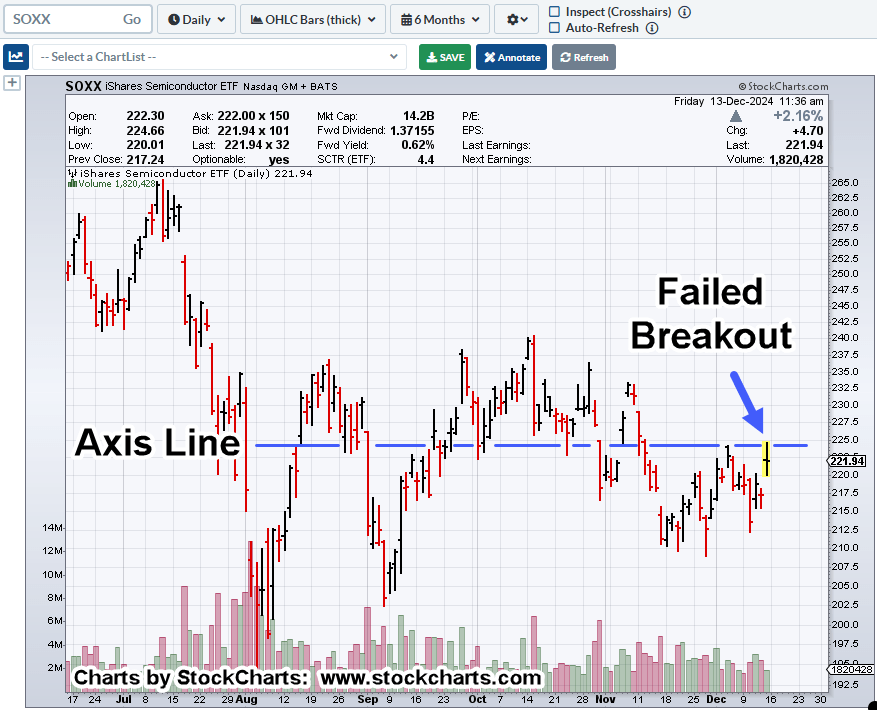
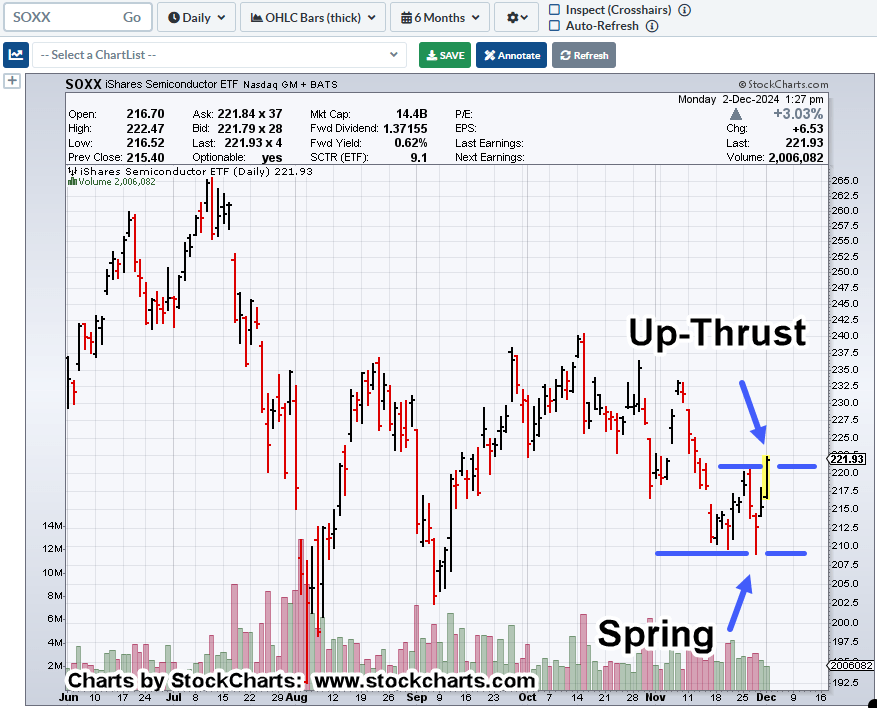
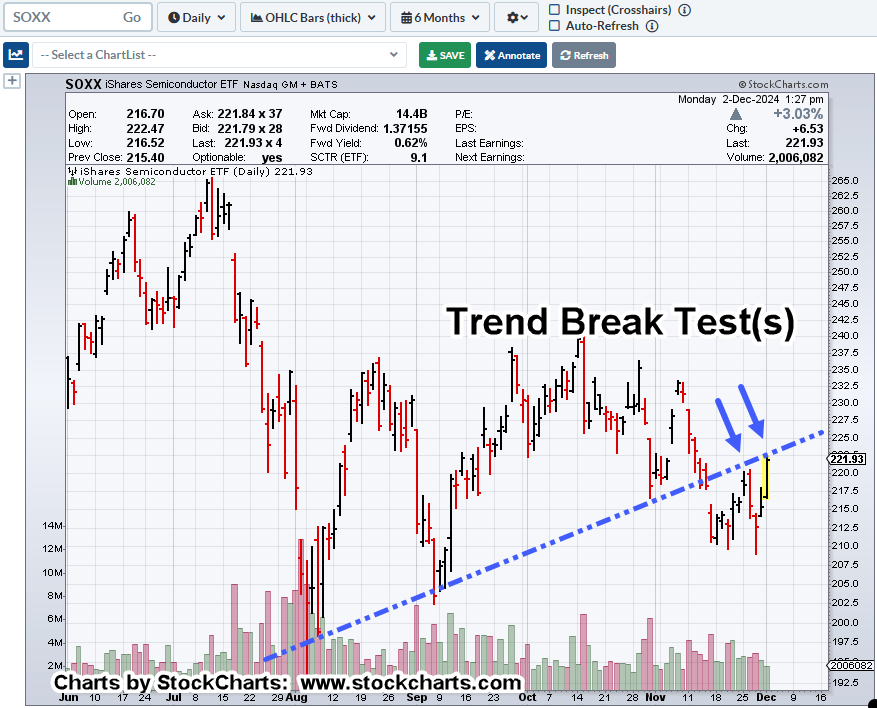
Well, let’s go to the sector itself, the SOXX, and see what the market’s really telling us.
Semiconductors, SOXX, Daily
The bubble trend break discussed here, remains intact.
Any number of notations can be made on this chart.
There’s a downtrend line from the October 15th high (not shown), with today, as the fourth hit on that line.
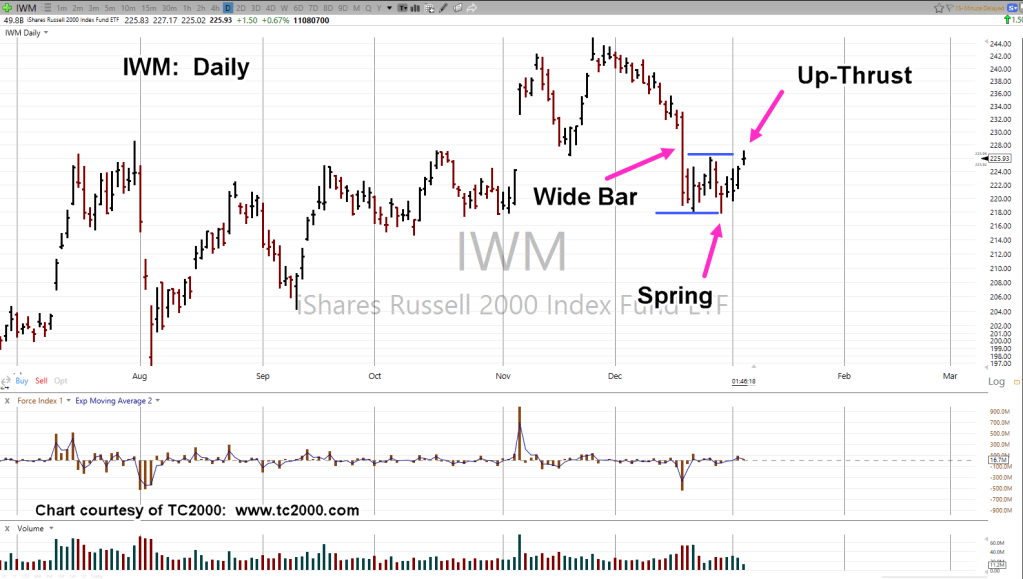
The low of November 27th, to today, could be classified as ‘spring-to-up-thrust’.
The list goes on.
However, the main point, and to leverage on yesterday’s update, is this:
If the building blocks of economic activity (Basic Materials) are in a (potential) long-term reversal, how are any of these so-called A.I. ‘data centers’ and the associated infrastructure going to be built?
Note: Posts on this site are for education purposes only. They provide one firm’s insight on the markets. Not investment advice. See additional disclaimer here.
Is a long-term, downside reversal in this sector, about to bubble to the surface?
With yesterday’s update, it’s easy to get lost in the hourly and daily maneuvers; see a likely (short-term) potential, while it just distracts from the bigger picture.
That ‘big picture’, is below.
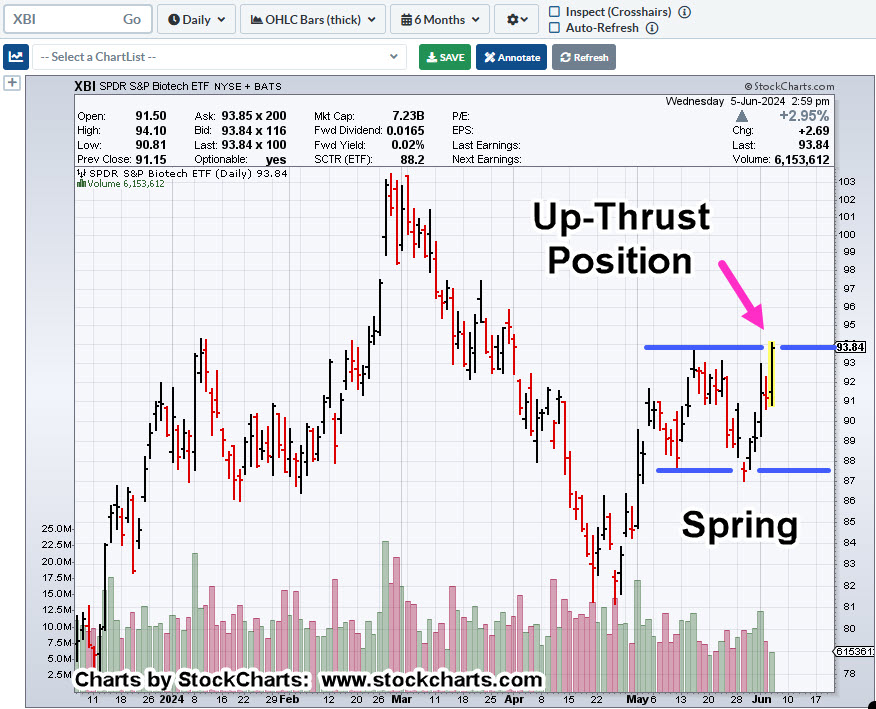
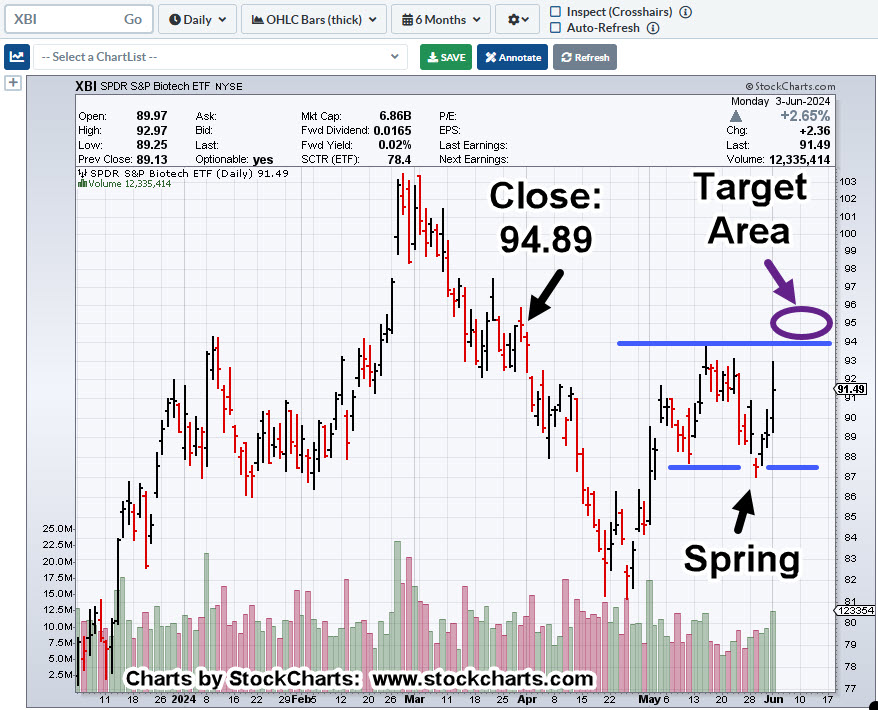
Once again, we have a (potential) repeating set-up: Wyckoff ‘Spring-to-Up-Thrust.
Biotech XBI, Weekly Close
With this week’s volatile action but lower overall close (from last week), the ‘up-thrust test may be complete (not advice, not a recommendation).
Note: Posts on this site are for education purposes only. They provide one firm’s insight on the markets. Not investment advice. See additional disclaimer here.
Note: Posts on this site are for education purposes only. They provide one firm’s insight on the markets. Not investment advice. See additional disclaimer here.
Note: Posts on this site are for education purposes only. They provide one firm’s insight on the markets. Not investment advice. See additional disclaimer here.
Note: Posts on this site are for education purposes only. They provide one firm’s insight on the markets. Not investment advice. See additional disclaimer here.
Note: Posts on this site are for education purposes only. They provide one firm’s insight on the markets. Not investment advice. See additional disclaimer here.
If it’s not behaving as expected, then it’s obviously doing something else.
In the case of biotech XBI, that something else, may be working its way to the next set-up.
Strategy First
Until price action proves otherwise, the overall long term reversal assessment of the sector has not changed (not advice, not a recommendation).
We’ve had a potential long-term up-thrust (reversal) that’s been covered here, and here.
That second link contains a 3-Day chart analysis.
Looking at the current price action and having it dictate what chart to use, we’ll switch to a 2-Day, which shows the potential more clearly.
Biotech XBI, 2-Day
The sector has failed to break below support in the 92 – 93, area. Instead, it has decided to bounce in what looks to be a possible minor spring-to-up-thrust.
We can see there’ve been two ‘hits’ on the upper resistance line. One, immediately after the up-thrust breakdown and one later … 4-bars later.
These hits essentially confirm the area, in effect, setting it up for potential penetration.
One has to think about where the stops are located.
If I was short this sector (I have been, but not currently), where would I place my stop?
Naturally, I’d put it right above the resistance (blue) line, exactly where everyone else has put theirs 🙂
Years ago, Martha Stokes wrote an update on why everybody gets stopped out of their trades, paraphrasing from this link:
‘The Market Makers don’t know you are there; they’re not interested in your tiny little stop order.
If your order does get taken out, it’s because too many small traders put their stops at the same location.
There’s an order imbalance. The market’s response is essentially automatic … take out the stops.’
With that, let’s see what happens next.
There’s no guarantee XBI, will penetrate the resistance area but if it does, we won’t be surprised.
Note: Posts on this site are for education purposes only. They provide one firm’s insight on the markets. Not investment advice. See additional disclaimer here.
How long have we heard incessant rants, gold and silver hyper-launch is imminent?
Sure, I like gold as much as the next guy. It feels good when you hear the ‘clink’ of real money in your hands.
However, one has to remain unbiased and look at what price action, the market is actually telling us.
Strategy First
Since December 2020, this site has proposed, we’re in a situation similar to Genesis 41; it’s the food supply first, then gold and silver (not advice, not a recommendation).
In this post (two years ago), an observation, ‘stackers’ may be forced to liquidate just to survive.
Now, we have this and this. On that second link, the comments tell the real story:
‘… people are selling their silver because they need cash.’
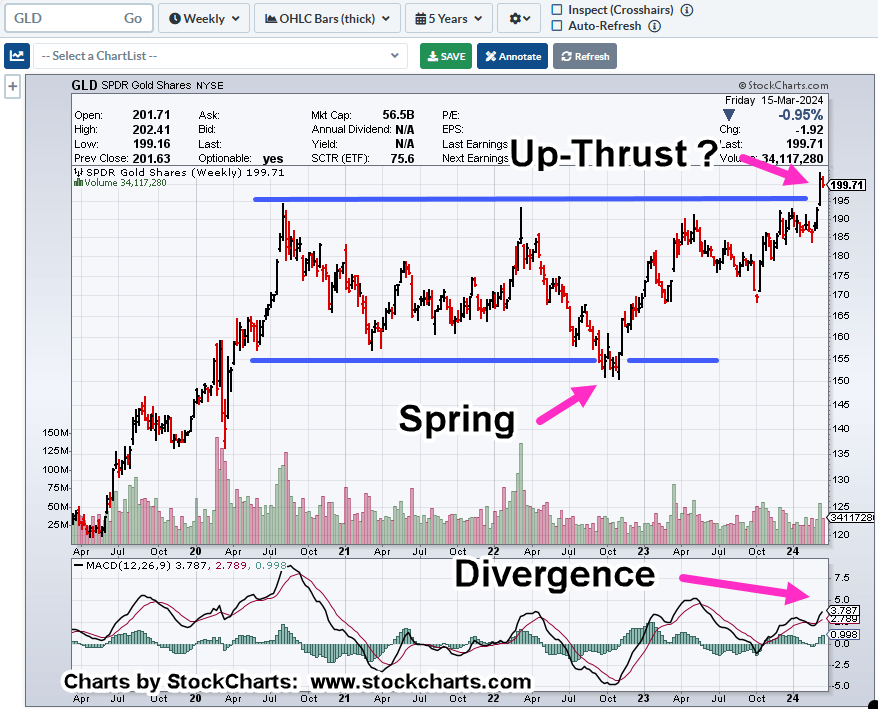
With that, let’s look at the chart of gold, GLD.
Gold GLD, Weekly Bar
We’ve seen it before, the set-up, The Danger Point®
Let’s add some insight to this picture, hidden in the chart; we have the following:
Look at how much time it’s taken GLD, to go from the bottom of the range to the top; longer each time and with less energy, shown by the decline in (upside) volume.
Longer & Less
Takes longer and less energy.
Still, that does not guarantee anything. Gold cold just keep on grinding higher.
However, probabilities suggest (the chart itself) we may be at or near, a pivot to the downside (not advice, not a recommendation).
Note: Posts on this site are for education purposes only. They provide one firm’s insight on the markets. Not investment advice. See additional disclaimer here.