Biotech Ready … For Reversal

Charts by StockCharts

Note:  Posts on this site are for education purposes only.  They provide one firm’s insight on the markets.  Not investment advice.  See additional disclaimer here.

DHI Bounce … Will It Hold?

Charts by StockCharts

Rates Rising … Miners Critical

Charts by StockCharts

Biotech Bellwether … CRSP

Charts by StockCharts

Note:  Posts on this site are for education purposes only.  They provide one firm’s insight on the markets.  Not investment advice.  See additional disclaimer here.

Set-Ups That Repeat

Charts by StockCharts

Note:  Posts on this site are for education purposes only.  They provide one firm’s insight on the markets.  Not investment advice.  See additional disclaimer here.

Market ‘Tests’ & ‘Instability’

Taking The Helm

‘We have assumed control …’

For the mining sector we’re about to find out if it’s bulls or bears.

With today’s overall (S&P, Dow, QQQ, etc.) down market and the press screaming in hysterical panic at the start of the day, you’d think the market had collapsed 50% or more.

The last update (over the weekend) had this to say about the S&P (emphasis added):

“So, here we are: The market (SPY) has rallied over the past week, giving the illusion that all is well.

However, it too is now in up-thrust (reversal) position.“

So, the SPY declines by just over 1%, everyone loses their head and starts talking about CBDC.

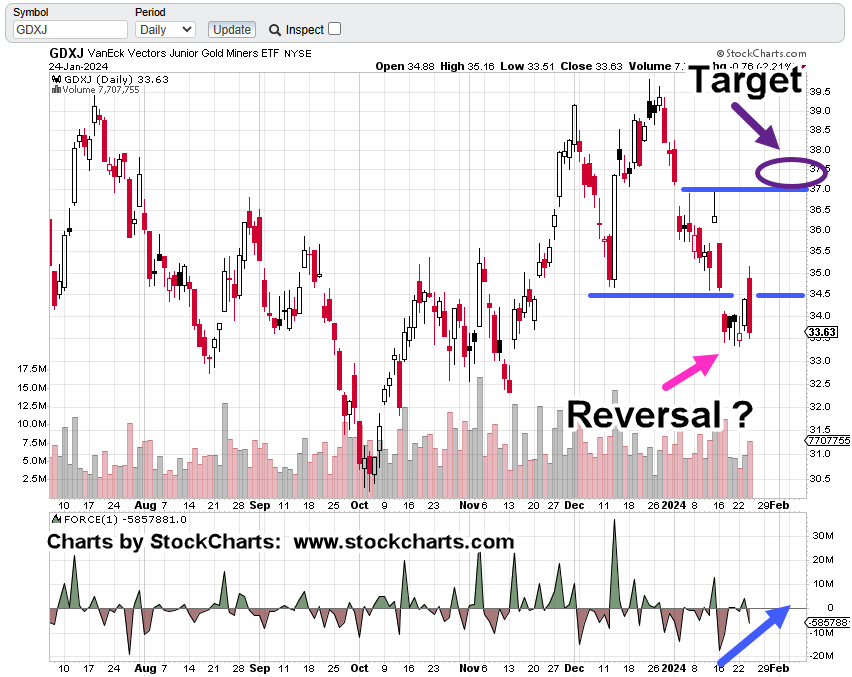
Moving on to the ‘knee-jerk’ sector for the day, let’s look at the miners and specifically GDXJ.

Junior Miners GDXJ, Daily Close

Admittedly, the prior update was unsure whether or not this sector had its up-thrust reversal ‘test’.

Well, now we know.

The chart above has all the Usual Suspects.

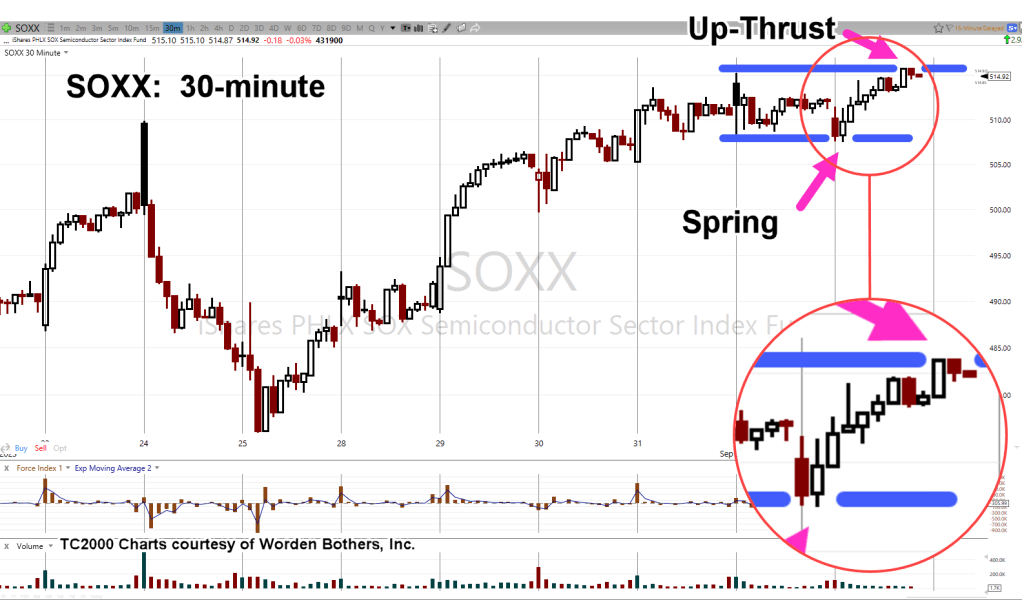
We see the spring to up-thrust repeating pattern.

Then, a steady decline from the up-thrust and today’s short-sharp test or as the late David Weis used to call it, a ‘gut check’.

At this point the market’s unstable.

We’ll know soon if somehow we’re on to new highs or if this was the last gasp of a bull move withing an overall, years-long, bear market.

Stay Tuned

Charts by StockCharts

Note:  Posts on this site are for education purposes only.  They provide one firm’s insight on the markets.  Not investment advice.  See additional disclaimer here.

The Danger Point®, trade mark: No. 6,505,279

Gold Miners … The Reversal

Each Peak Is Lower

Gold’s reversal or potential for reversal, has already been covered here, here and here.

We’re going to focus on the Junior Miners GDXJ but start first, with an updated chart of gold (GLD).

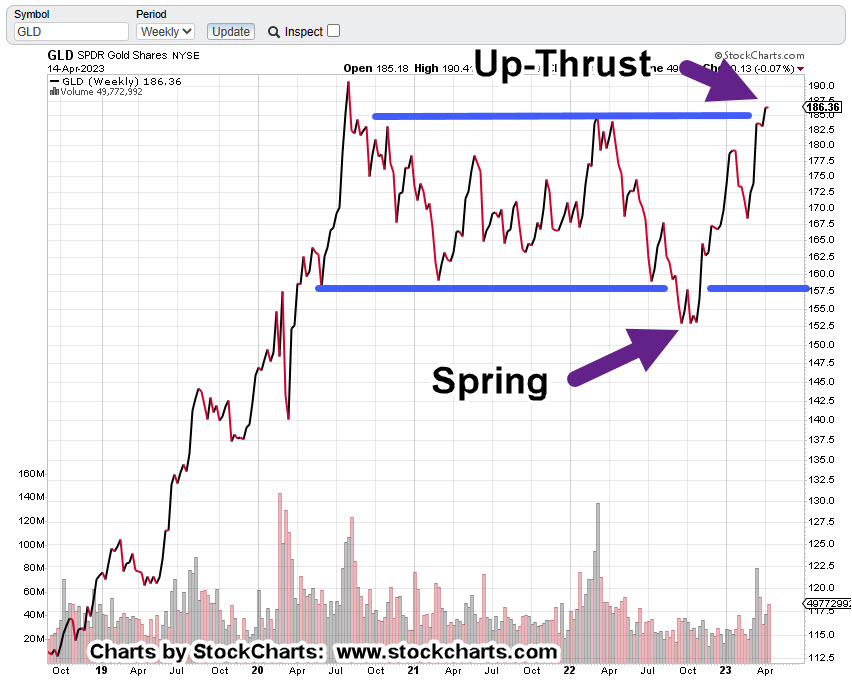
Gold GLD, Weekly Close

This is how it looked back on April 15th.

As of the close yesterday, we have this:

It’s arguable GLD, is now below the resistance line (completing the Spring-to-Up-Thrust) but that’s not the most important part from a trading standpoint.

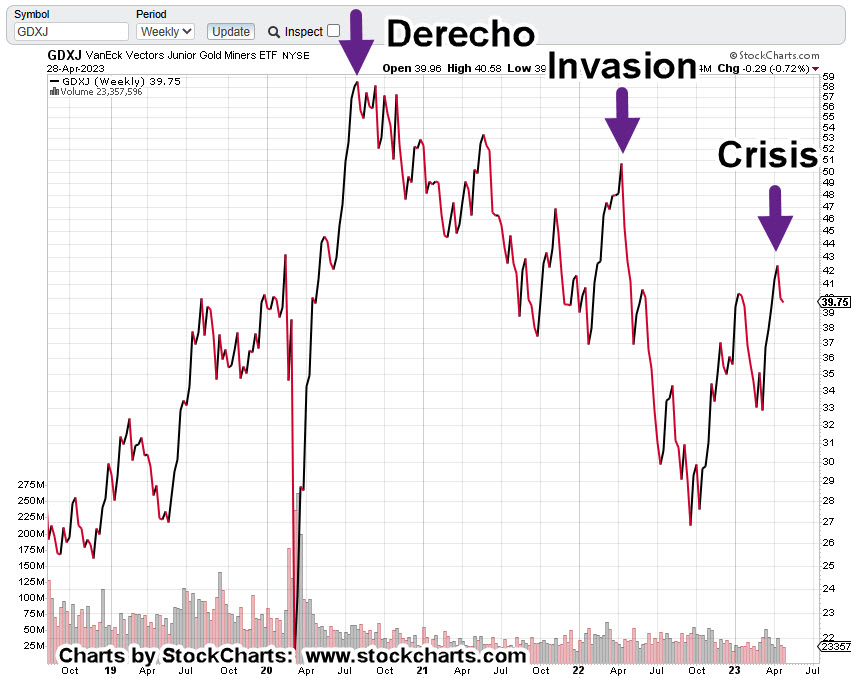
When looking at the Junior Mining Index GDXJ, there’s an ominous pattern.

Junior Miners GDXJ, Weekly Close

Each extreme peak over the last three-years has been labeled; the Derecho of 2020, the so-called Ukraine ‘invasion’, and now, the banking crisis.

Note: The SVB bank failure was on March 10th. There was a ‘knee-jerk’ reaction by the public into gold and related components … that peak appears to have stalled at the location shown.

What’s going on is obvious; it’s a bear market.

Each major peak, lower than the last.

Now, the interesting part.

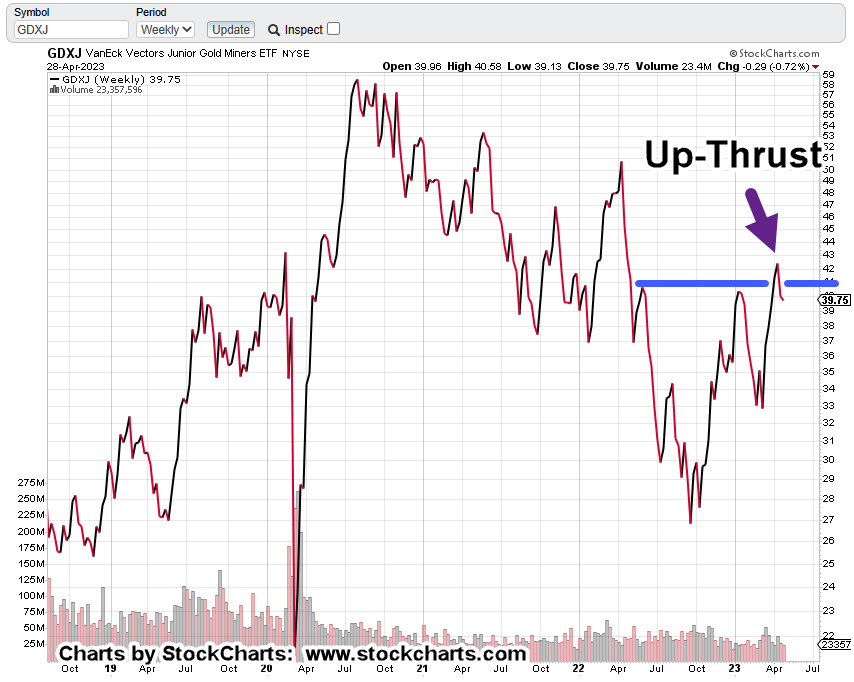
The Junior Miners are in Wycoff Up-Thrust condition.

In this case, price action’s solidly below the resistance line.

Looking at the daily (not shown), there may have been a ‘test’ of resistance this past week for a move higher; if so, it failed and GDXJ closed slightly lower.

Summary & Positioning

So, here we are: The market (SPY) has rallied over the past week, giving the illusion that all is well.

However, it too is now in up-thrust (reversal) position.

For my business accounts, it looks like being short the miners at this juncture is lower risk than being short biotech (not advice, not a recommendation).

Typical short vehicles that could be used (not a recommendation) are DUST and JDST.

As always, anything can happen. If the markets ‘implode’, they might be closed for any number of days or weeks.

Stay Tuned

Charts by StockCharts

Note:  Posts on this site are for education purposes only.  They provide one firm’s insight on the markets.  Not investment advice.  See additional disclaimer here.

The Danger Point®, trade mark: No. 6,505,279

‘Panic’ Into Gold … Reversal Risk

Gold Bulls Exhausted

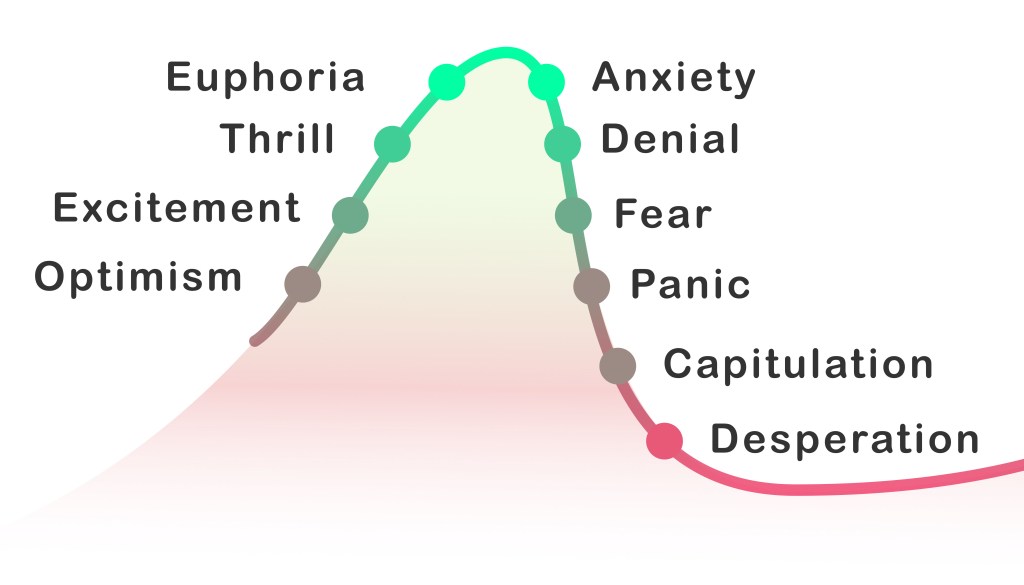
With Friday’s downside reversal we’re now between Euphoria and Anxiety for gold.

This past week was inundated with stories of panic at the bullion dealers.

YouTube ‘content creators’ were going berserk with hyper-inflationist rants; other ‘influencers’ telling us the dollar’s about to collapse; they say the Fed’s the only reason the dollar’s not at zero right now.

Then, rumors warning of gold to $5,000/oz. and higher.

The result as you would expect, is a highly emotional, manipulated public.

Different This Time?

At this point, whether or not the dollar will collapse is probably irrelevant.

Long time visitors to this site already know, battle lines (like here and here) are being drawn and it’s not in precious metals (not advice, not a recommendation).

As always, anything can happen and gold could go higher but with Friday’s reversal, probabilities have now shifted to the downside.

With that, we now have an ominous chart of gold below.

It shows the set-up to a repeating market characteristic:

Wyckoff ‘Spring to Up-Thrust’.

Gold (GLD) Weekly Close

Gold’s momentum wanes just as it’s pushing up through resistance.

Obviously, what happens next is the important part.

Strategy

Looking at the economic calendar for the coming week, there’s a Fed speaker every single day. If we’re really at a significant reversal, next week’s likely to put the panic into unsustainable overdrive and mark the top.

For the bulls, we’re looking for the GLD, highs to be maintained. If it can’t hold, there’s reversal trouble ahead.

A Reversal?

If this is the ‘big one’ and gold reverses, a likely (medium-term) target is in the area of $1,300/oz., – $1,350/oz. (not advice, not a recommendation).

If that happens, gold’s still expensive but it’s the mining sector GDX, GDXJ, that would potentially be devastated.

Both the Seniors and Juniors are already printing an MACD bearish divergence (not yet confirmed) when looking at the weekly charts.

Stay Tuned

Charts by StockCharts

Note:  Posts on this site are for education purposes only.  They provide one firm’s insight on the markets.  Not investment advice.  See additional disclaimer here.

The Danger Point®, trade mark: No. 6,505,279
Gold … The ‘Bubble’ Wins

At Least, For Now

The rabid gold bulls … foiled again.

From the last update (emphasis added):

“Gold (GLD) either reverses from here or moves slightly higher to the 187.50-area before reversing.”

Immediate reversal is exactly what happened.

Actually, gold did go higher to the targeted (GLD 187.50) area in the overnight session; then reversed before the regular session open.

So, it did both of the forecasted moves. 🙂

The ‘Real’ Unemployment

By now, anyone with two pension-plans rubbing together, knows the numbers … that is, any ‘official’ numbers are complete propaganda (not advice, not a recommendation).

For example, the ‘real’ unemployment here, is likely closer to 25%, rather than the ‘official’ level below 4%.

Keep that in mind, as we continue on.

Gold GLD, Weekly

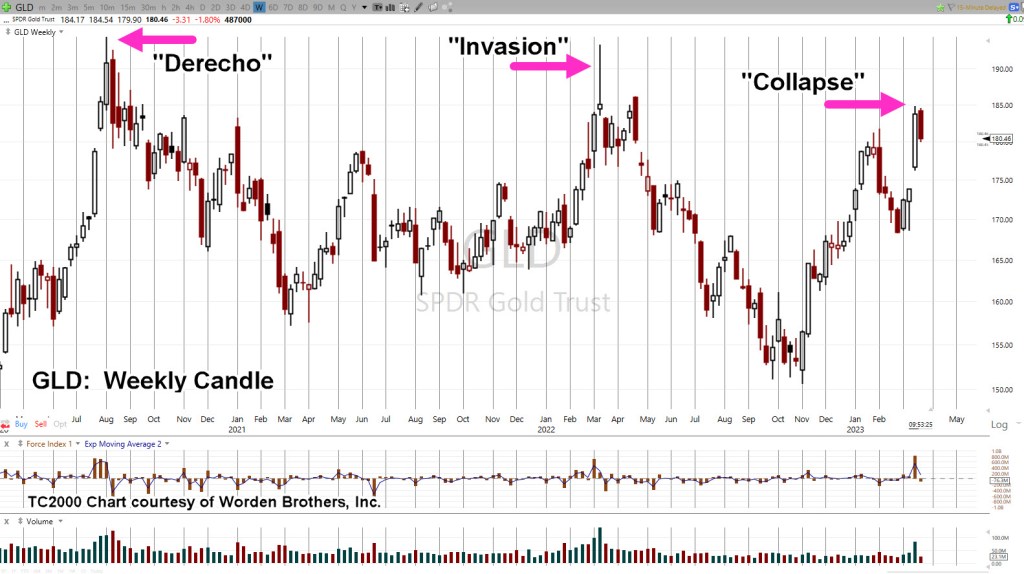
The GLD, weekly has the three major tops with the current (potential) one included.

The second chart (the daily) focuses on the reversal; in technical terms a ‘Wyckoff Up-Thrust‘.

Gold GLD, Daily

Right now, we’re at the test or The Danger Point®; it won’t take much force to move price action either way.

Pointing probabilities to the downside, we have a repeating pattern of ‘Spring to Up-Thrust’.

It’s an observed empirical phenomenon, markets tend to go from a Wyckoff ‘spring’, straight into an ‘up-thrust’.

The New ‘Paradigm’

Well, we probably to have a new paradigm but it’s not in gold (not advice, not a recommendation).

That new paradigm is what no one will discuss.

In the opinion of this author and contrary to what is presented here and here (remember our ‘unemployment’ numbers) we’re in a full-scale demand and population collapse.

The ‘inflation’ for possibly a large part, has been manufactured.

You can’t have over one-hundred food processing plants mysteriously burn down (bug, insect factories not affected) with millions upon millions of egg laying hens destroyed, cattle herd at 1962, lows and not affect the price.

For whatever reason, the mainstream has decided to reveal to the masses what’s been known for years to those who are awake.

Of special interest, Tucker Carlson interview, linked here.

Going Forward

Gold’s at The Danger Point®.

If it can’t make it higher from here on so much apparent and ‘rampant’ inflation, there’s a real risk of it being affected by some kind of Sovereign default … somewhere.

A default would potentially lead to a massive asset sell-off; including everything that’s not nailed down … i.e., gold.

Stay Tuned

Charts by StockCharts

Note:  Posts on this site are for education purposes only.  They provide one firm’s insight on the markets.  Not investment advice.  See additional disclaimer here.

The Danger Point®, trade mark: No. 6,505,279
Gold … Bubble or Breakout ?

We’re About To Find Out

As this post is being created the Credit Suisse battle, rages on.

Recent updates are here and here.

Of course, it’s all planned chaos … but that’s a discussion for another time.

The apparent response from gold (GLD) over the past week, was to move sharply higher.

As expected, the gold bulls are in their brain-stem mania.

Once again. It’s a ‘new paradigm‘.

With that, let’s not forget the last time we had a ‘new paradigm’. Gold has not been higher, since.

Trading opportunity? … Maybe.

New ‘Paradigm’? … Probably, not.

Different, This Time?

As we’ll see below, there are potentially two outcomes for the price of gold (not advice, not a recommendation).

First: Gold (GLD) either reverses from here or moves slightly higher to the 187.50-area before reversing.

… OR …

Second: GLD, pushes higher, just shy of the 200.00, mark, while getting itself into a Wyckoff up-thrust condition.

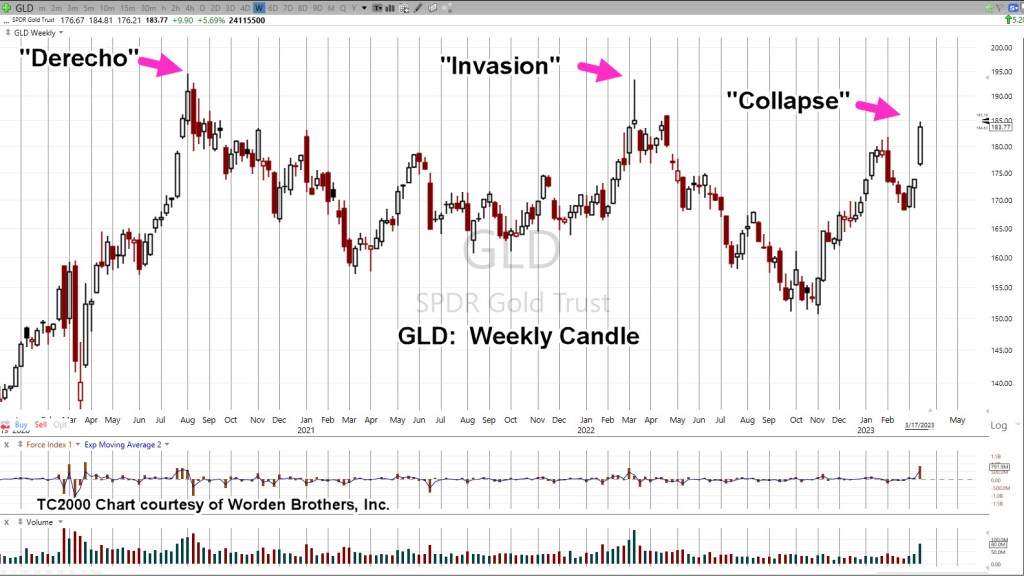
The first chart shows the extremes as of Friday’s close (Sunday futures, yet to open).

Gold GLD, Weekly

Concerted effort to destroy (or pollute) the food supply began with the Derecho. That effort continues to this day.

Secondly, we have the ‘invasion’ of Ukraine. Note the GLD spike is lower than the Derecho.

Now, we have the banking ‘collapse’. Once again (so far), the upward spike is lower than previous.

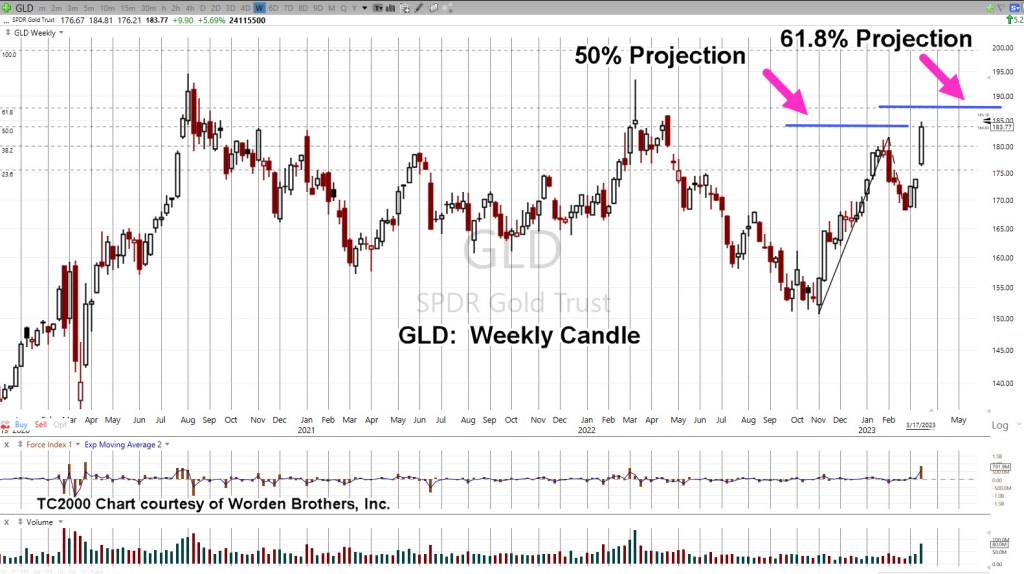
Looking at the second chart, we see a Fibonacci projection to 50%, the GLD 183.77-level; exactly where GLD, closed on Friday.

Empirical observation over many years has revealed, if price action gets to a 50% projected level, it’s typically on its way to higher levels.

A Lower Peak

Even if GLD moves up to the 61.8% projection as shown, the GLD 187.50-area, it’s still below the prior ‘Invasion’ peak set at GLD 193.30.

If GLD, moves significantly past these levels, then it’s likely on to new, all-time-highs and a potential Wyckoff Up-Thrust (reversal) condition.

If it happens, we’ll address it at that time.

Stay Tuned

Charts by StockCharts

Note:  Posts on this site are for education purposes only.  They provide one firm’s insight on the markets.  Not investment advice.  See additional disclaimer here.

The Danger Point®, trade mark: No. 6,505,279