Paradigm Shifts

We’re living in the surreal.
Only those who can ‘see’, understand it’s like something out of The Matrix.
The old paradigms no longer apply.
There is no ‘Pivot’
There never was a ‘pivot’; just like there never was a goal of 2% inflation, or full employment.
Way back in 1921, Jesse Livermore pegged it when he told Wyckoff, the whole premise of Wall Street, was to spread “deception”.
Deception is the key.
Attempting to figure out the next earnings release, the CPI or employment numbers, inflation, or what the Fed is likely to do, is to buy into the deception.
Following that deception, is the path of the amateur.
Meanwhile, back on the professional side; as early as 1909, Wyckoff discovered market prices move based on an energy and objective or their own … completely removed from any fundamentals.
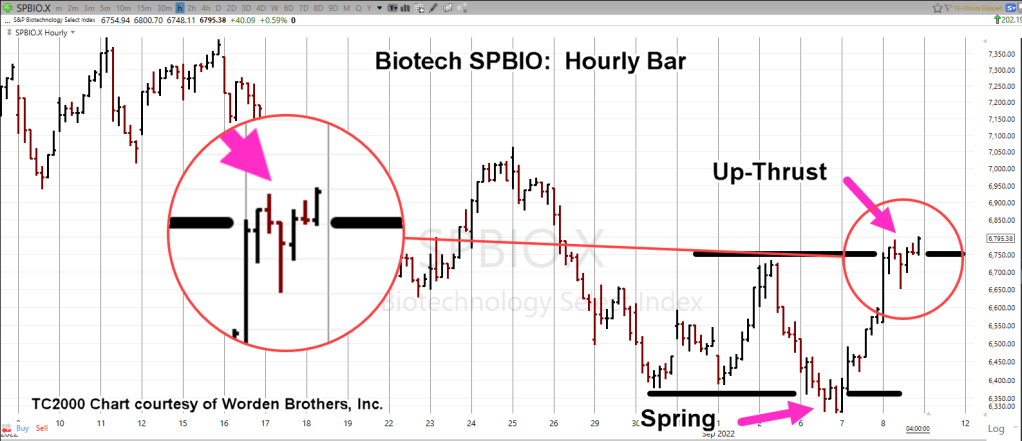
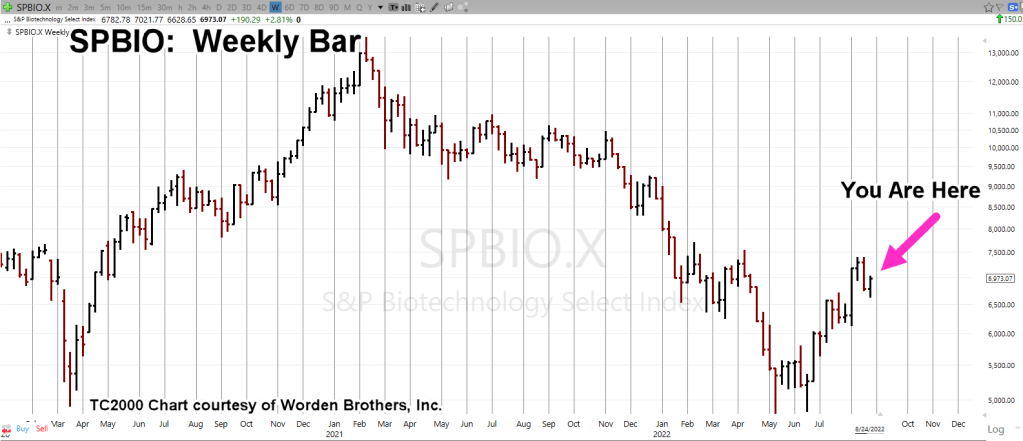
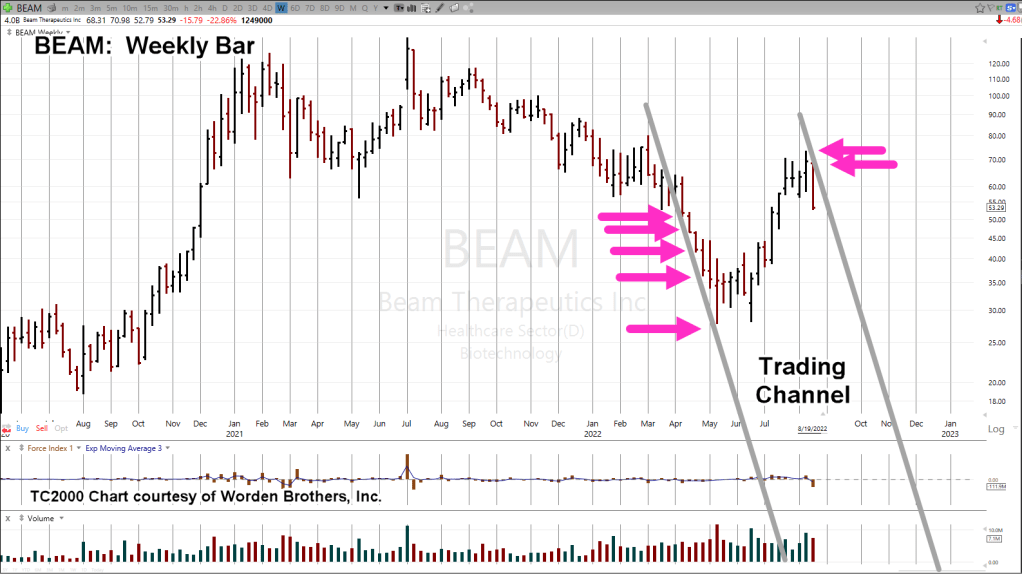
A few days ago, this update, discussed how biotech SPBIO, was potentially at a pivot point and ready to reverse lower.
Well, downside reversal is what we have.
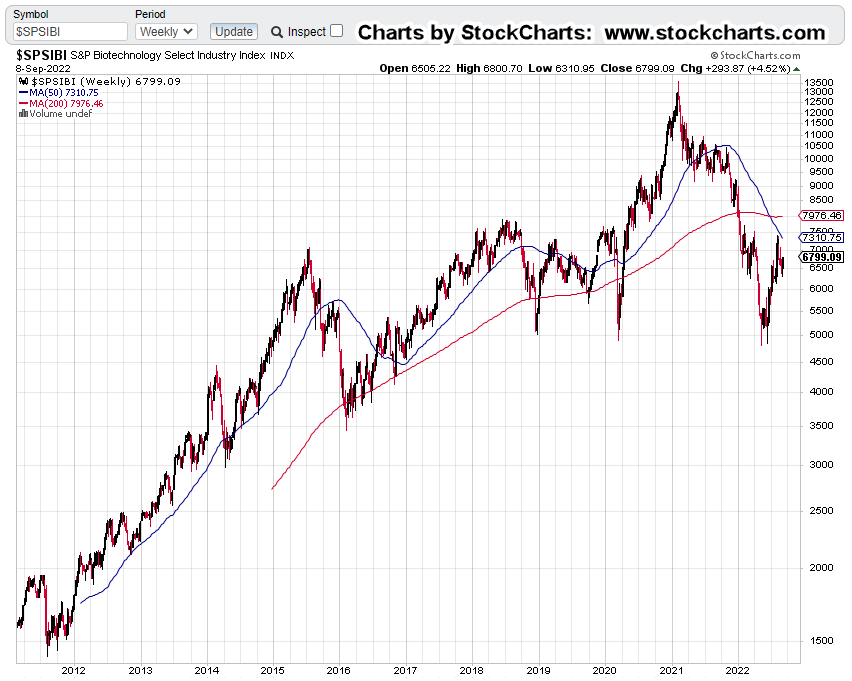
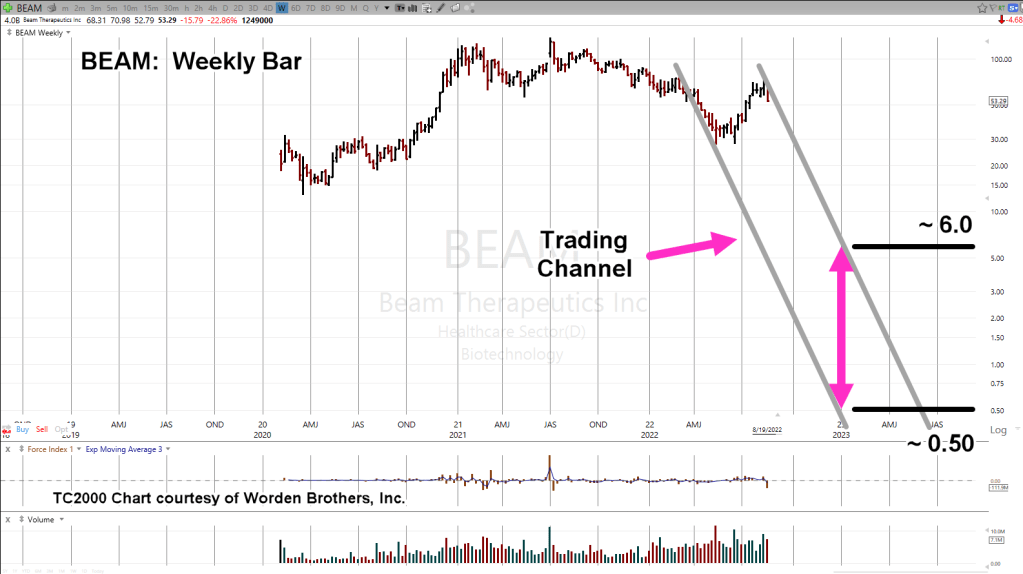
Biotech SPBIO, Weekly Close
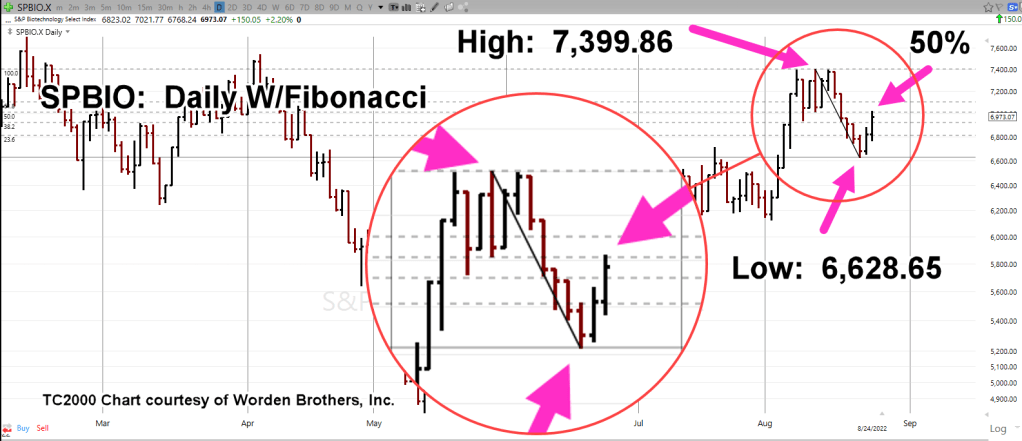
Even though we still have three trading days left, SPBIO, appears to be confirming the right-side trading channel.
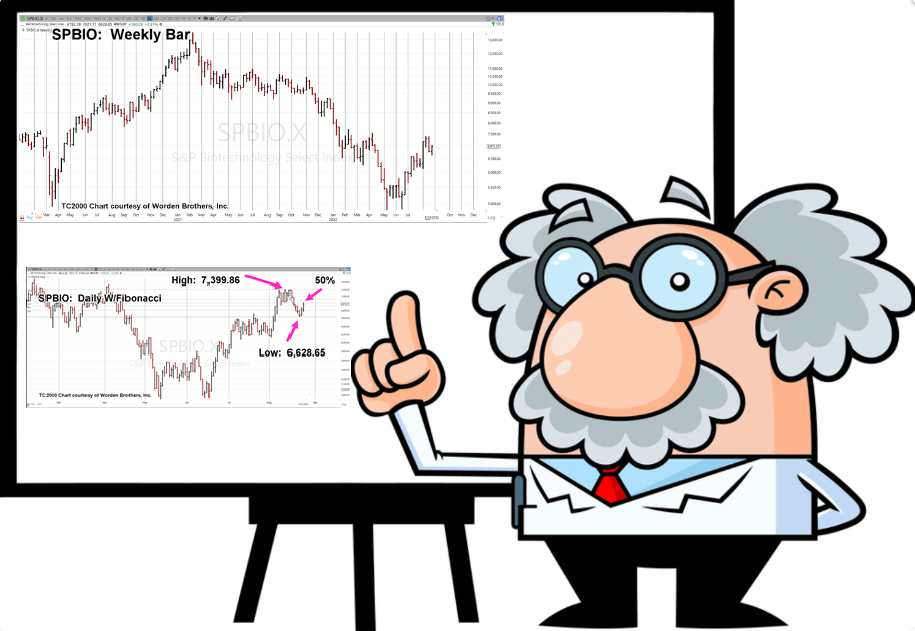
Last Week.
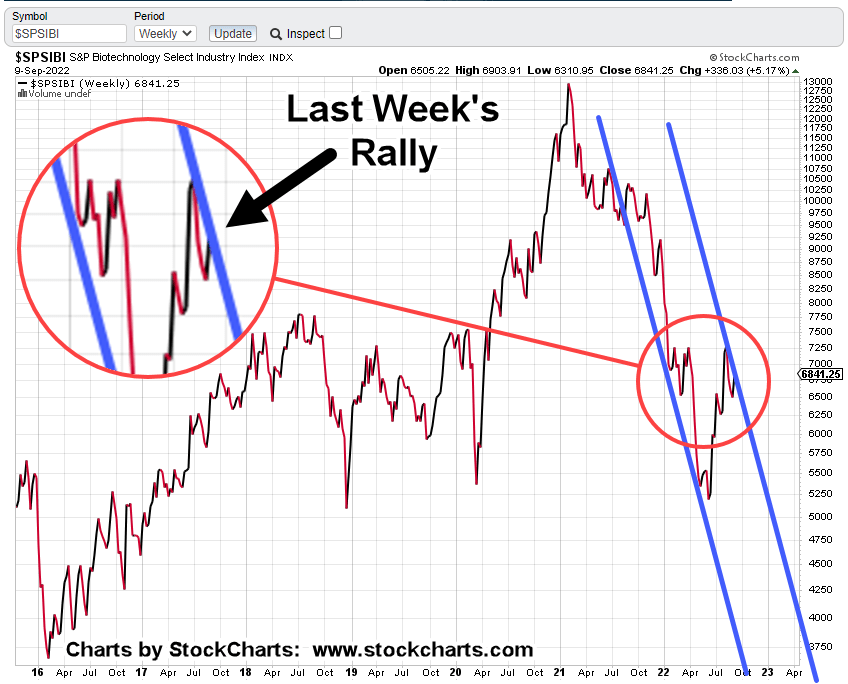
And … this week

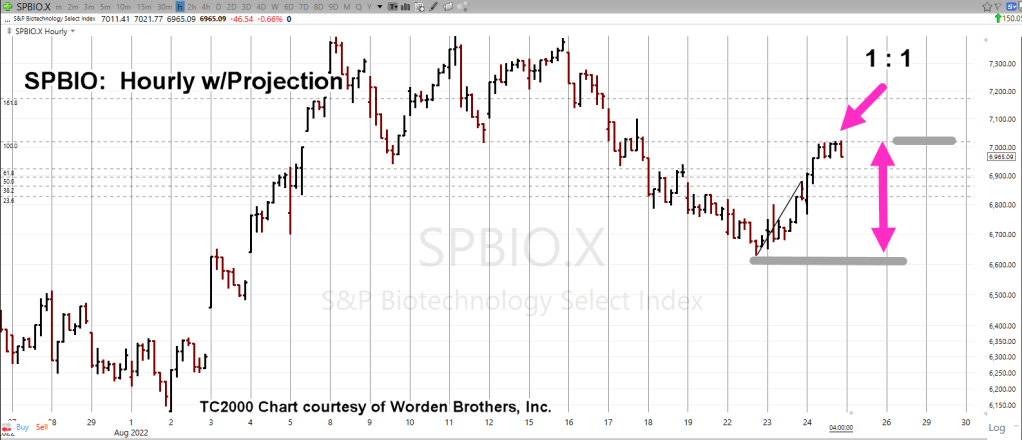
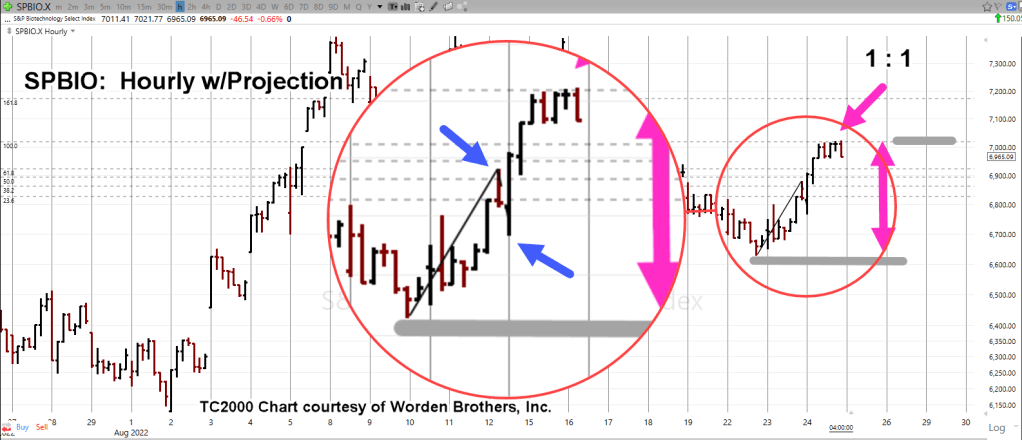
With the overall markets down sharply, events appear to be set in motion to continue downside action.
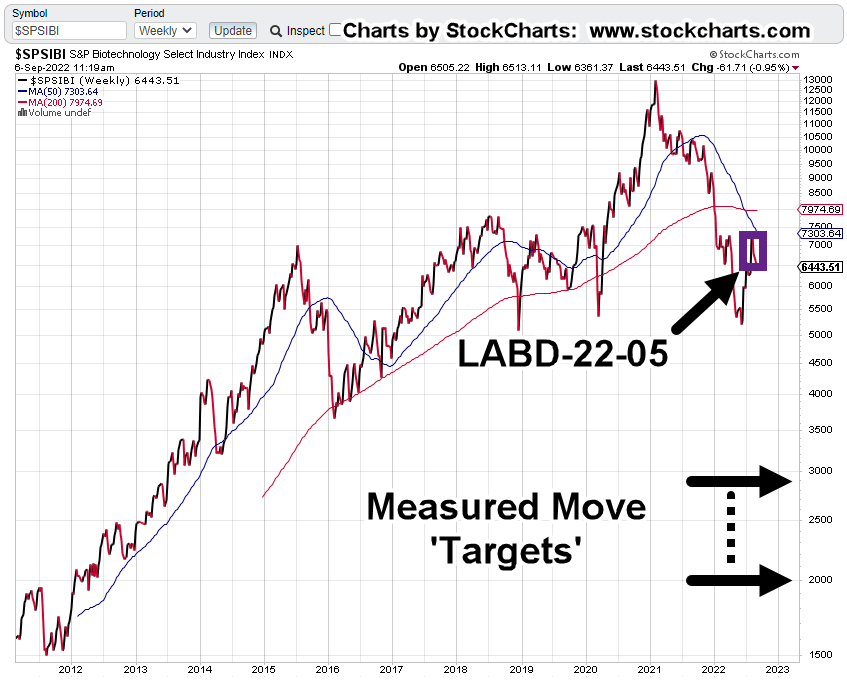
Summary:
As stated in prior updates, the current trade; LABD-22-05, was initiated in anticipation of a significant break lower (not advice, not a recommendation).
On the biotech fundamentals side (not that it matters), the wheels have come off.
The top weighted equities have no P/E … a decent conclusion may be the lower weightings don’t either.
Nobody’s making any money; rates are rising and we’re heading straight into an economic depression.
Stay Tuned
Charts by StockCharts
Note: Posts on this site are for education purposes only. They provide one firm’s insight on the markets. Not investment advice. See additional disclaimer here.
The Danger Point®, trade mark: No. 6,505,279