Nobody’s paying attention to this index. It may be one of the cleanest (technical) short opportunities.

Basic Materials. Sounds boring.
Sounds like fertilizer … and it is … right along with industrial chemicals.
Three largest cap in the sector are below:
Industrial gasses, Linde AG
Industrial gasses and chemicals, Air Products & Chemicals
Water purification, Ecolab
DuPont is next and then Newmont mining. So, this is a potential deflation play (Newmont) as well.
A post just out yesterday, Uneducated Economist does an excellent job destroying the inflation narrative.
Steven Van Metre has also repeated many times, we’re likely to get a deflation impulse first before inflation.
One of the most important things he’s said, the Fed is not going to correct the public’s (false narrative) perception that inflation’s the danger.
If everyone’s pointed in the wrong direction, and it serves their interests, why correct it?
Which brings us back to Basic Materials. ‘Nobody’s watching’ this index. How do we know?
Look at the inverse fund, SMN.
Russell 2000 inverse, TZA, averages 6 – 10 million shares per day. Compare that to SMN’s 2,500 shares on a good day.
Volume does pick up as price action becomes active. Some days will be 100,000 – 200,000 shares.
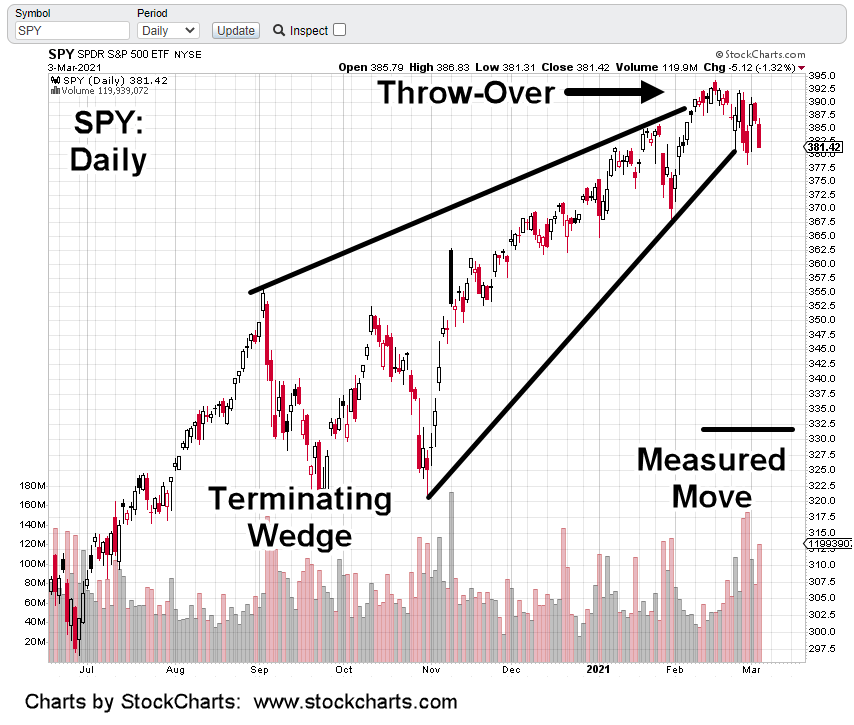
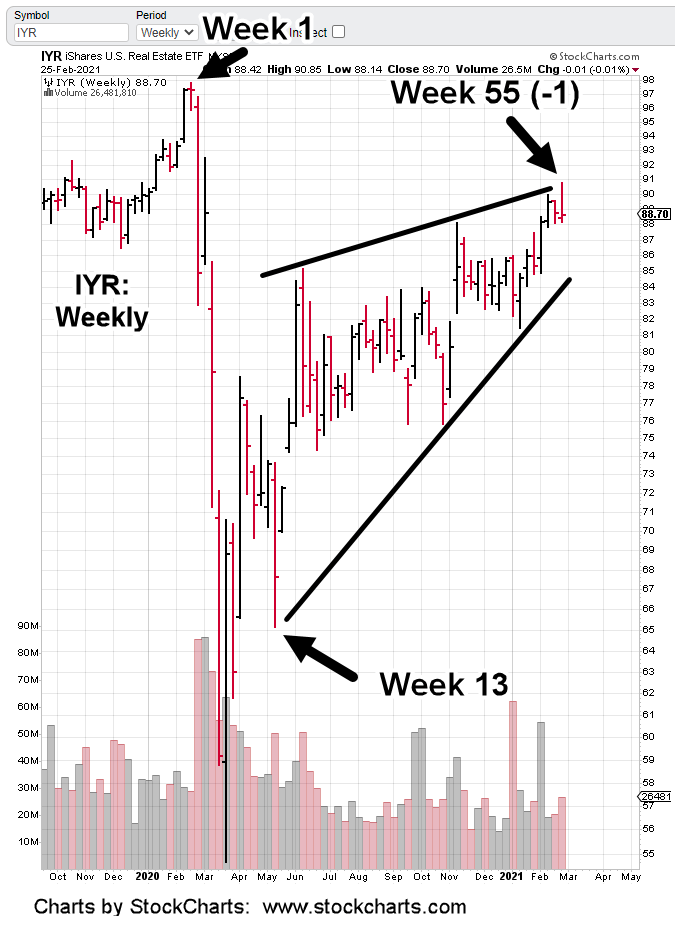
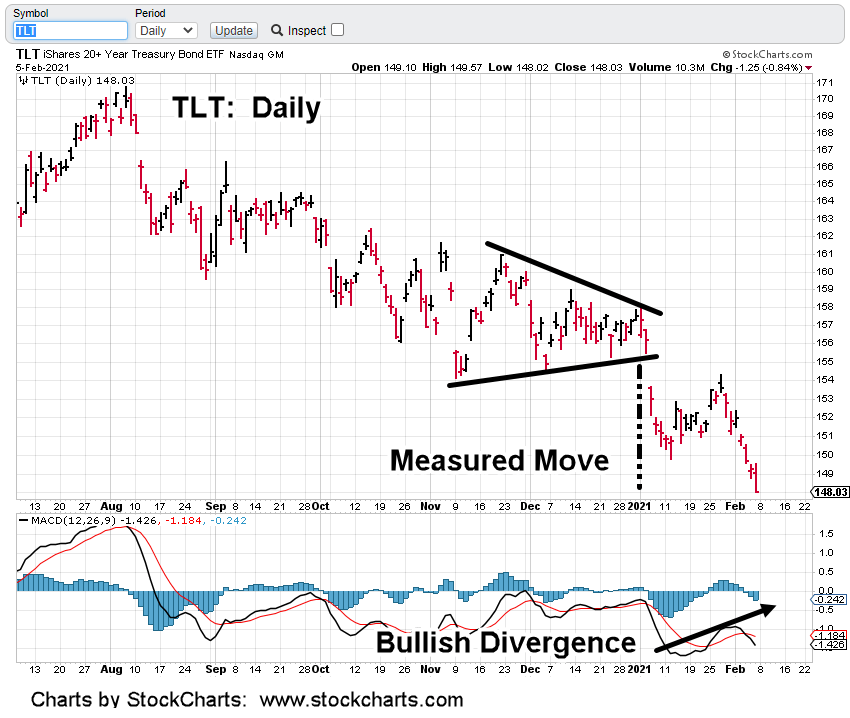
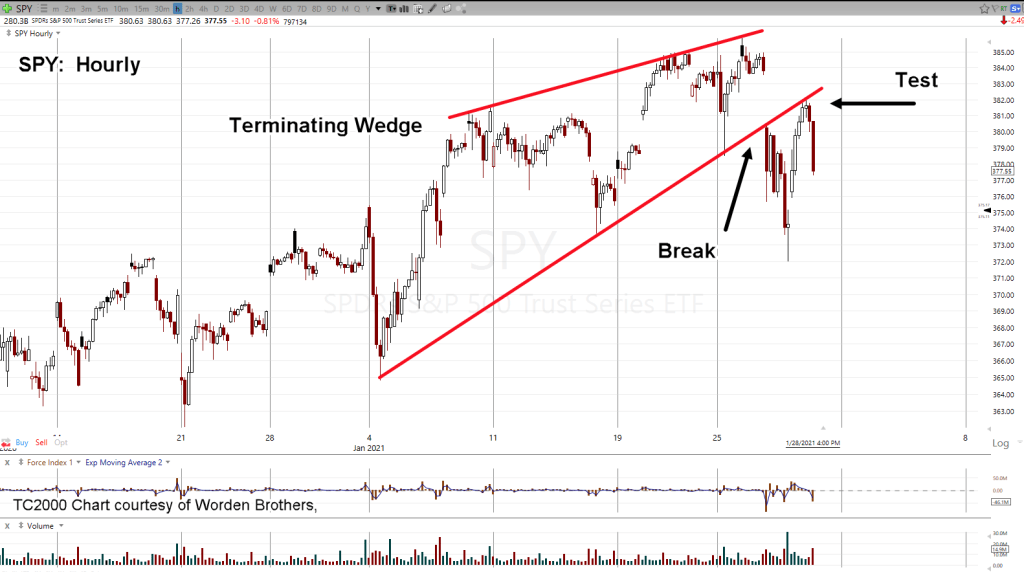
Looking at the technical condition, there are bearish divergences on both daily and weekly time-frames. The chart at the top shows a Wyckoff up-thrust (reversal) condition just tested yesterday.
The response is to go short via SMN (not advice, not a recommendation).
Since we’re actively managing accounts throughout the day, it’s not a problem to monitor SMN and the bid/ask of the fund when trading is light.

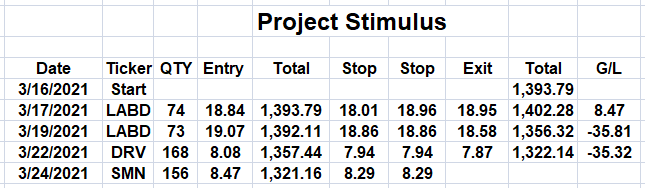
The ‘project’ table has been updated:
Pre-market has SPY trading down about -1.5 points or -0.40%. The expectation is for Basic Materials to follow suit.
Stay Tuned
Charts by StockCharts