Note: Posts on this site are for education purposes only. They provide one firm’s insight on the markets. Not investment advice. See additional disclaimer here.
Corporate Insiders Scramble To Buy Their Own Stock As Buyback Blackout Period Begins. Link here.
Last but not least, my personal favorite 🙂
Recession Canceled: US Industrial Production Jumps To Record High. Link here.
David Weis 1980s
Back in the 1980s, the late David Weis was a bond trader.
He published a series of trading articles using Wyckoff analysis; in one of those, this comment stood out (paraphrasing):
‘We considered none of these things …’
That is, stay focused on what the market is saying about itself. Ignore the press and any other distractions.
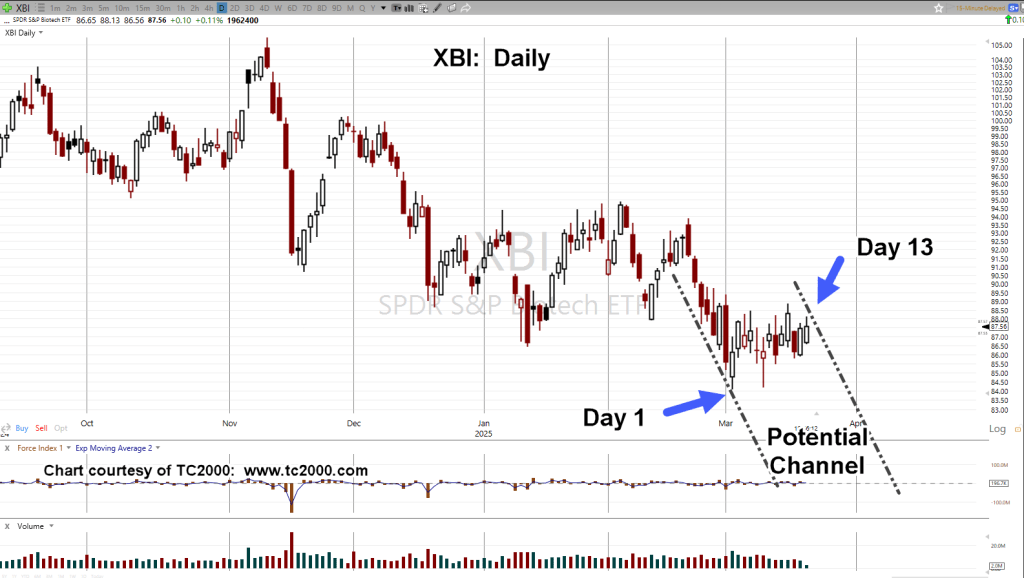
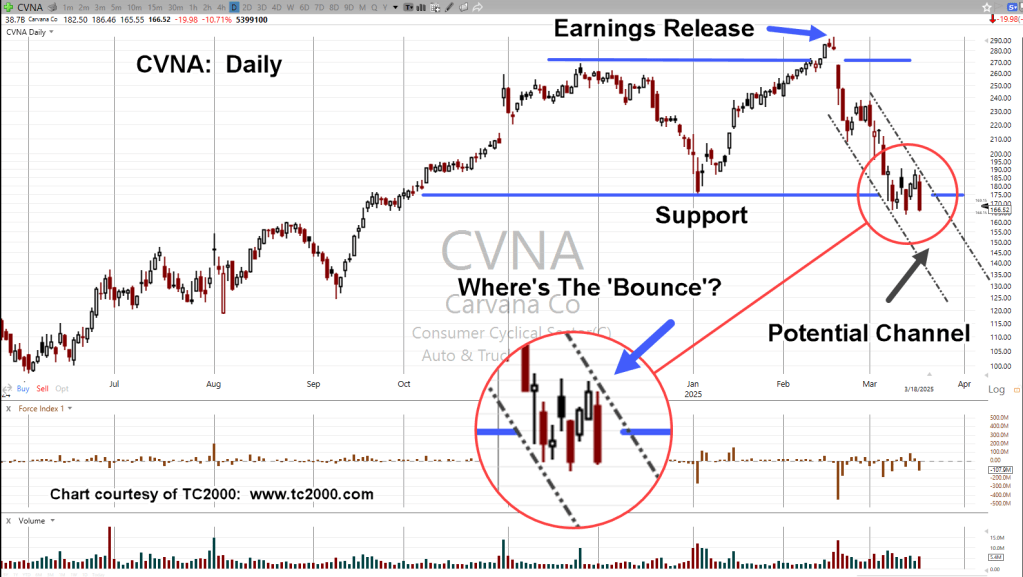
With that, we have Carvana.
Carvana CVNA, Daily
What can be said?
After penetrating support, some kind of bounce is expected … except, so far, it’s not happening.
This post is coming out before the regular open.
CVNA is trading a couple points higher (pre-market) but nowhere near the nearest 189-ish, resistance area.
The Fed has yet to announce their shenanigans for the day; that itself, could cause a bounce higher … or not.
While the press chases after squirrels and gold, the market itself (CVNA) is saying, if it can’t retrace higher but pivots down, it indicates significant weakness (not advice, not a recommendation).
Note: Posts on this site are for education purposes only. They provide one firm’s insight on the markets. Not investment advice. See additional disclaimer here.
We’re just hours away from the Sunday futures open.
Yesterday, military attacks on Houthi rebels have commenced; links here, here, and here.
Middle East conflict escalates.
The question is, will the markets see it that way?
Will it be ‘escalation’, with gold futures ever higher, or is it ‘buy the rumor, sell the news’?
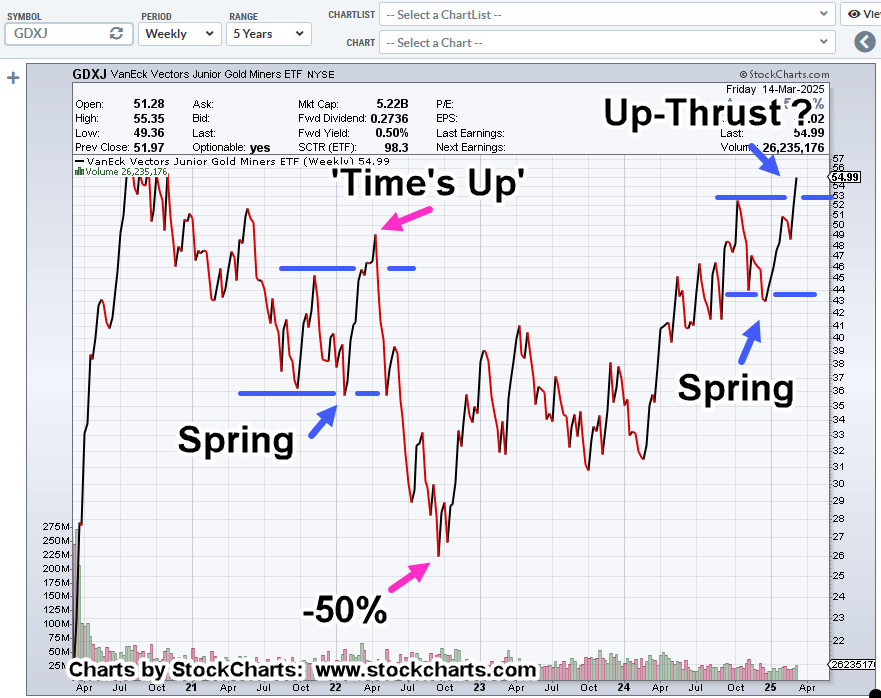
If we’re looking at potential gold/silver related downside, then let’s review the miners; they’ve been in a bear market for nearly five years (not advice, not a recommendation).
Junior Miners, GDXJ, Weekly Close
Before getting to the right side of the chart, let’s start with the ‘Time’s Up’, arrow; a reversal and decline over 50%.
At this point, gold and the miners appear to be stretched with silver currently in non-confirmation.
If it was really (simple) inflation, it would be like the 1980s, with both moving in tandem.
Then & Now
With that, what has GDXJ, done in the past?
The chart itself shows us it tends to exhibit a repeating pattern of Wyckoff ‘spring-to-up-thrust’.
We may know within hours if gold, silver, and the miners, are going to reverse or launch into some kind of extended rally (not advice, not a recommendation).
Note: Posts on this site are for education purposes only. They provide one firm’s insight on the markets. Not investment advice. See additional disclaimer here.
As of this post (12:35 p.m., EST), the miners GDXJ, have pushed above resistance area noted in yesterday’s update
Then, they stalled.
With a backdrop of gold in the news incessantly, is there a short trade at this juncture?
Whether or not this is the place to make the bet remains to be seen. However, what we can see, is a push above resistance (Wyckoff Up-Thrust) and a narrow range bar.
That means short-side risk has been reduced (not advice, not a recommendation).
Positioning
Short initiated via JDST, as JDST-25-03, with stop at the session low, currently JDST 19.93 (not advice, not a recommendation).
Note: Posts on this site are for education purposes only. They provide one firm’s insight on the markets. Not investment advice. See additional disclaimer here.
Note: Posts on this site are for education purposes only. They provide one firm’s insight on the markets. Not investment advice. See additional disclaimer here.
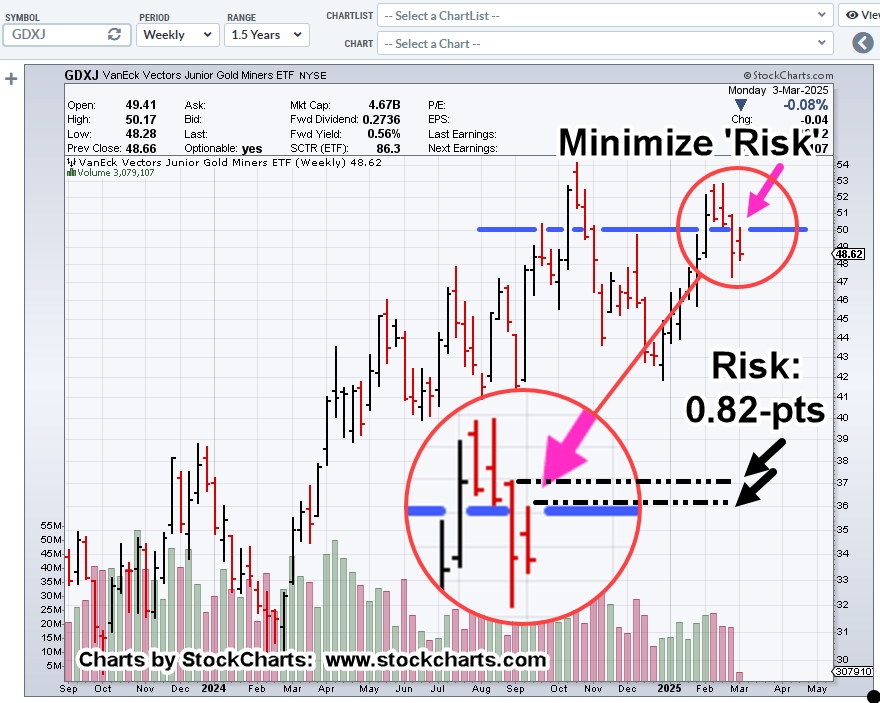
When you’re at price extremes whether up or down, many times the ultimate direction is unknown.
You’ll know when you’re at that (on-the-edge) spot, if it’s like Wyckoff’s description from over a century ago:
‘It’s as if the weight of a feather can move the market in either direction’
The good part, today’s potential-now-actual scenario, was previously covered in this update:
“What we’re looking for in the coming week (best case) is to see continued GDXJ, upside to close the distance to the resistance area; thus reduce (but not eliminate) the risk.”
Junior Miners, GDXJ, Weekly
Actually, the risk is probably less than the 0.82-pts shown.
Price action would need to continue through resistance (blue line) to get to the stop; possibly giving ample time to exit a short if so positioned (not advice, not a recommendation).
As can be seen in the side-bar, a short has already been opened; executed early in the session using leveraged inverse fund JDST.
Trade: JDST-25-02, with stop at today’s low (not advice, not a recommendation).
Against The ‘Spin’
Positioning short is against the current mainstream ‘spin’ on why this sector has not launched higher.
You’ve heard it before, they call it a ‘buying opportunity’
This site refers to the non-confirmation of the miners (with gold at all-time highs) as “something wrong” 🙂
Note: Posts on this site are for education purposes only. They provide one firm’s insight on the markets. Not investment advice. See additional disclaimer here.
That’s the current condition (as of 12:23 p.m., EST) of the SOXX.
When we look at the chart, penetration of a three-month support area is clear.
By definition, when support is penetrated, it puts the market in Wyckoff Spring condition; there will (typically) be some kind of attempt to rally.
That’s where we are now.
Semiconductors SOXX, Weekly
Note the black dashed trendline.
Research done on bubbles past, link here postulated at the break, the multi-year down leg begins (not advice, not a recommendation).
After the SOXX broke the trendline, it spent an incredible 10-weeks testing that break before reversing lower.
Positioning
From a price action standpoint, there’s nothing (yet) that says to exit a short position (not advice, not a recommendation).
Stated above, SOXX is technically in ‘spring’ position, ready to move higher.
With that in mind, the stop for SOXS-25-09, has or will be moved up to the session low; currently at SOXS 22.31 (not advice, not a recommendation).
Update: 1:39 p.m., EST: Price action expected to continue unabated (downward) after the first half of the session, now showing some buoyancy: Discretionary exit of SOXS-25-09, profit +14.2%
Note: Posts on this site are for education purposes only. They provide one firm’s insight on the markets. Not investment advice. See additional disclaimer here.
At the open, Nvidia came within 1-point of the target (61.8%), shown in the last update.
Then, it posted an outside-down bar within the first 25-minutes.
At this point (as of 11:28 a.m., EST), since yesterday’s low was penetrated, that puts NVDA, in a minor Wyckoff Spring condition, retracing some of the early session down move.
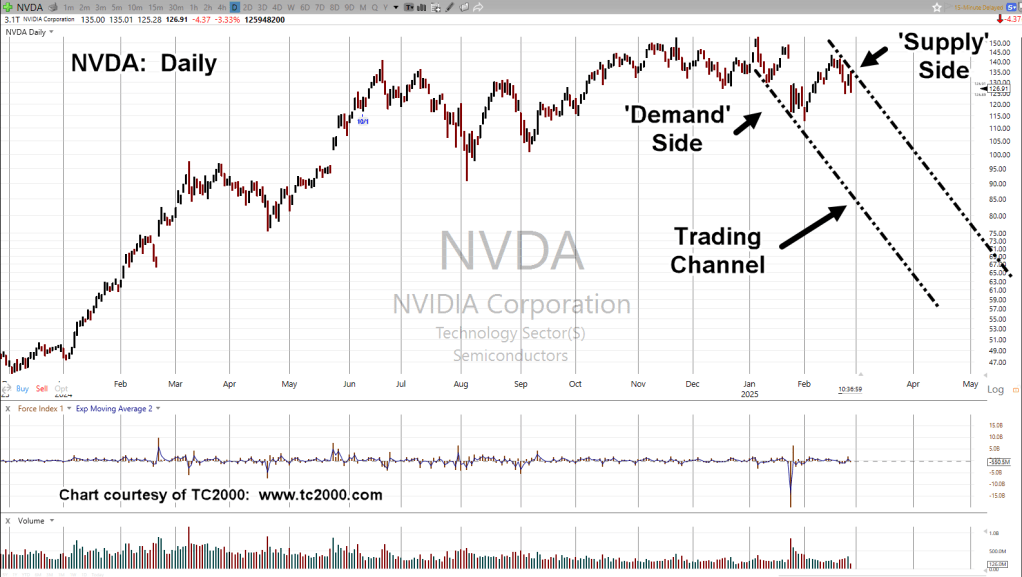
Nvidia NVDA, Daily
The chart has been compressed, showing events appear to be taking place on a massive scale.
If the trading channel is in-effect (i.e., correct), look how far down we have to go for the ‘demand’ side.
The press and pundits are either not ready for such a move or are deflecting from actual events, links here and here.
Looks like ‘good enough’ didn’t last long:
At the open, NVDA down, immediately.
Positioning
With all the coverage put on this equity and sector, ETF, the SOXX, trading actions are matter of fact.
The sidebar shows another short via SOXS, opened early in the session. Trade is SOXS-25-09 (not advice, not a recommendation).
Note: Posts on this site are for education purposes only. They provide one firm’s insight on the markets. Not investment advice. See additional disclaimer here.
The article at this link says the cancellation move was ‘unexpected’.
Clicking on ‘Artificial Intelligence’, (side-bar) and going back to August of ’23, with this post, then reading though subsequent posts, one can say the ‘cancellation’ was fully expected.
That August ’23, post has the link to Prechter’s analysis; we’re in the largest asset bubble in at least 300 years (not advice, not a recommendation).
All of that brings us to chief cook and bottle washer, Nvidia.
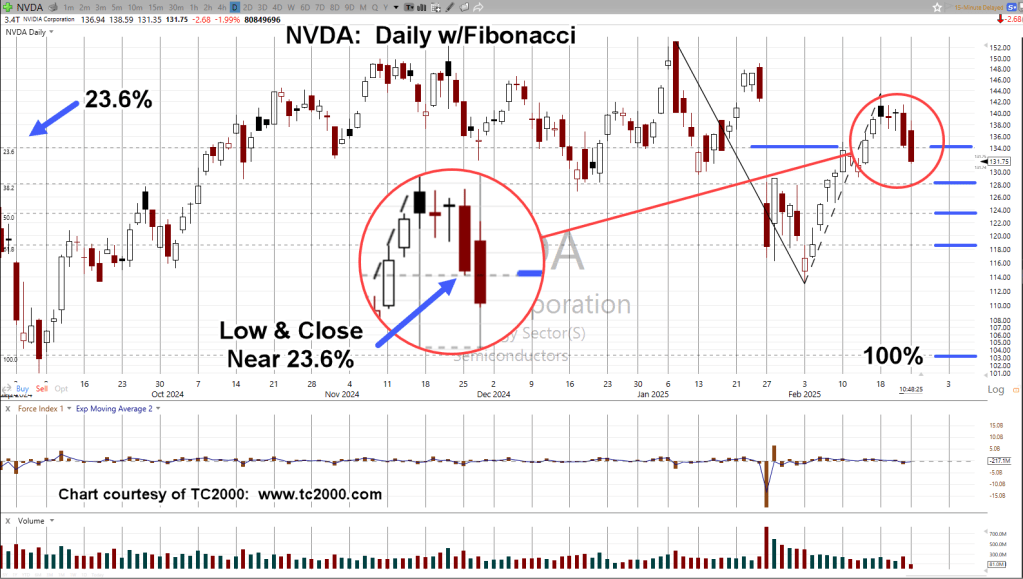
Nvidia NVDA, Daily
We’ll cut straight to the chase (as of 11:35 a.m., EST).
A Fibonacci projection is overlaid starting from the all-time-high (1/7/25), to the recent lows (2/3/25), back up to test (2/18/25), then reversal, again.
Note how last Friday’s price action printed and closed near the 23.6, Fibonacci projection.
Positioning
Everyone has their own preference and style.
As stated in the ‘About‘ section, this site works to emulate behaviors of the three masters listed.
That, in addition to the once-in-a-lifetime opportunity to have been mentored by the late David Weis, results in what’s available on this site.
With that said, positioning in the SOXX (the A.I. proxy) is short, via SOXS, as SOXS-25-08, initial entry link here (not advice, not a recommendation).
Note: SOXS-25-08, stop to be moved to the day’s session low; currently 18.58 (not advice, not a recommendation).
Note: Posts on this site are for education purposes only. They provide one firm’s insight on the markets. Not investment advice. See additional disclaimer here.
CORN had been moving steadily higher for nearly two years.
Using Wyckoff and Fibonacci, the (potential) top and retrace was identified one week before it actually happened.
The last update on CORN, with chart analysis was here.
Fast forward to this post; commodities pivoted, and appear to be moving higher in relative unison.
So, what happens now?
Teucrim Fund, CORN, Monthly
The ‘magenta’ arrow shows the location of the April post.
Moving on to the right-side, CORN held below support for seven months before pivoting higher.
If the labeling is correct, we have what looks to be a Wyckoff ‘spring’ set-up (not advice, not a recommendation).
That amount of time below support seems a bit of a stretch for labeling it as a ‘spring’.
Has that ever happened before?
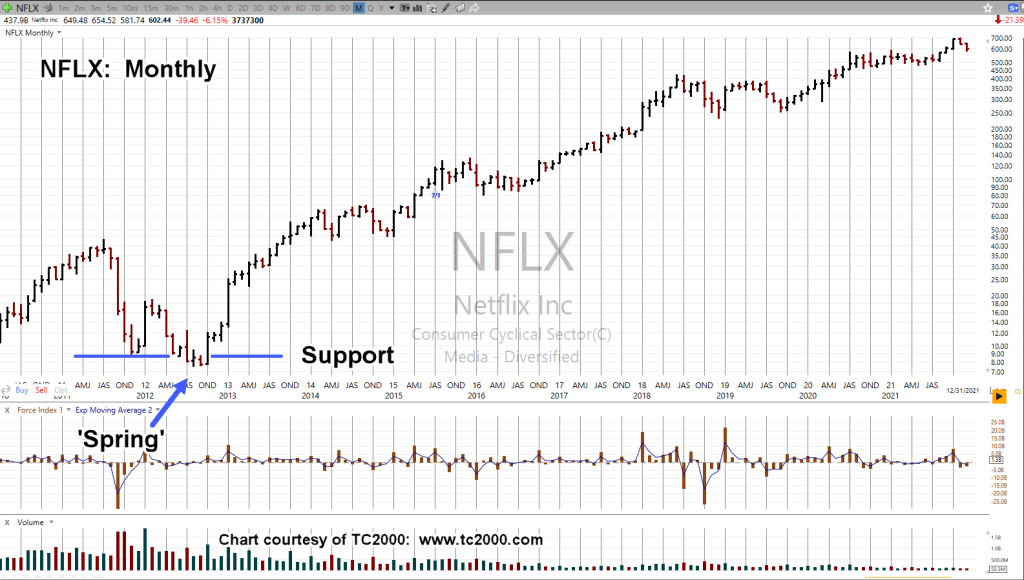
Case in point, Netflix
Netflix NFLX, Monthly
Depending on how it’s measured, back in 2012, NFLX, printed below support three-to-five months, before moving higher … in a big way.
With the chart of CORN, it’s unknown if we’ll get a ‘test’ of the breakout (purple oval).
At this point, there’s so much uncertainty in the financial markets as well as commodities, one needs to at least consider the possibility of a ‘test’.
Note: Posts on this site are for education purposes only. They provide one firm’s insight on the markets. Not investment advice. See additional disclaimer here.