How Far, How Long?

Two major hits to UnitedHealth (UNH), in the past four days, here and here.
Let’s throw in this one as well, and make it an even three, link here, website link here. Is that why the healthcare costs are going up unexpectedly?
The Wall Street Journal, UnitedHealth, and ZeroHedge, may have presented conditions for an interim low (not advice, not a recommendation).
The press is usually last and typically presents (these days, anyway) nothing new.
The price action itself, told us something was wrong.
United Health UNH, Daily
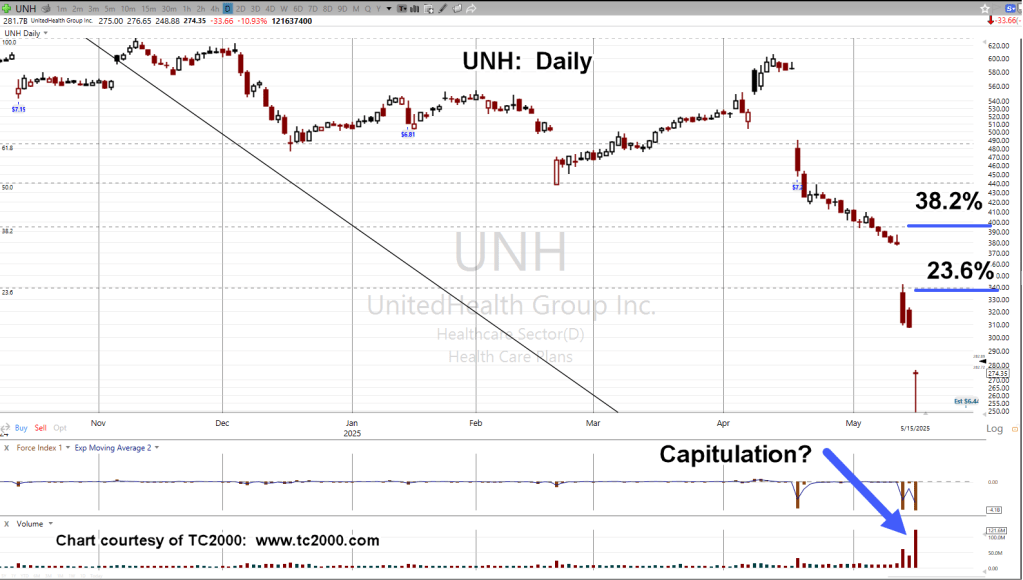
Massive, historic volume for UNH, may indicate a temporary bottom and retrace to test Fibonacci levels.
Separately, the XLV short XLV-25-03 was closed with 6.93% profit (not advice, not a recommendation).
Stay Tuned
Charts by StockCharts
Note: Posts on this site are for education purposes only. They provide one firm’s insight on the markets. Not investment advice. See additional disclaimer here.
The Danger Point®, trade mark: No. 6,505,279