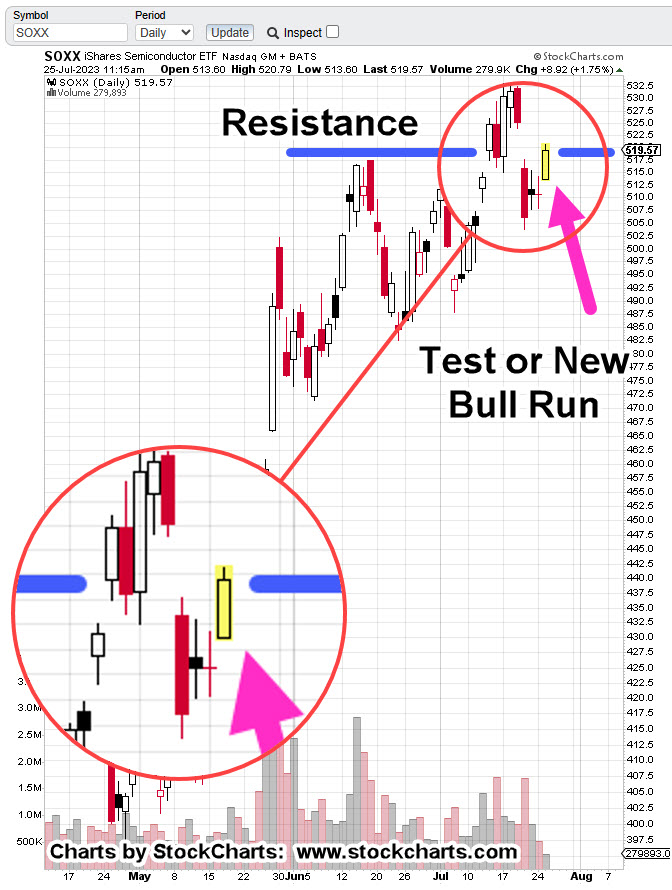
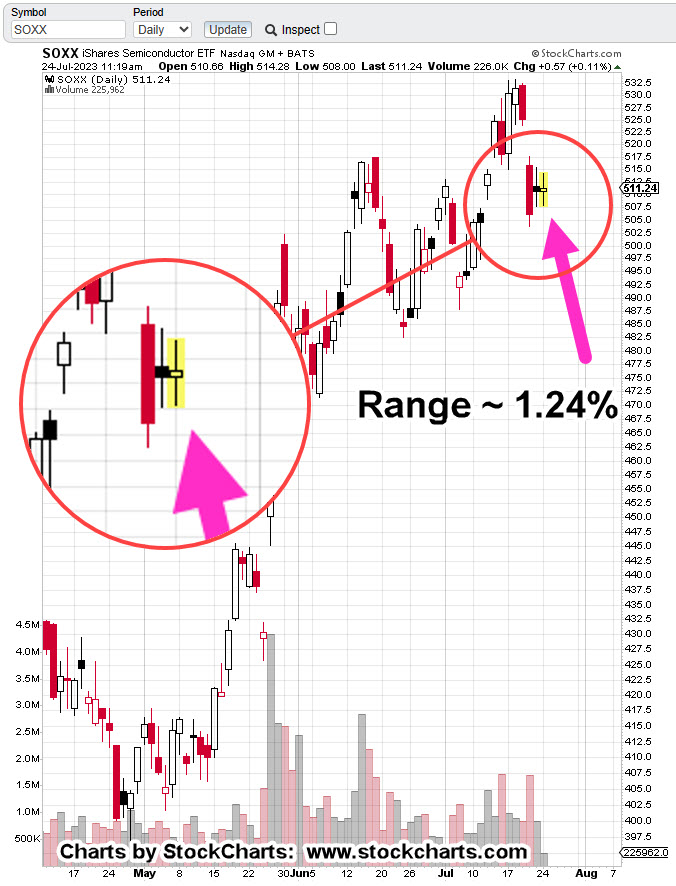
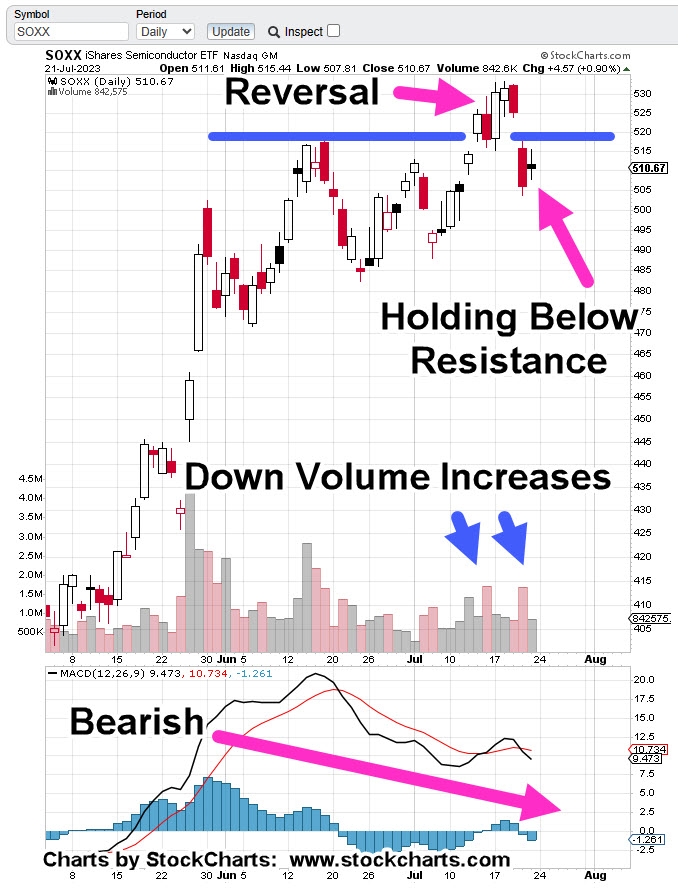
Hanging By A Thread … GDXJ

At The Next Open

If we’re at the downside pivot for gold and the miners, there’s only one right answer for the next market session.

That answer is:

Lower open, lower high, lower close.

Not advice, not a recommendation.

However, it is an assessment of where we are in the market cycle for gold and the miners.

The focus is on the Juniors GDXJ, as they are the weakest of both gold GLD, and the Seniors GDX.

If GDXJ, does not open lower, there’s something else happening; that would mean the downside reversal potential is in question and/or it could morph into more testing at the Axis Line, previously discussed.

Here’s a close-up of the sector.

Junior Miners GDXJ, Daily

Volume bar No. 1, corresponded with a solid up move for that session; shown as Price Bar No. 1.

Volume Bar No. 2, is where it gets interesting.

Specifically, higher volume, more narrow range (net distance) and a close well off the high.

Wyckoff called this: ‘effort vs. reward’.

Lots of effort (volume) with less reward (distance) than the previous move.

The next session confirmed that assessment by opening gap-down and then spending the entire day attempting to close higher … which did not happen.

That day (last Friday) may have been short covering. If so, we’re about to find out.

Junior Miners, GDXJ, Daily (forecast)

If we’re in a reversal (a big if), then we’ll get some variation of the price bar (black arrow) as shown (not advice, not a recommendation).

For the bearish option to remain intact, GDXJ needs to open lower and close lower for the day.

However, it does not need to post a new daily low, although that would help the case for more downside.

Anything other than what’s just described, would indicate a more complex price action environment.

If that happens, an update will be released.

Stay Tuned

Charts by StockCharts

Note:  Posts on this site are for education purposes only.  They provide one firm’s insight on the markets.  Not investment advice.  See additional disclaimer here.

The Danger Point®, trade mark: No. 6,505,279

Gold Bulls … Exhausted

The Volume Speaks

Nearly everyone expects gold to go higher; much higher.

You want ‘clicks’ on your website? Then talk about how gold’s going to the moon.

It’s an easy grift. Everybody’s doing it.

However, gold’s truth is in the price action, not the grift.

We’re going to look at that truth and more specifically, what gold’s (GLD) volume is telling us.

With full understanding that anything can happen, gold could go higher, there’s a case for a significant downside reversal (not advice, not a recommendation).

Gold GLD, Weekly

In Wyckoff analysis terms, volume is the energy behind the move. It’s the commitment … or lack thereof.

Last week’s volume is far below the prior spike high set during the ‘invasion’.

It’s down over 56% from the ‘invasion’ spike and down 26% from the most recent spike.

Demand, commitment and thrust energy, are backing away from the gold market.

Moving down to the daily, we see the net distance traveled with each significant thrust is shorter than the last.

Gold GLD, Daily Close

Wyckoff wrote about this observation a century ago when discussing how to spot the end (or absorption phase) of a move.

He called it ‘shortening of the thrust’.

So, there it is. The weekly chart shows each major volume spike is less than the last.

The daily close has net distance traveled less than the last.

Add in the mining sector’s GDXJ, posting its most recent peak four weeks ago (week ended April 10th).

Last week’s action in the Junior’s appeared to be an act of desperation by the bulls.

We’ll cover that sector in the next update.

Stay Tuned

Charts by StockCharts

Note:  Posts on this site are for education purposes only.  They provide one firm’s insight on the markets.  Not investment advice.  See additional disclaimer here.

The Danger Point®, trade mark: No. 6,505,279
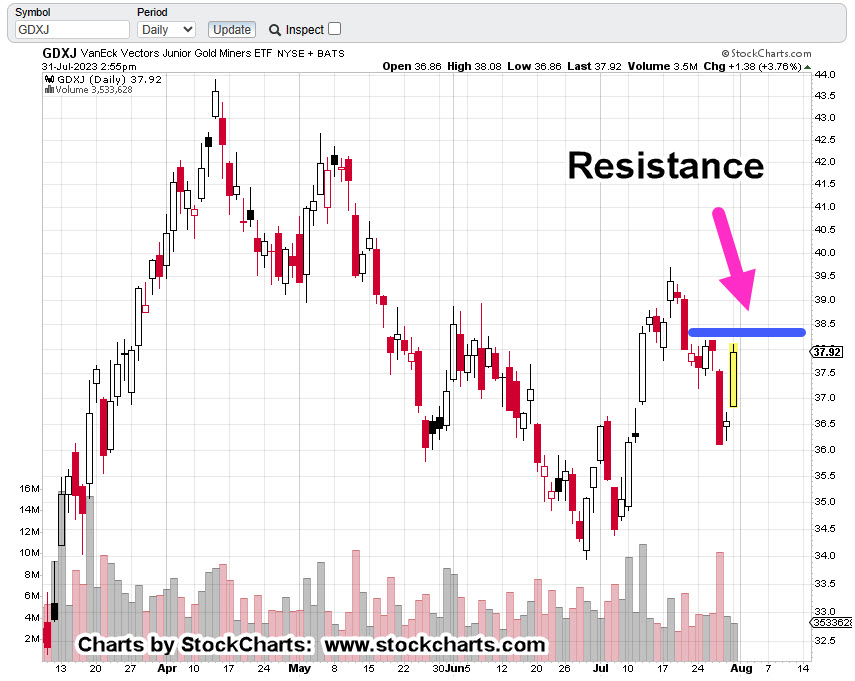
Do ‘Miners’ Lead The Metal ?

Looking Over The Past Year

Does the mining sector forecast the actual direction of precious metals; specifically, gold?

When looking over the past year, the short answer is yes.

We’ll look at the daily chart of the Junior Mining Sector GDXJ, below and show that each peak and reversal in gold, was preceded by a reversal in the mining sector (not advice, not a recommendation).

Junior Mining Sector GDXJ, Daily

Each ‘black arrow’ shown on the chart of GDXJ, is a peak or bottom and significant reversal in gold (GLD).

Over the past year, GDXJ reached its peak or bottom several days or several weeks before the actual metal.

The right-most arrow is blue … because we don’t know what’s going to happen next.

Pulling to a longer time frame (still using the daily), we see the GDXJ on a closing basis, is oscillating about an axis line that’s been in effect for three years.

Junior Mining Sector GDXJ, Daily Close

Until proven otherwise, we’re still in a test of the ‘Up-Thrust’.

Price action could somehow power its way higher (with higher gold prices) and move into some kind of bull move.

Or, as the chart implies, we’re at a potential inflection point with probabilities equally weighted but suggesting a slight hint to the downside.

Futures Market

Gold futures, GCM23, as of this post (10:25 p.m., EST), are drifting higher and curretly trading up about +0.05%.

Funny things tend to happen overnight in the futures markets. We’ll see if the upward bias holds to the next open or if downside pressure becomes apparent.

From a news standpoint, we have the employment report(s) before the open at 8:30 a.m.; the Fed speaks at 1:00 p.m.

Stay Tuned

Charts by StockCharts

Note:  Posts on this site are for education purposes only.  They provide one firm’s insight on the markets.  Not investment advice.  See additional disclaimer here.

The Danger Point®, trade mark: No. 6,505,279

Market ‘Tests’ & ‘Instability’

Taking The Helm

‘We have assumed control …’

For the mining sector we’re about to find out if it’s bulls or bears.

With today’s overall (S&P, Dow, QQQ, etc.) down market and the press screaming in hysterical panic at the start of the day, you’d think the market had collapsed 50% or more.

The last update (over the weekend) had this to say about the S&P (emphasis added):

“So, here we are: The market (SPY) has rallied over the past week, giving the illusion that all is well.

However, it too is now in up-thrust (reversal) position.

So, the SPY declines by just over 1%, everyone loses their head and starts talking about CBDC.

Moving on to the ‘knee-jerk’ sector for the day, let’s look at the miners and specifically GDXJ.

Junior Miners GDXJ, Daily Close

Admittedly, the prior update was unsure whether or not this sector had its up-thrust reversal ‘test’.

Well, now we know.

The chart above has all the Usual Suspects.

We see the spring to up-thrust repeating pattern.

Then, a steady decline from the up-thrust and today’s short-sharp test or as the late David Weis used to call it, a ‘gut check’.

At this point the market’s unstable.

We’ll know soon if somehow we’re on to new highs or if this was the last gasp of a bull move withing an overall, years-long, bear market.

Stay Tuned

Charts by StockCharts

Note:  Posts on this site are for education purposes only.  They provide one firm’s insight on the markets.  Not investment advice.  See additional disclaimer here.

The Danger Point®, trade mark: No. 6,505,279

Gold Miners … The Reversal

Each Peak Is Lower

Gold’s reversal or potential for reversal, has already been covered here, here and here.

We’re going to focus on the Junior Miners GDXJ but start first, with an updated chart of gold (GLD).

Gold GLD, Weekly Close

This is how it looked back on April 15th.

As of the close yesterday, we have this:

It’s arguable GLD, is now below the resistance line (completing the Spring-to-Up-Thrust) but that’s not the most important part from a trading standpoint.

When looking at the Junior Mining Index GDXJ, there’s an ominous pattern.

Junior Miners GDXJ, Weekly Close

Each extreme peak over the last three-years has been labeled; the Derecho of 2020, the so-called Ukraine ‘invasion’, and now, the banking crisis.

Note: The SVB bank failure was on March 10th. There was a ‘knee-jerk’ reaction by the public into gold and related components … that peak appears to have stalled at the location shown.

What’s going on is obvious; it’s a bear market.

Each major peak, lower than the last.

Now, the interesting part.

The Junior Miners are in Wycoff Up-Thrust condition.

In this case, price action’s solidly below the resistance line.

Looking at the daily (not shown), there may have been a ‘test’ of resistance this past week for a move higher; if so, it failed and GDXJ closed slightly lower.

Summary & Positioning

So, here we are: The market (SPY) has rallied over the past week, giving the illusion that all is well.

However, it too is now in up-thrust (reversal) position.

For my business accounts, it looks like being short the miners at this juncture is lower risk than being short biotech (not advice, not a recommendation).

Typical short vehicles that could be used (not a recommendation) are DUST and JDST.

As always, anything can happen. If the markets ‘implode’, they might be closed for any number of days or weeks.

Stay Tuned

Charts by StockCharts

Note:  Posts on this site are for education purposes only.  They provide one firm’s insight on the markets.  Not investment advice.  See additional disclaimer here.

The Danger Point®, trade mark: No. 6,505,279

Short Squeeze … Biotech

Running The Stops

It looks like we’re in a squeeze with price action screaming higher.

As shown in the last update, the LABD hard stop was @ 16.79 (not advice, not a recommendation).

With that said, the entire short position was exited at 16.7501, early in the session.

Overall gain was around 3.96%

With the housekeeping out of the way, let’s move on to the chart and see where price action’s likely to head next.

Biotech SPBIO, Daily

We’ll get right to the point and show the most likely area to clear out stops and potentially set up for the next reversal.

The moving averages have been left in the chart (not a usual practice) because that’s the focus of the crowd.

In their minds, a close above the 200-Day MA, would be bullish.

If that happens, from a Wyckoff standpoint, we could be in up-thrust (reversal) position.

Fibonacci Time

Also of note: When a Fibonacci sequence becomes obvious, that’s when it tends to fall apart or morph into some other type of sequence.

That may be happening now.

Strategy

As always, price action can and will do whatever is necessary to extract as much from both sides (bull, bear) as possible.

It may contact the 200-MA or not. It all depends on where the most stop oerders are hiding.

Slightly above the recent highs looks like a good area for those stops.

Stay Tuned

Charts by StockCharts

Note:  Posts on this site are for education purposes only.  They provide one firm’s insight on the markets.  Not investment advice.  See additional disclaimer here.

The Danger Point®, trade mark: No. 6,505,279

Narrow ‘Breadth’ … What It Means

Record Extreme

One report covering the historic narrowing of the market is here.

Never before seen narrow breadth: What does it mean?

It means the market’s ‘keeping up appearances’ while the foundation’s been removed.

That way, the professionals can get out the door; sell or sell-short, funnel capital to the only three tickers left (AAPL, AMZN, MSFT), while the public looks at the SPY, and says ‘Where’s the collapse?’

Let the crowd focus on the S&P … probably the most computer controlled, AI driven, Machiavellian manipulated market in the world … but hey, I’ve got my i-phone trading app and I’m going to ‘Put it to the man’.

Meanwhile, downside leader biotech, inches lower.

Biotech SPBIO, Daily

Let’s review where we are with SPBIO, with the full understanding that anything can happen.

For now, we’re heading lower (not advice, not a recommendation).

It’s obvious. Biotech’s following a Fibonacci time sequence.

Let’s pull out to the larger weekly chart and see something really scary.

Biotech SPBIO, Weekly Close

If we really are at the right side of the trading channel, it’s not looking good for the bulls.

Of course, it all makes sense.

The market’s at record breadth divergence. Banks are collapsing, Ukraine (fabricated, or not) coupled with trade wars, the consumer’s tapped-out (credit at maximum) and on it goes.

Positioning

Early this session, the short position in biotech (via LABD) was increased (not advice, not a recommendation).

The table below shows the trading (entry) activity during the on-going reversal (not advice, not a recommendation).

Hard Stop: 16.79

The notation ‘LABD-23-05’, indicates this is the fifth trading campaign (or trade series) in LABD for the year.

Stay Tuned

Charts by StockCharts

Note:  Posts on this site are for education purposes only.  They provide one firm’s insight on the markets.  Not investment advice.  See additional disclaimer here.

The Danger Point®, trade mark: No. 6,505,279

‘Mum’s The Word’

No One Talks About It

It’s interesting, but then again not, how this sector (biotech, SPBIO) gets absolutely no mention in the mainstream or on YouTube.

It made all-time highs and reversed down long before the rest of the indices (except the miners); why is it not the focus of financial and technical discussions?

We’ll leave that as an open question for now and move on to the technical condition; that is, the downside pivot may be at hand.

The last update finished with this (emphasis added):

Taking it all in aggregate, we’re obviously at an extreme and either going to reverse from here or launch into a sustained continuing directional move.

Well, reversal it is.

This update will be brief, showing the current state of SPBIO (as of 11:57 a.m., EST) and the Fibonacci time correlation from the February 2nd top.

Biotech SPBIO, Daily

For the engineers out there, the ‘exactness’ (i.e., posting extremes to the day) is not important.

What is important is to recognize the structure.

That is at this point, price action’s adhering to a Fibonacci time sequence.

Good News, Bad News

The good news is, anyone short this sector (via LABD) is now green for the day (not advice, not a recommendation).

The bad news is, this market may once again be the downside leader. We’ve already done the work on projecting target areas.

If those projections come to pass, it’s going to be a very different world. At that point, this sector may actually be the topic of mainstream and YouTube discussions.

Stay Tuned

Charts by StockCharts

Note:  Posts on this site are for education purposes only.  They provide one firm’s insight on the markets.  Not investment advice.  See additional disclaimer here.

The Danger Point®, trade mark: No. 6,505,279
Mastering The Reversal … Biotech

At The Extreme

We’re about to find out if Biotech’s in a new bull market or at the retrace extreme, ready for reversal.

The last update gave us the big picture on the index; a massive H&S pattern, five years in the making.

A potential trendline was shown on the daily chart of inverse fund LABD. That trend was subsequently negated by price action just hours later.

Let’s look at SPBIO, more specifically, the 4-Hour Chart.

To mimic price action of leveraged inverse LABD, we’ll invert the SPBIO.

The reason for inverting, not using LABD, is that leveraged funds have a downward bias which distorts the actual data.

Biotech SPBIO, 4-Hour, Inverted

The chart highlights Point No. 1 and Point No. 2. These areas are identified as a reminder; the prior set-up and reversal was identified, to-the-day.

There’s no guarantee the same performance will be repeated, i.e., spotting the next reversal.

The chart below, shows why we’re at The Danger Point®

Wyckoff discussed a phenomenon he called ‘shortening of the thrust’. When price action’s ready to reverse, the directional thrusts become shorter.

We’ll zoom-in on the recent action to show that Friday’s session failed to post a new daily low (high for non-inverted).

Now new low, may be the reversal nuance or not … we’ll find out at the next open (not advice, not a recommendation).

Not shown on the chart, price action’s retraced a Fibonacci 50%, of the entire move from the set-up and reversal of February 2nd, and 3rd.

Summary

Taking it all in aggregate, we’re obviously at an extreme and either going to reverse from here or launch into a sustained continuing directional move.

Stay Tuned

Charts by StockCharts

Note:  Posts on this site are for education purposes only.  They provide one firm’s insight on the markets.  Not investment advice.  See additional disclaimer here.

The Danger Point®, trade mark: No. 6,505,279

Biotech … Early Stage Reversal

The ‘Big’ One ?

Sometimes early in a reversal it looks like nothing’s happening.

Only after we’re underway, it’s clear where the pivot occurred.

In our case, biotech SPBIO, broke down out of its bear flag, came back to test and now, may be continuing on its downward track.

The reversal’s not obvious yet and can be easily negated by more upward pressure. We’re at The Danger Point®.

A quick review of the monthly chart shows a potential Head & Shoulders forming.

Biotech SPBIO, Monthly

If that’s what’s happening, the H&S pattern, it’s massive; spanning five-years and counting.

The ‘Fundamentals’

Of course, a massive reversal pattern would coincide with what’s happening overall at this juncture.

It seems that each day, we have more of this:

Twitter Files: Dr. Anthony Fauci “Lied Under Oath”

CDC Director Admits Vaccines Do Not Prevent COVID Transmission, Blames “Evolution Of Science”

Throw in a banking crisis or two, credit tightening, supply disruptions and this sector may collapse under the weight of that all by itself (not advice, not a recommendation).

Moving closer in, on a 3-Day chart we see the break and test more clearly.

Biotech SPBIO, 3-Day

We’ll zoom-in on the trend break.

Lastly, going to the 3X Leveraged Inverse Fund LABD, on the daily timeframe, it shows a repeating trendline that may be in confirmation during this session (currently, 11:15 a.m. EST).

Biotech Leveraged Inverse LABD, Daily

It’s still early in the session and anything can happen.

This is where the risk is least (not advice, not a recommendation).

Stay Tuned

Charts by StockCharts

Note:  Posts on this site are for education purposes only.  They provide one firm’s insight on the markets.  Not investment advice.  See additional disclaimer here.

The Danger Point®, trade mark: No. 6,505,279