The majority of the indices are at their right-side channel lines.
We’ll cover semiconductor SOXX, and QQQs, below. However, biotech IBB, and SPBIO, are in similar positions.
From a calendar and data standpoint, there’ll be plenty that could be used as an ‘excuse’ for market moves but let’s ignore the (intended) distractions and take a look at what the market is saying about itself.
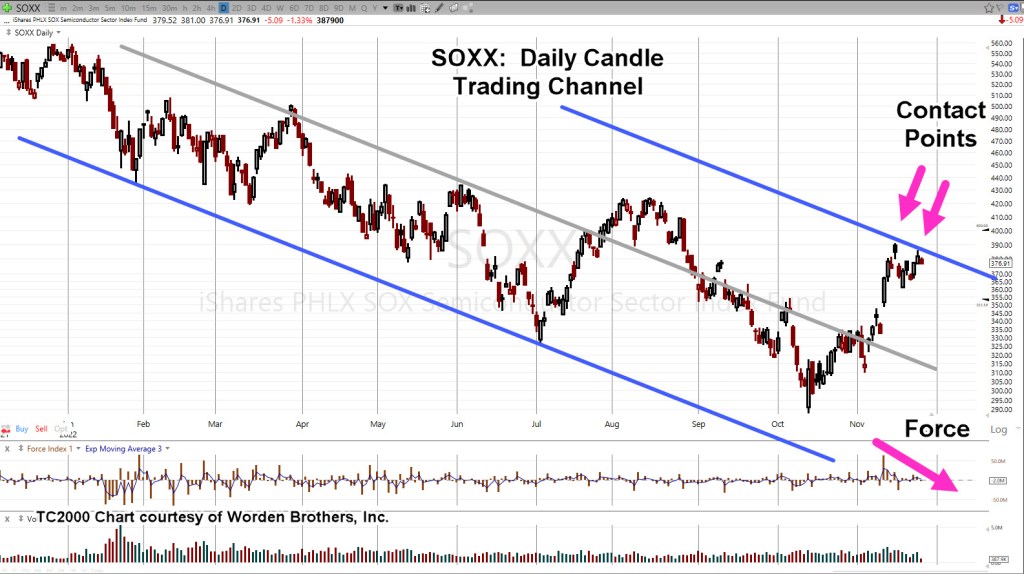
First up, is the semiconductor index, the SOXX.
Semiconductor’s, SOXX, Daily
The chart has Fibonacci retrace levels shown. Price action has retraced to 38.2% and stalled.
But wait, there’s more.
Putting in a trading channel, we could be at a reversal point.
Note the upward thrust energy (‘Force’) has dissipated.
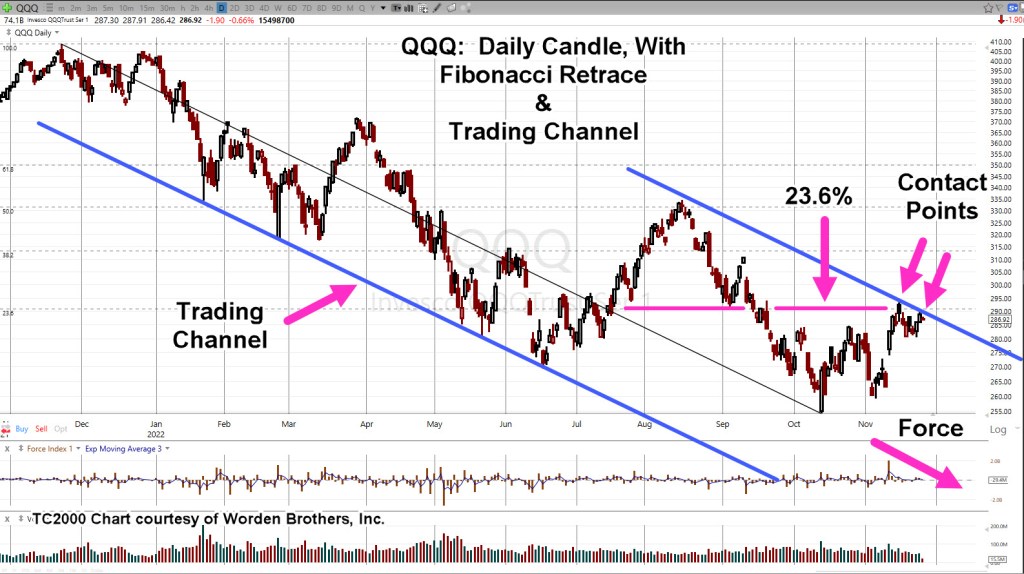
the NASDAQ is in a similar situation but weaker from a retrace standpoint.
NASDAQ, QQQ, Daily
Looking at the monthly chart for the Q’s (not shown), it’s been a Fibonacci 13-months since all-time highs.
Force dissipation and ‘Contact Points’ are near identical to the SOXX.
Summary
Biotech IBB and SPBIO, are in similar positions. In fact, the overall markets appear poised for downside reversal.
As discussed in the last update, the bond market could be signaling danger ahead with its sharp upward reversal; now (potentially) entering its sixth week.
Note: Posts on this site are for education purposes only. They provide one firm’s insight on the markets. Not investment advice. See additional disclaimer here.
The potential for a sustainable bond reversal was identified way back in mid-October.
Now, over a month later with bonds moving decisively higher, the ‘narratives‘ are out in force.
Those narratives revolve around ‘pivot me this, or ‘pivot me that‘, or an infinite number of the same variations.
The reality is, there’s not going to be any ‘pivot’.
Even if there was, as Michael Cowan reported weeks ago, the market keeps crashing anyway (not advice, not a recommendation).
With that in mind, a popular narrative is that bonds are higher because the Fed will lower rates when they see we’re in a ‘recession’.
Well, they won’t ever see a recession because we’ve skipped that part; going straight to collapse and economic depression. 🙂
Of course, as Jerimiah Babe puts it, Americans won’t do a thing to get ready until the last minute … most likely after the market is down 50%, or more.
Instead of the placating, proletariat calming narrative, it’s a recession; maybe bonds are moving in response to those in the know … something much worse may be ahead.
Could bonds be signaling, we’re close to a market rout?
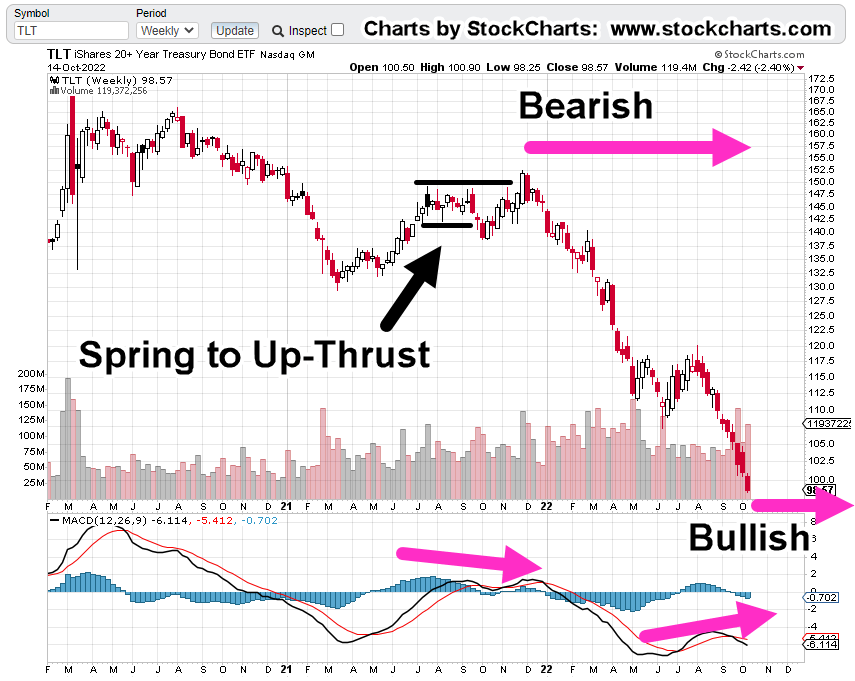
Bonds, TLT, Weekly
We’re going to start with the original analysis, showing the potential for a sustained reversal.
From the October 16th, post.
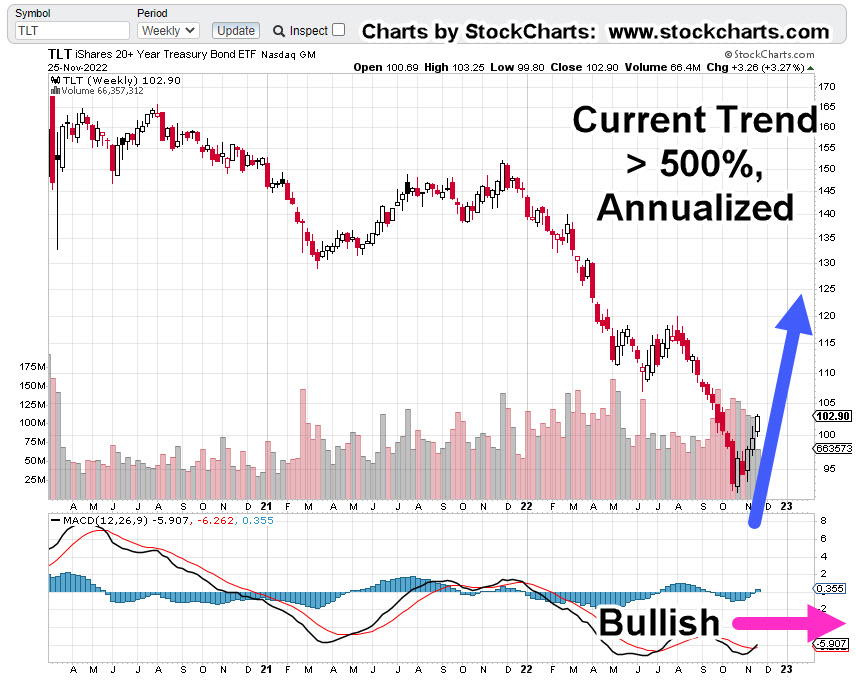
A month or so, later.
As with the dollar analysis from years ago, a weekly bullish divergence as we see here, may result in a rally that lasts longer and goes farther than anyone expects.
Of course, the real question is ‘what does it mean?’
As Wyckoff said over a century ago, we won’t know the full reason for a move until it’s over.
One view of it however, different from the accepted narrative, we could be headed for some kind of disconnect; those in the know are shifting to ‘relative’ stability.
Moving on to other markets, we have the following:
Positioning
Not advice, not a recommendation.
The push higher in biotech SPBIO, discussed in the prior update did not materialize.
Instead, we got a new daily low, followed by some upward testing action.
A day-trade in LABD was opened and closed; then near the market close, opened again.
Details are as follows
LABD-22-12:
Entry @ 19.9134***: Stop @ 19.10***
Note: Positions may be increased, decreased, entered, or exited at any time.
Note: Posts on this site are for education purposes only. They provide one firm’s insight on the markets. Not investment advice. See additional disclaimer here.
From a Wyckoff standpoint, we’ve identified one of, if not the sector(s) most likely to decline the farthest and fastest in a bear market.
Without question, biotech contains the overriding ‘elephant’ that’s literally affecting everything else on the planet (not advice, not a recommendation).
As stated in the tag-line above, the two indices in question are IBB (large cap) and SPBIO (small cap).
IBB, has Amgen, Gilead and Vertex, as the top three while SPBIO, has more speculative (i.e., losing more money) Beam, Twist and Fate.
Index IBB has $342.8-Bil, combined for the top three while SPBIO has only $6.5-Bil, combined.
So, it makes sense the more speculative ‘cash burning inferno‘ TWST, is in the SPBIO. 🙂
On to the charts
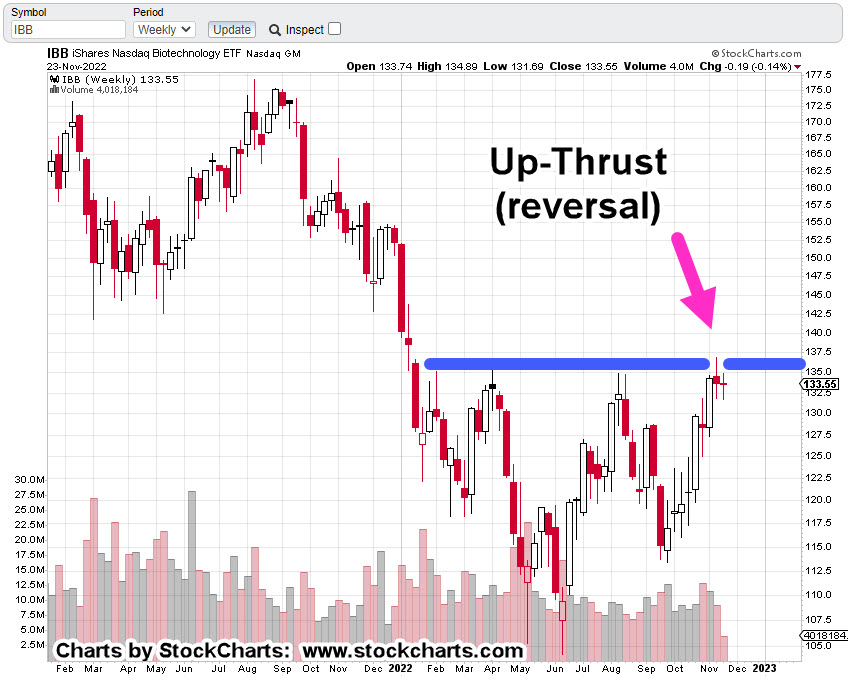
IBB Weekly
IBB has formed a decisive resistance area as shown.
The fourth attempt which pushed above the prior three levels (and retraced), puts IBB, at The Danger Point®
Next up is the SPBIO.
It’s much weaker and thus the focus for any short opportunities (not advice, not a recommendation).
SPBIO ($SPSIBI), Weekly
While IBB, has moved higher, to an up-thrust over the past nine weeks, SPBIO during that time, has languished.
Note: The chart scales are identical. Scrolling up and down, one can visually see the weakness of SPBIO.
SPBIO, also reached all-time highs, six months before IBB.
Getting Closer-In: SPBIO
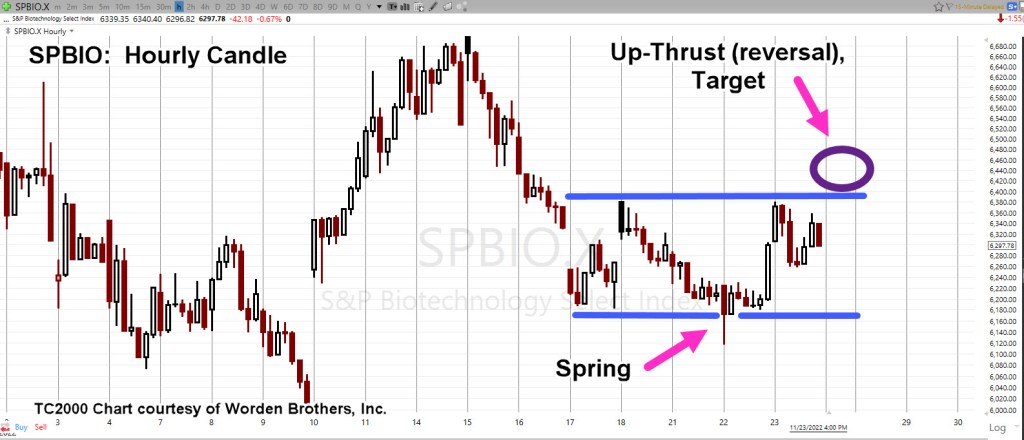
We’re going to look at the hourly chart.
SPBIO, Hourly
Those who are long-time visitors to this site will instantly recognize the set-up: ‘Spring-to-Up-Thrust‘
This Friday, tomorrow, is a shortened trading day.
There’s a potential we’ll have a small blip higher into the up-thrust zone.
Conversely, for 3X Leveraged Inverse Fund LABD, the potential is for a temporary move lower.
Leveraged Inverse LABD, Hourly
This is how it looks for LABD.
Note for the inverse fund, the ‘spring’ on SPBIO, becomes the ‘up-thrust’ on LABD.
Positioning
Not advice, not a recommendation
Wednesday’s downside action in LABD, resulted in the LABD-22-10, position being stopped out with an overall gain around 7.12%.
There have already been several disruptions to the company’s trading platform and data line over the past month and we’ve not even got started with market chaos.
Recall that just recently, the Canadian market went off-line for several hours. We should consider these events the ‘norm’, on a go-forward basis.
As a result, a standing order (in the market) is in place to go long LABD (short SPBIO) at the execution price of LABD @ 18.62.
That order may or may not be modified as we go into the open tomorrow morning.
Note: Posts on this site are for education purposes only. They provide one firm’s insight on the markets. Not investment advice. See additional disclaimer here.
It’s just a few hours before the futures open and we’re about to see if we have a (continuing) downside reversal.
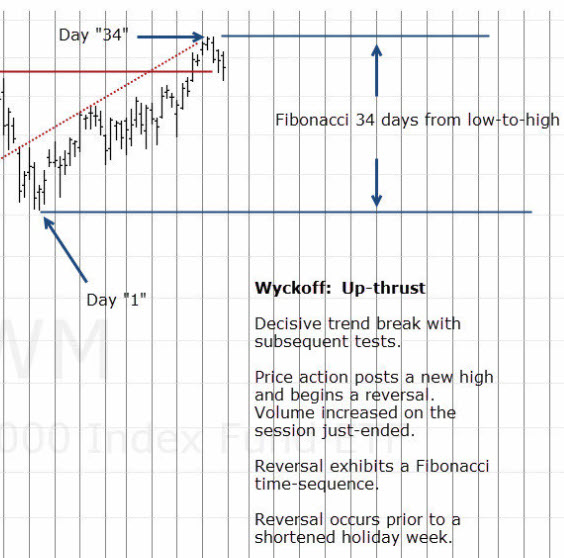
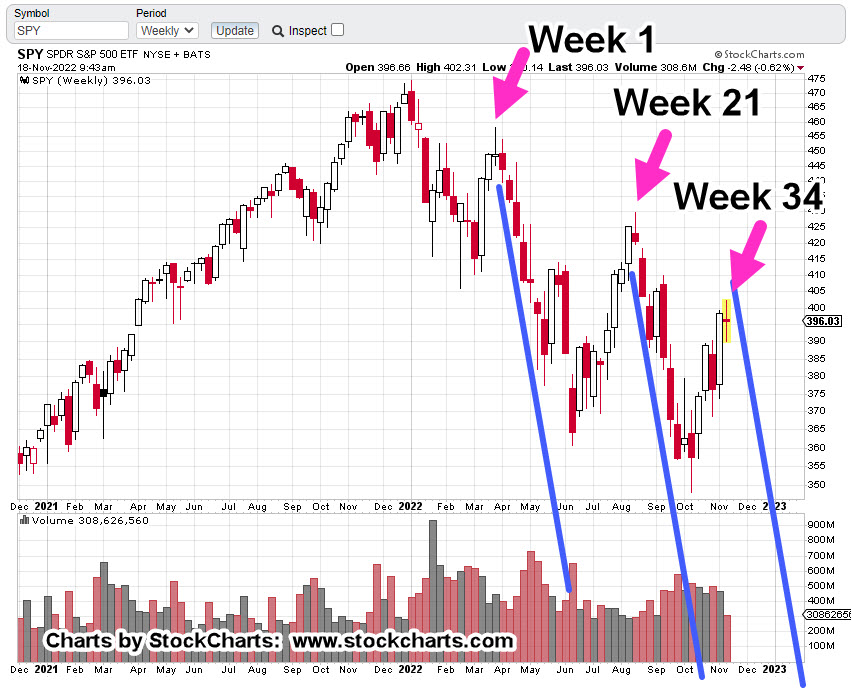
Remember, last week was Fibonacci Week 34, as discussed in this update.
That week’s range was just over 3.1%.
The time before that, similar narrowness Week 21, was around 2.5%.
Perhaps, even more interesting, going back to Week 1, we have yet another narrow range of 2.9%.
We’re about to find out if that sequence of narrow ranges means something or not.
Holiday Turns
This coming week is a holiday week.
It seems appropriate at this time, to re-publish analysis done years ago and currently behind the password firewall of my firm’s main website.
Author’s Note: At the time, I was publishing a daily market summary.
Here it is, from June 27th, 2015 … so long ago.
Market Summary: 6/27/15
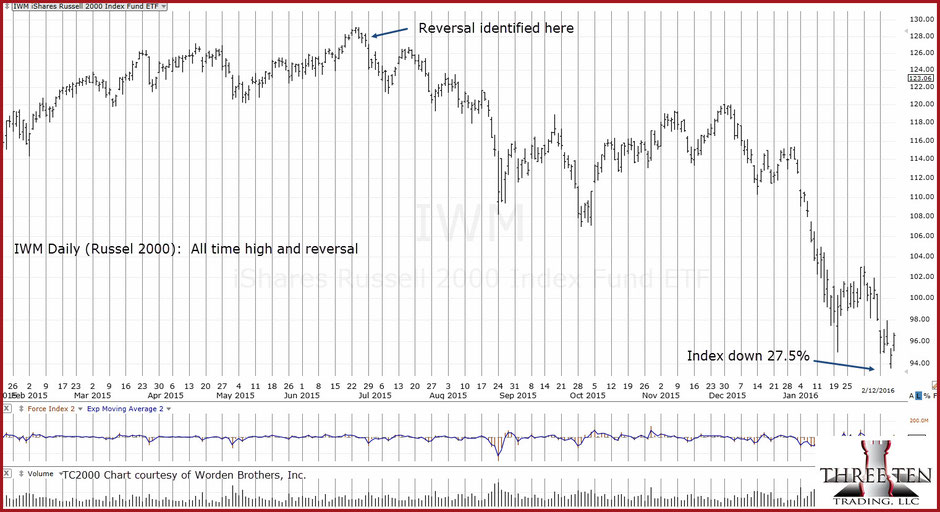
The Russell 2000 index has reversed. In addition, the S&P 500 volatility has declined to pre-2008 crisis levels. We now have yet another potential reversal during or just prior to (or just after) a holiday week.
This is how the Russell looked when the reversal was identified.
Author’s Note: The hyperlink above is password protected. The chart below, has been brought outside the firewall.
The following data shows the original analysis (first chart) and then, months later, how that analysis was proven out to have identified the (near) exact moment of reversal.
Continuing on with the original (6/27/15) post.
For clarity, the reversal area of the chart has been expanded below:
Other notable reversals that occurred prior to, during, or just after a holiday week:
Week of 5/23/08: S&P 500 makes a high on the Monday prior to Memorial Day: S&P then crashes over 53%.
Week of 7/3/14: Russell 2000 makes a high on the Tuesday of the July 4th week: Subsequent decline is 9%
Week of 9/5/14: Russell 2000 makes a high on the Wednesday after the Labor Day weekend: Subsequent decline is 12%
Week of 6/26/15: Russell 2000 makes a high on the Wednesday prior to the July 4th week: Subsequent decline: 27%
Going way back: The all time market high of 1929, occurred on September 3rd, of that year. That date was the Tuesday following the Labor Day Weekend. Subsequent decline was 84 – 89%
Author’s Note: Months later, we now have the result as shown below:
Note: Posts on this site are for education purposes only. They provide one firm’s insight on the markets. Not investment advice. See additional disclaimer here.
How many biotech ‘outfits’ are at risk of being incinerated during a market implosion?
For activist short-seller, Scorpion Capital, they’ve found at least one and they’re not mincing any words.
They sate: Twist Bioscience (TWST) is ‘cash burning inferno‘ and then go on to say:
Price target for TSWT, is Zero.
Their report supporting that assessment is linked here.
Note: It’s 236-pages, long!
Maybe it’s a one-off.
However, considering the other market implosions in just the past week, probably not.
As is typical for an equity in a long decline, the lawsuits have already started.
Other implosions just in the past seven days, are FTX, and Twitter. Maybe, Amazon (AMZN) will be next.
Analysis, vs. Antics
Seems like every other week or so, we’ve got some kind of Alpha, Beta, Delta, Gamma, extreme du jour, that’s supposed to cause ‘fireworks‘.
Reporting on fireworks, does not help navigate the current (or any future) situation.
What does help, is to clearly and without bias, assess what price action’s telling us.
We’ve already analyzed the biotech sector many times over as (potentially) the index most susceptible for a severe decline if not outright implosion.
That implosion may already be underway (not advice, not a recommendation).
Back To Wyckoff
Wyckoff analysis pointed us to biotech over a year ago.
Now, as is typical, the truth is starting the come out; a trickle at first …
So, for today’s update were going shift gears and follow-up on the prior two posts here and here.
We’ll take another look at the S&P (SPY); specifically, the weekly chart.
S&P 500, Weekly
The weekly is shown with trendlines.
Looking at those lines, is there any other basis for drawing them at the location shown?
The short answer is yes and it’s on the second chart.
The chart below has a Fibonacci time correlation for the trendlines, now, potential trading channel.
We’re currently at Week 34, from the beginning of the (potential) channel.
It may be something, it may be not.
As of this post (10:07 a.m., EST), we don’t know and price action itself, is the final arbiter.
Summary
Because of the supposed ‘fireworks’ scheduled for the day, we may not know if we’re at a pivot point until next week.
That week just so happens, to be a holiday week.
Many times, this site has a presented a proprietary insight; market reversals tend to occur just before, during, or just after a holiday week.
Obviously, the most famous of these was September 3, 1929 (the day after Labor Day weekend), which was the all-time high and reversal, leading to the crash.
Note: Posts on this site are for education purposes only. They provide one firm’s insight on the markets. Not investment advice. See additional disclaimer here.
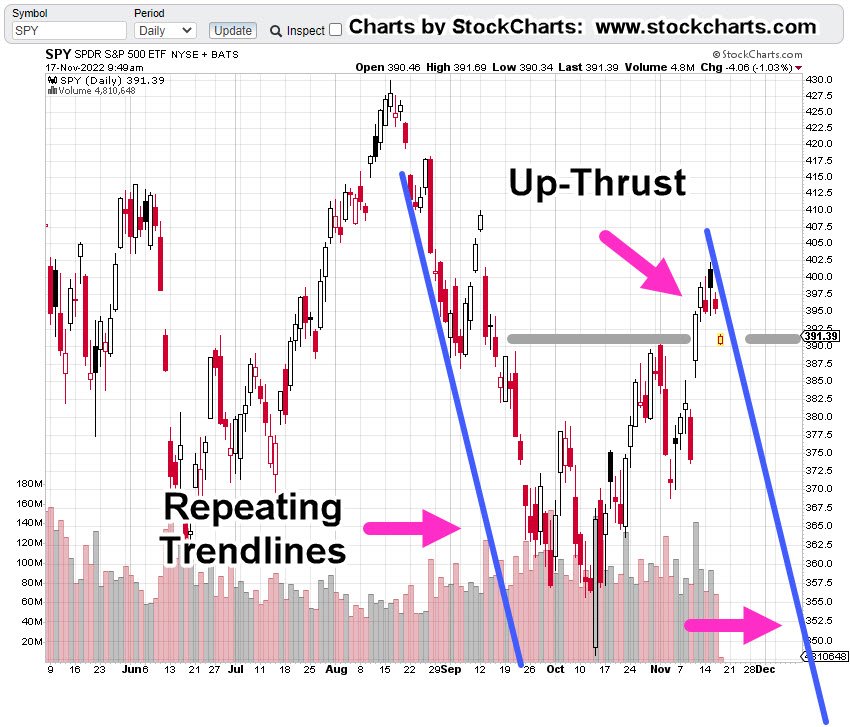
“SPY has yet to post a new daily low (below SPY, 394.49). If or when it does, that’s just one more addition to the bearish scenario.”
This morning’s open, puts the SPY below that 394.49, level and potentially confirms an up-thrust reversal as well as downtrend contact (shown below).
However, let’s not get ahead of ourselves as the first order of business, especially with the S&P (SPY), is an attempt to close this morning’s gap.
While that’s happening, let’s look at the charts.
S&P 500, SPY, Daily
Looking at the wider timeframe, first.
Now, let’s get closer-in.
As this post is being created, SPY is attempting to close the opening gap as expected.
Confusion Rules
As posted earlier, events are accelerating to the downside.
Supporting that assessment, we have this just out on the Crypto carnage; then on the flipside, we have this report, pointing to more upside.
Meanwhile, biotech pivots lower.
Part of the objective of these posts is to document the procedure (Wyckoff analysis) being used to select the market(s) most susceptible for a significant decline.
With that, it’s been on again off again with biotech for most of this year.
However, it looks like we’re now, at another (possibly, final?) pivot point lower.
Positions: (courtesy only, not advice).
The biotech short is being built in real time (not advice, not a recommendation).
Note: Posts on this site are for education purposes only. They provide one firm’s insight on the markets. Not investment advice. See additional disclaimer here.
Lastly, using the way-back machine, here’s an article from the Seattle Times, written in December 1999. It compares the situation (then) to a century earlier.
On Track For Another?
Obviously, that can’t be known until if/when, it happens.
However, we can look at the most watched market, the S&P, and see what it says.
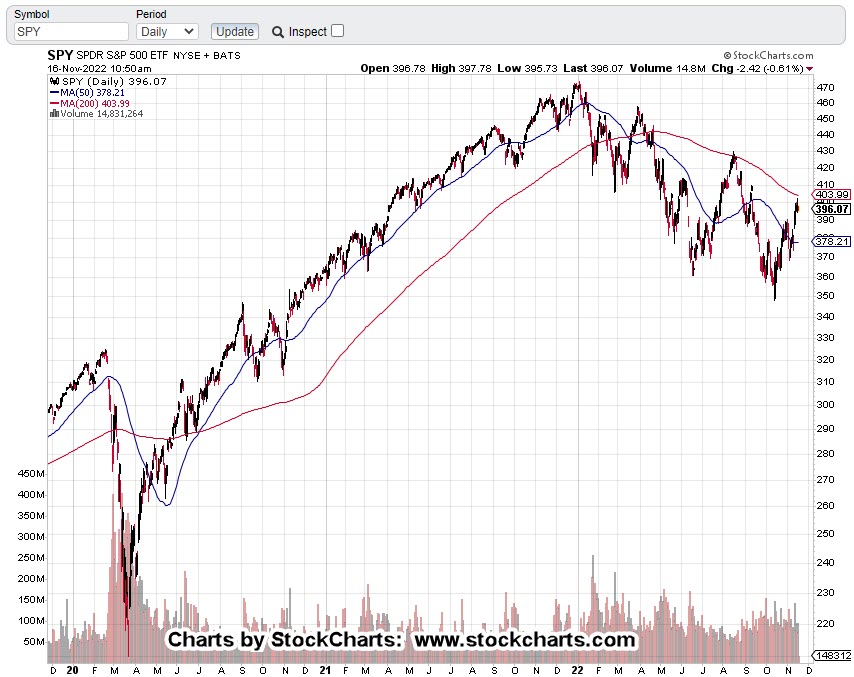
S&P 500, SPY, Daily
We’re leaving in the moving averages to show, at least from the 200-Day perspective, the downtrend is still intact.
Other items to note:
The market is still sub-dividing lower, lower highs, lower lows. Price action’s retraced to a Fibonacci 38% (shown below), and is also in Wyckoff up-thrust (reversal) position.
We’ll get closer-in with the details.
Moving averages have been removed for clarity.
The blue line is the resistance and up-thrust area. Price action clearly above and apparently, hesitating.
Dashed grey line is the Fibonacci 38% retrace from all-time highs (1/4/22), to the most recent lows set on 10/13/22.
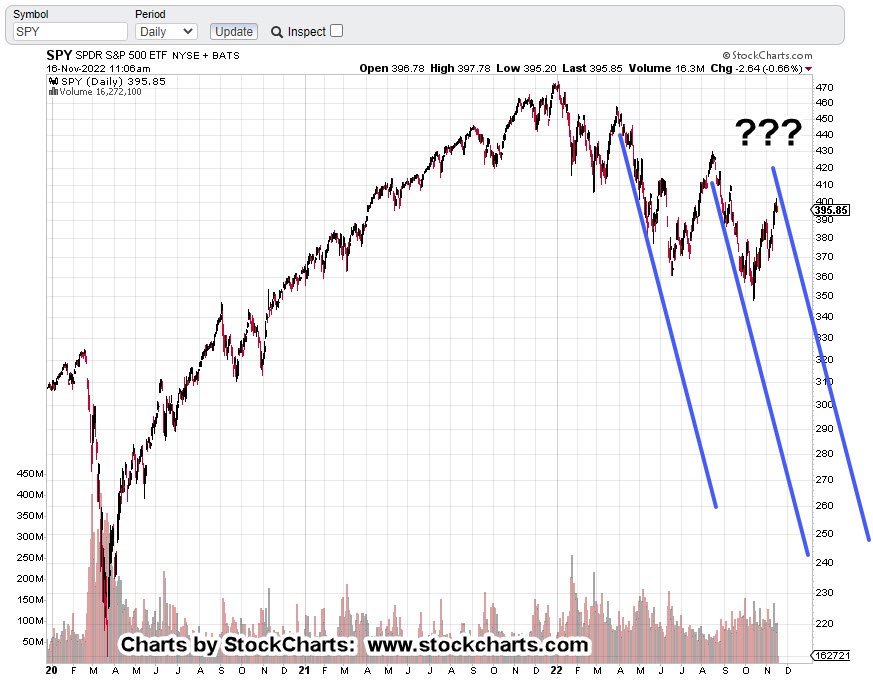
Zooming back out, is the scariest part of this chart.
There’s no doubt; we’ve had at least two repeating trendlines. A third could make it a trading channel.
Summary
As of this post (11:28 a.m., EST), SPY has yet to post a new daily low (below SPY, 394.49). If or when it does, that’s just one more addition to the bearish scenario.
Positions: (courtesy only, not advice).
The focus is on biotech; uniquely positioned as the weakest of all the major indices (not advice, not a recommendation).
Note: Posts on this site are for education purposes only. They provide one firm’s insight on the markets. Not investment advice. See additional disclaimer here.
As said in this update, the historic short-squeeze, while damaging to account P/L, was a huge public service.
This chart confirms the majority of short-positions have evaporated. Meaning, the potential fuel for relentless upside (from those shorts), is no longer there.
That fact is being mirrored in price action as we speak.
As covered above, two markets are hanging by a thread: biotech and real estate.
Both are bubbles on a world-wide scale, but biotech is the one that may affect all others.
Biotech SPBIO, Inverse LABD
As this post was being created, biotech leveraged inverse fund LABD, has just printed (as of 12:40 p.m., EST) outside-up; also known as a ‘key reversal’.
The daily chart is below.
LABD, Daily
To make it an official outside up, price action will need to close above yesterday’s close (LABD: 17.87).
We’ve already shown that SPBIO, price action has formed a huge bear flag lasting more than eight weeks.
Action from the past three days can be considered a Wyckoff up-thrust as well.
Now, we have a potential key reversal.
If so, this market may be in serious downside trouble.
Positions: (courtesy only, not advice).
Yesterday, JDST-22-05, was exited at 9.0341, with a loss of – 1.45%, so that focus (and capital) could be directed to biotech, SPBIO and inverse LABD (not advice, not a recommendation).
Note: Posts on this site are for education purposes only. They provide one firm’s insight on the markets. Not investment advice. See additional disclaimer here.
Note: Posts on this site are for education purposes only. They provide one firm’s insight on the markets. Not investment advice. See additional disclaimer here.
In fact, Wyckoff’s stock market training course, first published in 1934, (still available), says that until you can ignore the financial press completely, ‘You will never be successful in the markets’.
Price action itself, properly interpreted, will tell you where to look for the opportunity.
The Ponzi Implosion, Cometh
The market is littered with Ponzi schemes. Some have already imploded, CVNA, HOOD, Crypto; some have not.
Concerning Crypto, here’s an excellent update from Michael Cowan. Buried in that update, at time stamp 4:58, looks like HOOD, may be in even more trouble.
Biotech is in a class of its own and was discussed in yesterday’s update.
For gold, we’re going to look at the Junior Miners GDXJ, and last week’s action.
Junior Miners GDXJ, Daily Close
The Junior’s are the weakest in the sector; therefore, that’s where we look for a short opportunity (not advice, not a recommendation).
To move higher, above resistance, normal market behavior, is to come back to the lower blue line (i.e., support) to gain enough energy to move higher for a breakout.
To move lower, normal market behavior, is to come down to the lower blue line as a test which subsequently fails; the move continues lower.
Either way, normal behavior at this juncture, is to move lower. We’ll see.
Now on to the chief cook and bottle washer … Tesla.
Tesla (TSLA), At The Edge
For starters, let’s recognize there’re a lot of moving parts; U.S. ‘parts’ and China ‘parts’.
If one’s going short, another task is to forecast under what conditions a short would have enough risk removed.
For that answer, oddly enough, we go to gold, GLD.
Gold GLD, Weekly: 2015 – 2017
GLD posted a massive upthrust above the blue line lasting over fourteen weeks before breaking decisively lower.
Then, it labored four weeks to come back up for a test.
After that, collapse; lower weekly closes for seven consecutive weeks.
In the chart above, the area identified as ‘Short’, has as much upside risk removed as possible, right at resistance.
Now on to Tesla.
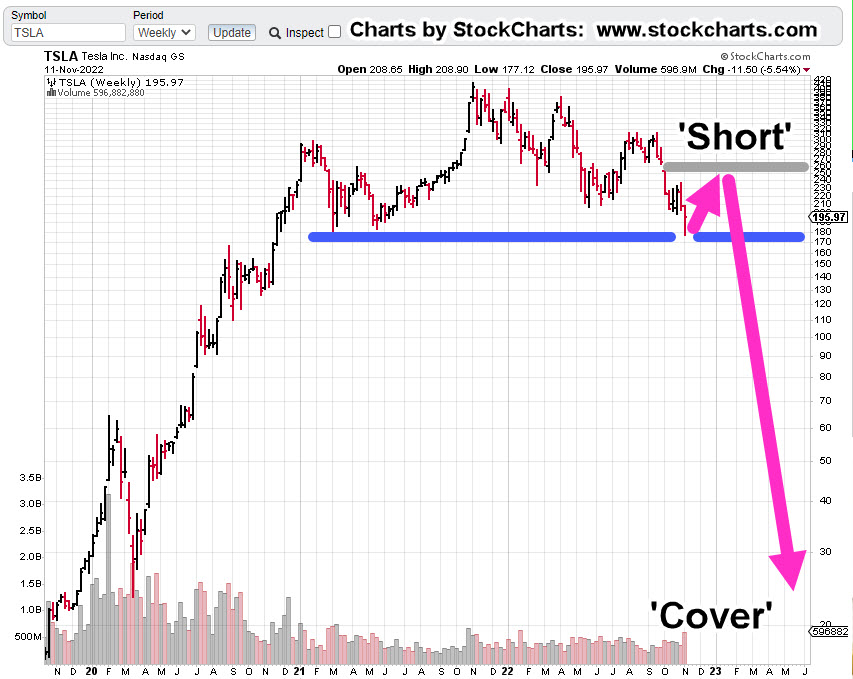
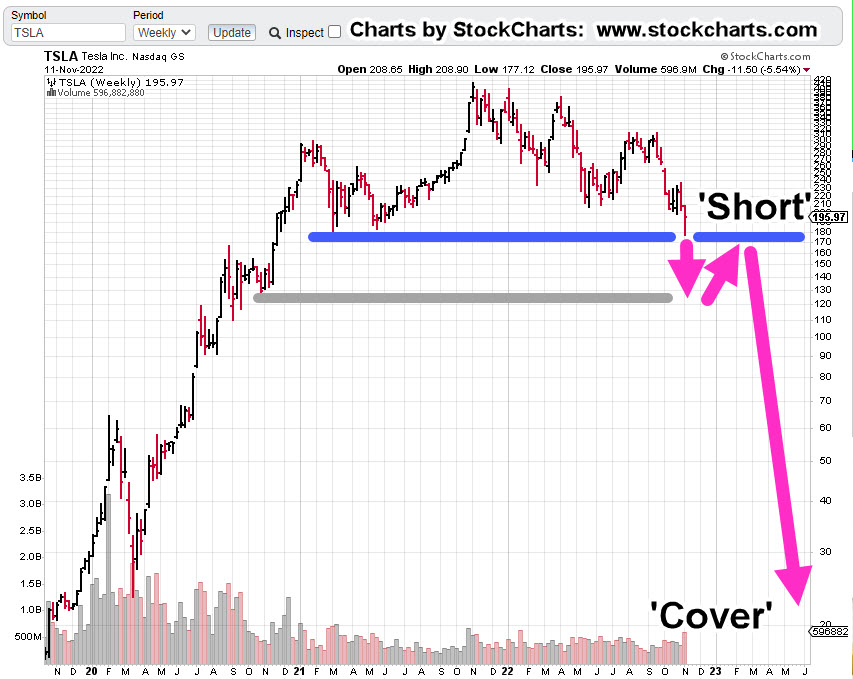
Tesla TLSA, Weekly
Two scenarios are presented where risk may be reduced.
Chart 1
Chart 2
One of these may happen or neither of them.
Either way, for risk to be reduced, a short entry is needed to be at a known resistance level (not advice, not a recommendation).
Let’s move on to the current positioning.
Positions: (courtesy only, not advice).
One of three events will happen at the next session.
1: Both positions stopped out
2: One position stopped out
3: No positions stopped out
Each outcome will provide a data-point where to focus (or not) in the current environment.
LABD-22-10:
Entry @ 18.1398: Stop @ 16.83
JDST-22-05
Entry @ 9.1666: Stop @ 8.79
Note: Positions may be increased, decreased, entered, or exited at any time.
Note: Posts on this site are for education purposes only. They provide one firm’s insight on the markets. Not investment advice. See additional disclaimer here.