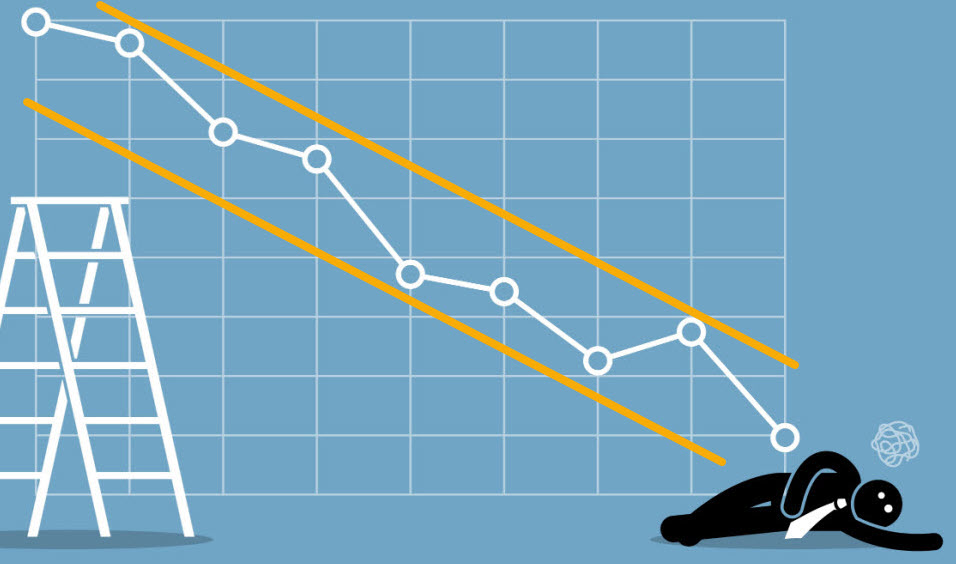
Biotech … Bear Flag Breakout

A Long Way Down

On February 3rd, also represented as; 2/3/23, it all changed.

That was the day the ‘toxic train‘ derailed in East Palestine, Ohio.

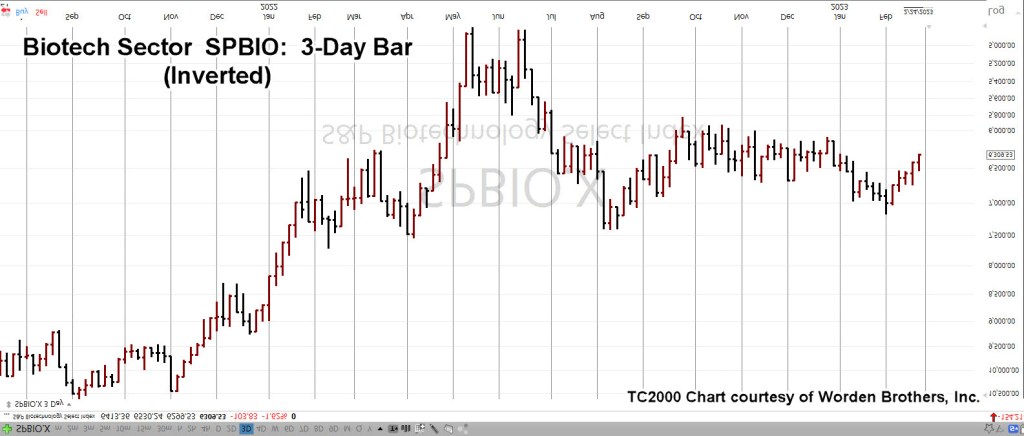
It was also the day biotech sector SPBIO, reversed to the downside.

The biotech reversal was identified to the day with the following quote:

” … today’s action is consistent with resolution of the five-months of congestion …”

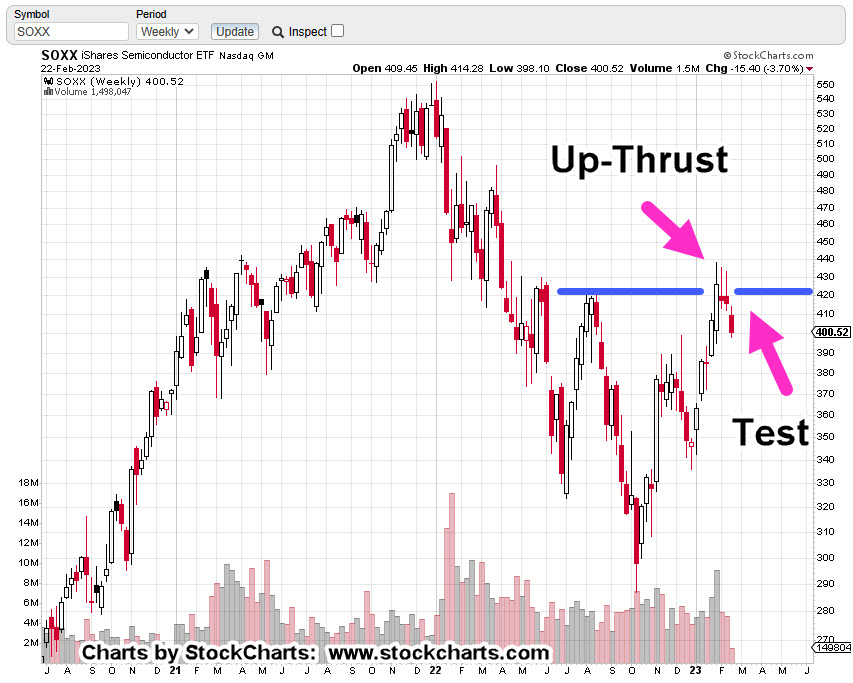
Biotech had been in a congestion zone, a bear flag, for an incredible five-months. There’s no other pattern like on the chart of SPBIO (ticker, $SPSIBI, on StockCharts).

The analysis stated that if or when this sector breaks to the downside, the extended period of congestion suggests a long, sustained, move lower (not advice, not a recommendation).

So, here we are.

Now, the downside reversal is obvious. Then again, it’s likely we’re still very early in the move as we’ll see below.

Projection Methods

We’re going to use two projection methods:

First: The standard classical chart which identifies a potential Head & Shoulders pattern.

Second: The century old technique of ‘counting’ via Point & Figure (P&F).

Biotech SPBIO, Weekly (Classical)

Two charts are in classical format. The first shows the trading channel that spans 39-weeks from week 5/13/22, to week 2/3/23.

Note: Let’s not miss the symbolism (also, here and here): May 13th, 2022, was Friday. Then we have 2/3/23.

“For we wrestle not … “

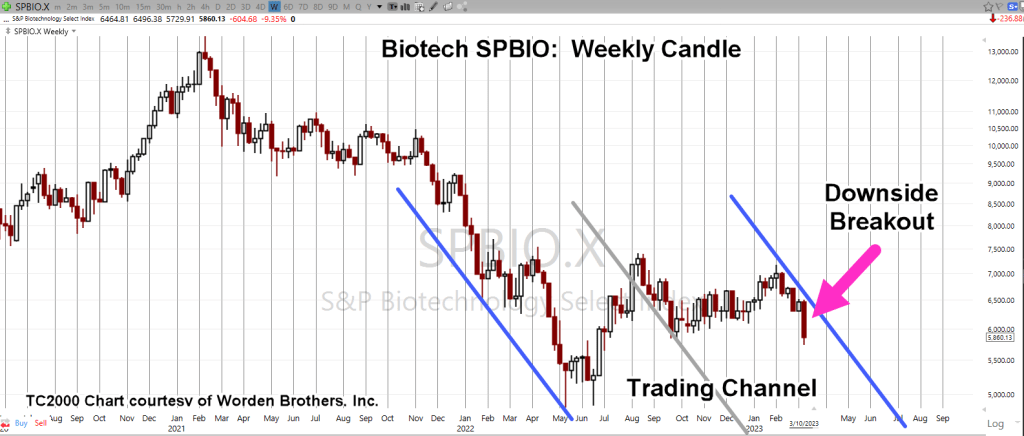
The second chart is a compressed view.

Note the “3,000-level”, discussed in the P&F section.

Biotech SPBIO, Monthly

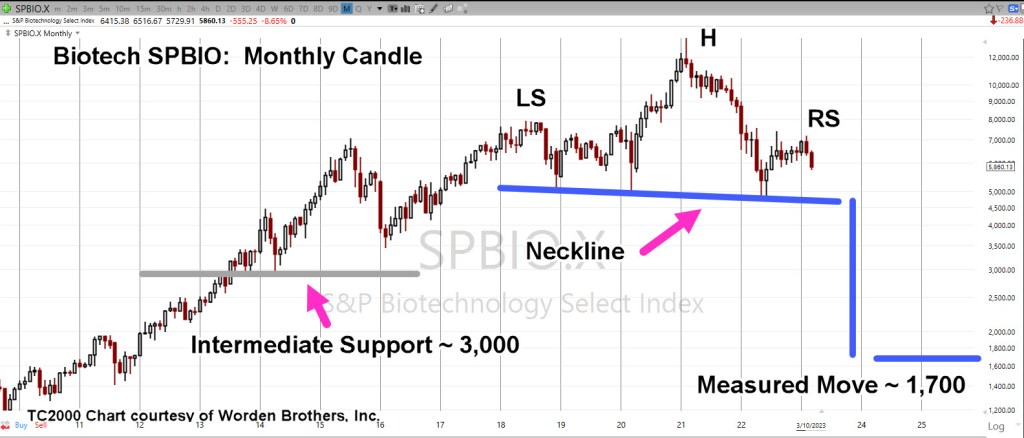
If the H&S pattern is in-effect and the neckline is broken, we have a measured move projection to the vicinity of SPBIO ~ 1,700 (not advice, not a recommendation).

Now, on to the P&F.

The ‘P&F’ chart has been used as a forecast tool for over one-hundred years.

The idea is to ‘count’ the number of congestion points and then project that congestion either higher or lower.

In our case of a breakdown, the projection is lower.

Biotech SPBIO ($SPSIBI), Daily P&F

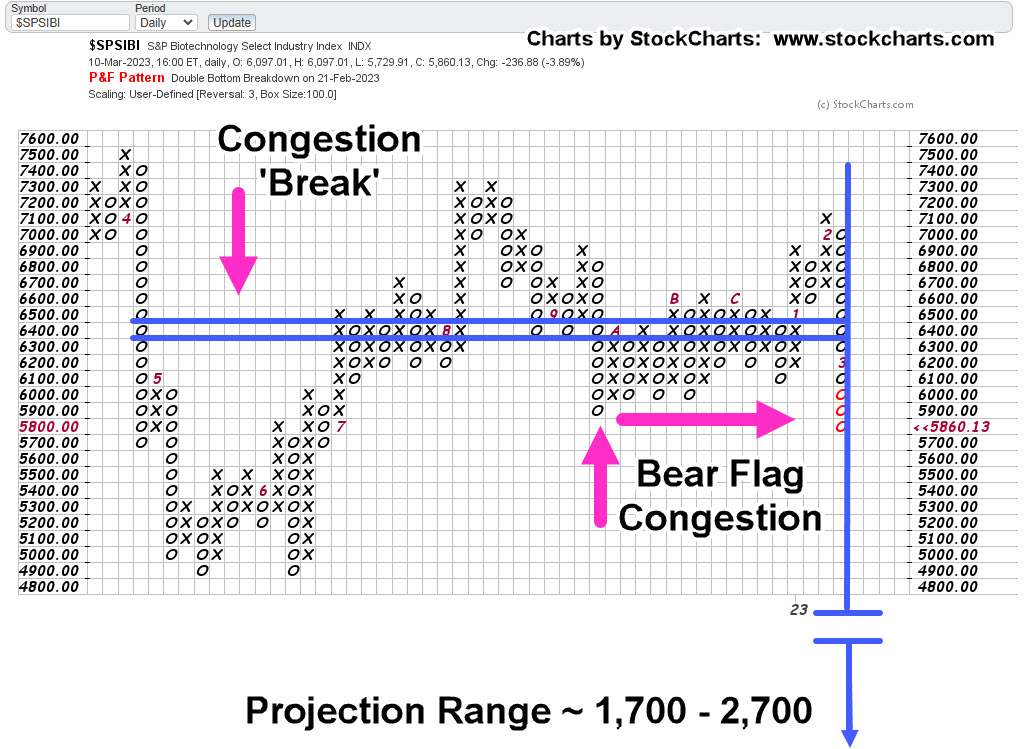
The P&F chart comes up with roughly the same lower projection; approximately 1,700 (not advice, not a recommendation).

Looking at the P&F, we can see a steady amount of congestion with few breaks, that is, until we get to the left-most area.

There, we have a break of twelve boxes.

In classical P&F terms, that break of 12, indicates the SPBIO may ultimately reach the 1,700 level, but price action could be choppy after the initial count.

That initial count equates to around 3,000 for SPBIO, which just so happens to be an intermediate support level as shown on the Monthly chart.

Stay Tuned

Charts by StockCharts

Note:  Posts on this site are for education purposes only.  They provide one firm’s insight on the markets.  Not investment advice.  See additional disclaimer here.

The Danger Point®, trade mark: No. 6,505,279

Intel … The Last Squeeze ?

Straight Up … Into Resistance

Q: How do you know it’s a squeeze?

A: Price action goes straight-up, then collapses.

So, we won’t know for sure, until a downside reversal (not advice, not a recommendation).

Right now (as of 10:57 a.m., EST), we’re at the ‘straight-up’ part.

The INTC, 15-minute chart below, shows the action.

Intel INTC, 15-minute

There’s a lot going on in the chart.

We have a ‘confluence’ of Fibonacci retrace and projection at the 27.25 area.

In addition, there is a price gap in the vicinity of 27.50

Once again, if it’s a short squeeze, it won’t be known for sure until it’s all over and price collapses.

One thing that can be said with some confidence, if INTC reaches 27.25 – 27.50, that puts it at The Danger Point®

Stay Tuned

Charts by StockCharts

Note:  Posts on this site are for education purposes only.  They provide one firm’s insight on the markets.  Not investment advice.  See additional disclaimer here.

The Danger Point®, trade mark: No. 6,505,279

Intel … Last One Left ?

Mass Exodus, Portland

Between the last update and now, we have this.

All of Walmart to exit Portland.

As if that weren’t enough of a recruiting bonus for area employers, looks like half of Oregon does not want to be Oregon.

This just out, session movement to be part of Idaho.

Although none of the above directly affects day to day price action of INTC, what it does do, is provide the fundamental backdrop; Portland and immediate vicinity is heading down and the pace is accelerating.

Intel Daily Close

At this juncture (11:38 a.m., EST), Intel is clawing its way back to test a potential trendline.

All lines are exactly parallel.

The grey trendline in the chart is there to show, we have repeating trendlines throughout the price action when taken from the left side of the trading channel.

If price action continues to struggle and closes near the level as shown (grey arrow), it’s a potential indicator that we have a right side trendline contact (not advice, not a recommendation).

Stay Tuned

Charts by StockCharts

Note:  Posts on this site are for education purposes only.  They provide one firm’s insight on the markets.  Not investment advice.  See additional disclaimer here.

The Danger Point®, trade mark: No. 6,505,279

Tesla … Reversal Target … $260

Short Squeeze Continues

Unless we reverse right here and now, Fibonacci retrace and projections (shown below) target the $260 – level for TSLA.

If you know what’s (potentially) coming, you can get ready.

The ‘Ponzi’ case for Tesla has already been established with this prior link, here. Of special note in that link, are the production percentages for General Motors.

Didn’t we just see another ’66’, at this link?

With all of that, let’s go out on a limb and project TSLA might top at 266, instead of the Fibonacci projected 260 (not advice, not a recommendation).

Tesla TSLA, Daily

The daily chart is compressed to show the entire down-wave and retrace from the November 4th, 2021, high.

Three retrace levels are shown (magenta); first is 23.6%, then 38.2% and labeled retrace of 50%, near the 259-level.

Moving closer-in, and including Fibonacci wave projection, while keeping the retrace levels, yields the following.

The chart’s a little bit busy but one gets the idea.

There’s a Fibonacci overlap of retrace and projection near the 259-260, level.

What’s another 6-points between friends to get to 266?

Next Steps

Of course, anything can happen and TSLA, could reverse to the downside on Monday.

However, if it continues higher, we’ll be monitoring for potential confirmation of the target and subsequent reversal (not advice, not a recommendation).

Stay Tuned

Charts by StockCharts

Note:  Posts on this site are for education purposes only.  They provide one firm’s insight on the markets.  Not investment advice.  See additional disclaimer here.

The Danger Point®, trade mark: No. 6,505,279

Intel … ‘Penny Stock’ by Year End ?

Trading Channel

Beginning next week, we’re about to find out if Intel (INTC) is on track to be a ‘penny stock’, by year-end.

Stocks trading below $5/share, are technically called ‘Penny Stocks‘, and mostly ignored by institutional money.

Dystopian Hell: The Stage Is Set

INTC, has already cut the dividend by 66% (note the symbolism) and is ‘conserving cash’.

A large part of their operation with 18,600 employees, is just outside Portland, Oregon.

Here’s a recent look at Portland, uploaded two months ago.

‘Gee honey. Let’s take the kids and move to Portland … Not.’

Incredible, that ‘Speck Protection’ is STILL being pushed (time stamp 2:11). How would you like to work at a location at this late date, where it’s normal to wear a mask?

So, it goes.

All of this brings us to the chart. The price action itself defines the next likely course (Wyckoff).

Intel INTC, Weekly Close

Last week closed testing underside resistance and potential right-side trend line contact (second chart).

Compressing the chart and expanding the downside scale, gives us the following.

Just in case anyone’s skeptical about ‘channels’ not being a real potential, here’s the latest look at Carvana (CVNA).

Carvana CVNA, Weekly Close

It’s important to note, not only the channel but the location of “No P/E”, which was the release of this post.

Carvana never closed higher after December 11th, 2021.

Intel, What’s Next?

Will it be the same for Intel?

Of course, that’s not known. Price action itself is the final arbiter; at this juncture, it’s at The Danger Point®

This is where the risk is least (not advice, not a recommendation).

If price action moves significantly higher from here, let’s say 5%, then we’ve likely bottomed and are heading into a rebound.

If not, and Monday, opens and closes lower, it may be a confirmation of the right-side trend line and potential trading channel (not advice, not a recommendation).

Let’s see what happens next.

Stay Tuned

Charts by StockCharts

Note:  Posts on this site are for education purposes only.  They provide one firm’s insight on the markets.  Not investment advice.  See additional disclaimer here.

The Danger Point®, trade mark: No. 6,505,279

Intel (INTC) … Up To Test

Bar & Volume

Intel posted high volume and wide price bars during the week of February 24th.

The bearish case for INTC has been established; now (2:25 p.m., EST), price action is coming back to test the wide bars.

The daily charts below show we’re in a trading channel with a potential contact, today, tomorrow, set-up (not advice, not a recommendation).

Intel (INTC), Daily

Longer term view

Moving closer-in

Note the wide bars and volume.

Markets tend to come back and test these areas.

It’s the trader’s discretion of what to do at this juncture (not advice, not a recommendation).

We’re just providing the analysis and the probabilities.

Stay Tuned

Charts by StockCharts

Note:  Posts on this site are for education purposes only.  They provide one firm’s insight on the markets.  Not investment advice.  See additional disclaimer here.

The Danger Point®, trade mark: No. 6,505,279

Biotech … Breakdown, Breakout

‘The Court Jester’

Court jesters reveal truths like no other.

How appropriate then, that someone who typically plays the ‘village idiot’ comes out with the truth.

Whether the ‘false narrative’ is finally crumbling or not, is not directly related to analyzing price action.

It does, however, provide the backdrop.

The ‘Big Reveal’

The last update in biotech had this to say (emphasis added):

If this is the big reversal and biotech is the downside leader, unfortunately, that could mean a planned ‘reveal’ by the mainstream media.

What wasn’t known, was just exactly how the truth would come out. Now, we know.

All of which, brings us to the topic at hand: Biotech SPBIO.

It turns out, SPBIO, is trading most consistently, on a three-day pattern.

Biotech SPBIO, 3-Day

In Wyckoff terms, the market itself defines what timeframes and what support/resistance levels are important.

Next up, we’re going to invert the chart to mimic the price action observed on the leveraged inverse fund LABD.

Biotech SPBIO, 3-Day, Inverted

And now, the characteristics of this sector the market itself, has revealed.

At this juncture, SPBIO, trades in a sequence of 3-Days after which, if there’s a directional move, continues on for nine consecutive bars.

After nine-bars, price action typically enters a correction for an undetermined amount of time.

After the correction’s compete the market has (in the past) continued on a directional move for another nine-bars.

Then & Now

We’re currently in a directional move that’s five ‘3-Day Bars’ in thus far.

If the market adheres to its prior behavior(s), we have at least four more ‘three-days’ to go (not advice, not a recommendation).

Note, the current reversal was identified to the day, with this update:

“However, today’s action is consistent with resolution of the five-months of congestion (not advice, not a recommendation).”

The fact the congestion period for SPBIO has taken so long to (apparently) resolve itself, has produced the potential for price action to go farther, last longer than anyone would normally expect.

That move if it happens, connects well with the introduction at the top of this post; a large part of the public has been informed in no uncertain terms, it was all a lie.

The needle, and the damage done.

Stay Tuned

Charts by StockCharts

Note:  Posts on this site are for education purposes only.  They provide one firm’s insight on the markets.  Not investment advice.  See additional disclaimer here.

The Danger Point®, trade mark: No. 6,505,279

Real Estate … After The Reversal

Trading, In The Cannel

Real estate reversed at Fibonacci Week 34, on schedule, as identified in this update.

Since then, it’s been three weeks of closing lower.

‘Boots on the ground’, have been done by numerous YouTubers such as Jerrimiah Babe, Economic Ninja, Dan from i-Allegedly, and others.

Real estate from a fundamental standpoint is in free-fall (not advice, not a recommendation).

Supporting data can be found at this link; time stamp 3:10 and 5:25, specifically for real estate.

From the realm of ‘You can’t make this stuff up’, go to time stamp 7:25, in the above link and look at the price of Telsa.

However, let’s not wander too far off and get back to the ‘implosion du jour’, real estate. 🙂

Real Estate IYR, Weekly

If this channel is in-effect, meaning the ‘demand’ side is a long way down, the trading potential is enormous (not advice, not a recommendation).

With that said, let’s look at the daily chart and potential Put option trade.

Real Estate IYR, Daily (Close)

The market itself, the weekly above, has shown us it’s following a Fibonacci sequence … for now.

Getting down to the daily, on a close basis, we’re presenting one of an infinite number of potential moves.

It’s the upward move (if it happens) to test the channel line that’s the spot to watch.

During such a rebound, short dated put options would be decreasing in price significantly.

According to the economic calander, next Friday March 3rd, will have Fed representatives speaking at 11:00 a.m. and 3:00 p.m., EST.

Stay Tuned

Charts by StockCharts

Note:  Posts on this site are for education purposes only.  They provide one firm’s insight on the markets.  Not investment advice.  See additional disclaimer here.

The Danger Point®, trade mark: No. 6,505,279

NVDA & SOXX … Risk Reduced ?

At The Danger Point®, Where Risk Is Least

It does not get much better than this.

The weekly chart of semiconductor index SOXX (below), shows we’ve already had the Wyckoff up-thrust, the reversal.

All that was missing was the test. That is, until today.

The reportedly ‘good news‘ from Nvidia has given the SOXX the excuse to test its reversal.

Pre-market action has Nvidia itself is up +10.61%, and the SOXX currently up +2.42% (8:32 a.m., EST).

Conversely leveraged inverse fund SOXS is down – 7.15%. This is the opportunity (not advice not a recommendation).

Semiconductor Index SOXX, Weekly

With the SOXX open set for higher, risk on a short position (via 3X Leveraged Inverse SOXS) may be reduced as much as the market is going to allow.

Less risk is NOT, no risk.

The market is going through its natural tendencies, and this is an area where there could be a short opportunity (not advice, not a recommendation).

Stay Tuned

Charts by StockCharts

Note:  Posts on this site are for education purposes only.  They provide one firm’s insight on the markets.  Not investment advice.  See additional disclaimer here.

The Danger Point®, trade mark: No. 6,505,279

Short Covering, Into The Close ?

Watch For The Weakest

With today’s heavy downward action, as we head into the close, any number of scenarios could play out.

Work has already been done on INTC, KMX, MRNA, Biotech Leveraged Inverse LABD, and others.

With such a decisive push lower, there could be some kind of short covering late in the session.

For example, as of this post 2:15 p.m. EST, KMX (detailed below) appears to be coming off the day’s lows.

CarMax Weakness

The daily chart has KMX, right a the bottom of a trading channel.

Price action may continue to rebound from this area heading into the close or not.

If there’s a rebound, naturally Put options will begin to decay in value … a desired outcome if one is looking to enter short (at the cheapest price possible).

The bottom of the channel line could be all there is for this week or we could be heading to much lower levels.

It’s up to the trader/speculator to decide (not advice, not a recommendation)

Stay Tuned

Charts by StockCharts

Note:  Posts on this site are for education purposes only.  They provide one firm’s insight on the markets.  Not investment advice.  See additional disclaimer here.

The Danger Point®, trade mark: No. 6,505,279