Repeating Pattern

During the last multi-year, market melt-down from ’07 – ’09, Cadence Design Systems (CDNS) crashed over -90%, in a relatively ‘well-behaved’ collapse.
‘Well-behaved’; straight down, sideways, then straight down again.
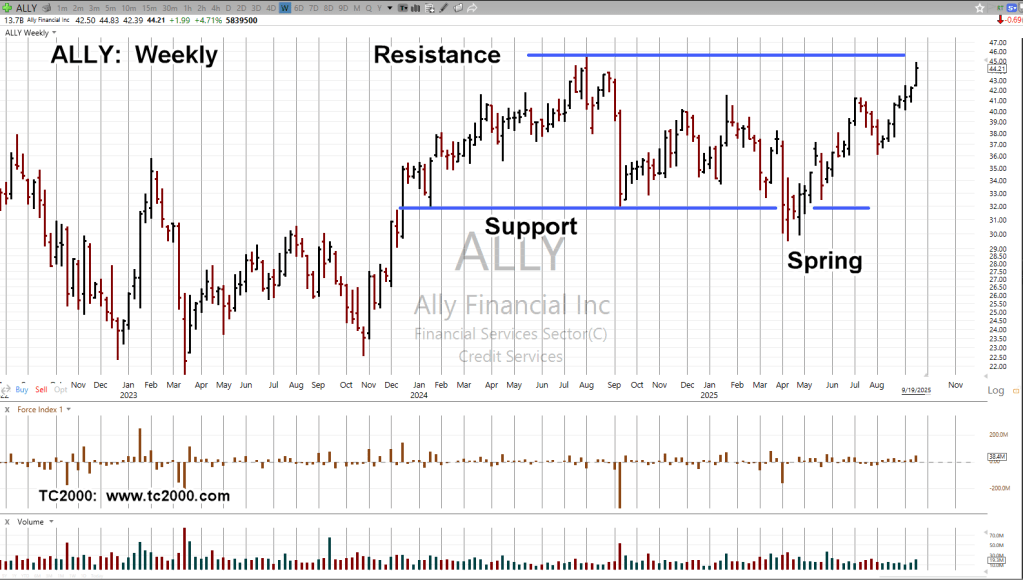
Looking at the current price action on a closing basis, we see the ominous (potential) pattern of Spring-to-Up-Thrust.
Cadence Design Systems, CDNS, Daily Close
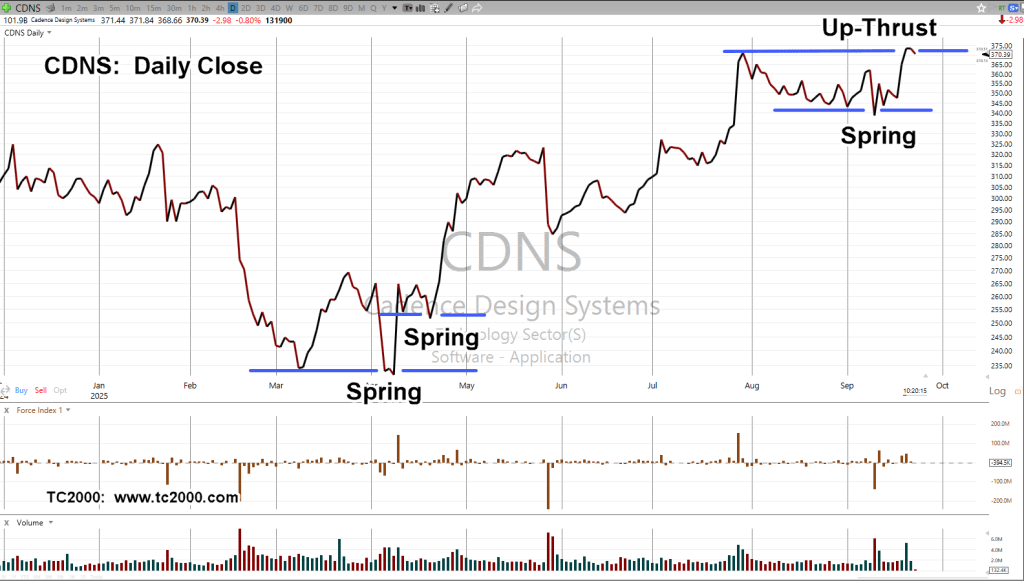
Other Wyckoff ‘spring’ set-ups are noted.
However, this time around, we may be in up-thrust (reversal) condition.
The next earnings release is late October; there’s time to assess action (if/when short) before any Kabuki theater (not advice, not a recommendation).
Stay Tuned
Charts by StockCharts
Note: Posts on this site are for education purposes only. They provide one firm’s insight on the markets. Not investment advice. See additional disclaimer here.
The Danger Point®, trade mark: No. 6,505,279