Moderna … Options Strategy

Trend Contact … Then, Pivot Down

With a potential right-side trend (and channel) contact confirmed; shown below at – 86% annualized, odds are now favorable for a Put strategy.

In addition to the technical factors discussed, listed at the bottom of this post are no fewer than 22-links to the current fundamental state of biotech and their ‘handiwork’.

The weekly chart of MRNA, has a Wyckoff Up-Thrust and a test, confirmed by the downside pivot.

Moderna MRNA, Weekly

Notice the reversal action took place at a very weak Fibonacci 23.6% retrace.

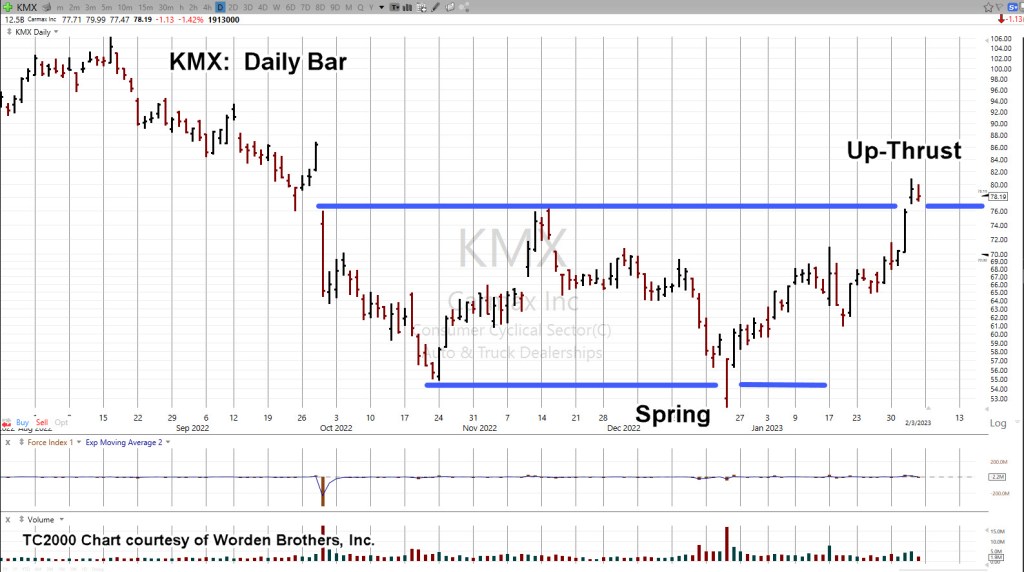
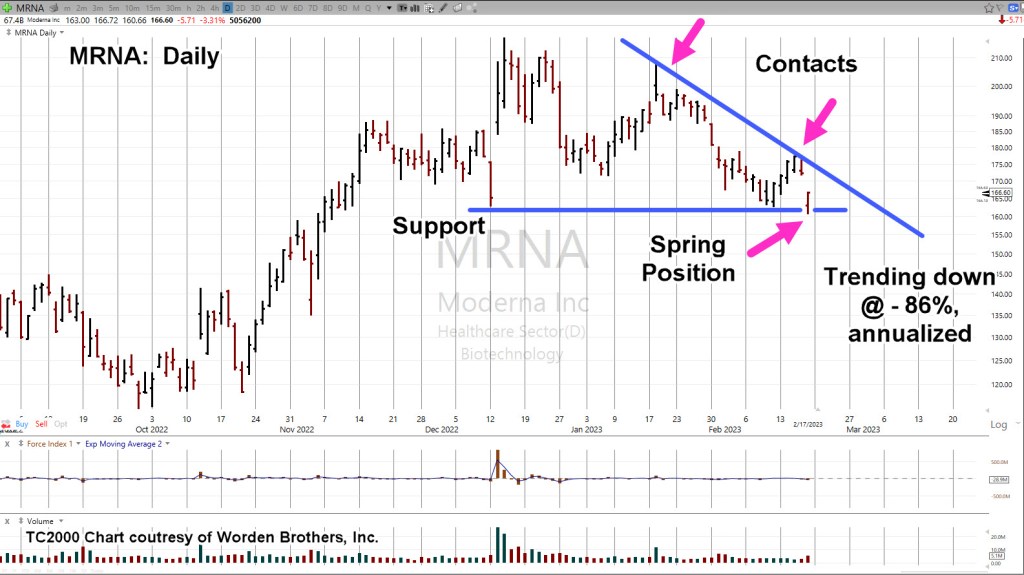
The two blue lines on the daily chart (below) are exactly parallel.

The grey lines are parallel to the blue lines and intended to show MRNA, exhibits a repeating (downtrend) pattern.

Moderna MRNA, Daily

The expanded version on the daily has support being penetrated (horizontal blue line) and then ‘spring’ action last Friday as a result.

Of course, it’s ‘what happens next’, that’s the question.

In a prefect scenario, price action would thrust lower for a day or several days and then come back up to test the underside of resistance.

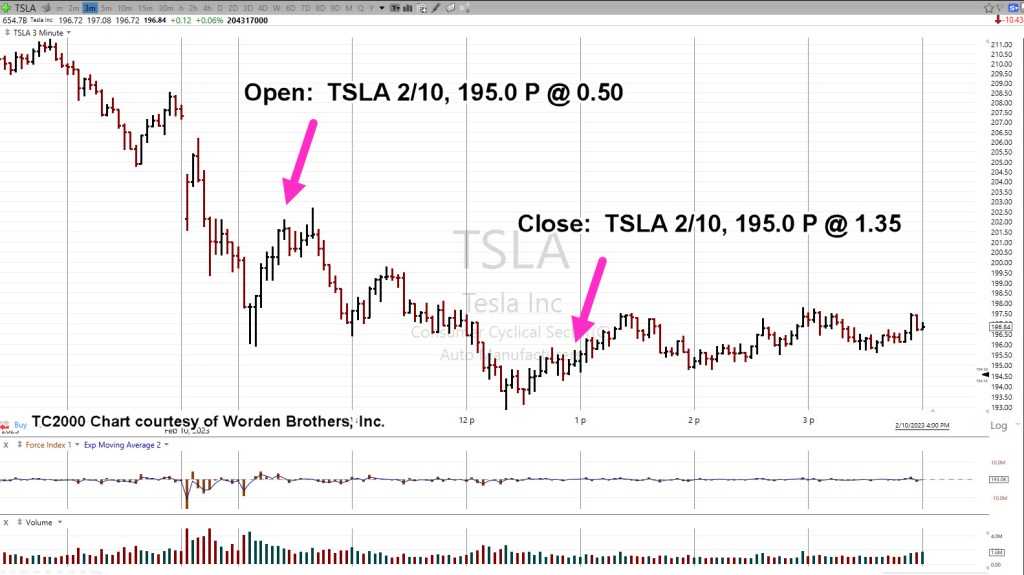
Elder Option Strategy

This strategy is taken from Elder’s book ‘Come Into My Trading Room’, and seeks to use as short-dated options as possible.

Doing so, requires the discipline to wait sufficient amount of time for price action to get into position and for option time value to bleed-off.

Potential Upside

Since we’re already in spring position and price action moved off the lows on Friday, MRNA could continue the upside right back to, or past the downtrend line.

However, with massive (undeniable) fundamentals building buy the day, and MRNA being mentioned specifically in at least one link below, probabilities favor the downside.

Supporting Links For The Bearish Stance

Florida Surgeon General Warns Life-Threatening VAERS Reports Up 4,400 Percent Since COVID-19 Vaccine Rollout

US Says Government, Not Moderna, Should Face COVID-19 Vaccine Lawsuit

New Medical Codes For COVID Vaccination Status Raise Concerns Among Experts

Watch: Rand Paul Grills School Of Nursing Head On Student COVID Vaccine Mandate

US Navy Lifts COVID Vaccine Mandate For Sailor Deployment

Mainstream Media Continues To Push False ‘COVID Heart’ Narrative To Explain Excess Deaths

NFL Players’ Association Urged To Screen for Heart Issues Over Vaccine Side Effects

WHO Suddenly Shelves Plans For Second Phase Investigation Into Origins Of COVID-19: Report

Watch: CDC Director Suggests It Will Never Change Child-Masking Policy

Rand Paul Introduces Bill To Halt Funding For Hospitals Denying Care To The Unvaxxed

Welfare State Weakens… 30 Million Americans Are About To Lose ‘COVID’ Food Stamp Handouts

IMF Says World Needs To Prepare For The “Unthinkable” After COVID, War In Ukraine

COVID Emergency, Climate Emergency: Same Thing

Novavax To Sell US Government 1.5 Million More Doses Of COVID-19 Vaccine

“World’s First” Unvaccinated Dating Service Launches In Hawaii

Living The Lie

‘COVID-Curing’ Sorrento Therapeutics Plunges After Filing For Chapter 11 Bankruptcy Protection

What Can We Learn From The Biggest Lies People Believed About COVID?

Censorship Operations: COVID, War, And More…

CDC Director Defends Mask Mandates After New Study Shows Masking Has Little Effect

Bivalent COVID Vaccines Perform Worse Against Variant Now Dominant In United States: Studies

COVID NEWS COMPILATION WITH NUMBER 33

Stay Tuned

Charts by StockCharts

Note:  Posts on this site are for education purposes only.  They provide one firm’s insight on the markets.  Not investment advice.  See additional disclaimer here.

The Danger Point®, trade mark: No. 6,505,279

Options Trade … Intel (INTC)

Looking For The Set-Up

Intel’s a dog … and has been for a very long time.

How do we know that? The price action itself, tells us.

Looking at the weekly chart of INTC, overlaid with the SOXX (thin black line), it’s clear, things literally went south for INTC, right around April, of 2021.

Intel reversed while the sector, the SOXX continued higher.

It’s what happened next, that’s important.

Intel INTC, With SOXX, Weekly

Note how the SOXX has rebounded since mid-October last year while Intel has remained flat.

Even with all the market manipulation to keep the major indices trending higher, having the public thinking ‘the consumer is strong’, INTC has languished.

This lack of upward price action in a rising market, indicates significant weakness.

Has Intel reached a bottom? This is the ‘dip’, isn’t it?

‘Go ahead, make my trade‘. 🙂

As always, anything can happen and INTC, could launch higher from here. However, it’s not likely.

It’s a juggernaut and at the moment, heading lower.

All of which brings us to the set-up: Options trade to the short side.

Intel INTC, Daily

For a viable Put trade, at least two criteria need to be met (with downtrend already established) and those are: Option time bleed, and what’s called ‘price instability’ or a ‘test’.

The daily close of INTC, shows a prior set-up (‘Test’) and now, at the far right of the chart, forecasted action.

A possible time for the ‘test’ if it occurs would be this coming Wednesday as that makes it ‘Day 13’ from the high on February 3rd.

That day would also coincide with the Fed minutes being released at 2:00 p.m., EST.

Note: When Fibonacci time counts are involved, it was determined years ago (by my firm), when the U.S. market is closed for a holiday and the rest of the world markets are open, it can (and sometimes does) count as a Fibonacci trading day.

Therefore, with world markets open this Monday, and the U.S. closed, it may still count as a Fibonacci trading day.

That in turn, could make this Tuesday ‘Day 13’ (not advice, not a recommendation).

Stay Tuned

Charts by StockCharts

Note:  Posts on this site are for education purposes only.  They provide one firm’s insight on the markets.  Not investment advice.  See additional disclaimer here.

The Danger Point®, trade mark: No. 6,505,279

Bond Breakdown … Rates Higher

Nail, In The Coffin

If there was any remaining hope for the economy, the next leg lower in bonds (with rates higher) should just about take care of it.

Of course, if one knows what’s likely to happen, then preparations can be made.

The breakdown in bonds is already underway and this morning’s pre-market action (as of 9:08 a.m., EST) is more of the same … down.

The daily chart of bond proxy TLT, shows the wedge and measured move. With that said, there’s no guarantee of bonds heading lower, just probabilities.

Also, if bonds go lower there’s nothing that says they can’t just keep going … with rates ever higher.

Bonds TLT, Daily

Of course, one does not have to sit idly by and watch their account(s) be decimated with persistent down moves.

Leveraged inverse bond fund TBT, has been around a long time; it’s a viable tool to either hedge positions or trade outright (not advice, not a recommendation).

Leveraged TLT, Inverse: TBT, Daily

Within the past two weeks, TBT, is up over +11%, which is quite respectable for a bond fund.

Stay Tuned

Charts by StockCharts

Note:  Posts on this site are for education purposes only.  They provide one firm’s insight on the markets.  Not investment advice.  See additional disclaimer here.

The Danger Point®, trade mark: No. 6,505,279

Newmont, Approaching “Free-Fall”

Ratcheting Its Way Down

Newmont (NEM) price action’s working its way lower to a ‘free-fall’ area; shown below.

Depending on behavior if or when it gets to this area, there could be an acceptable set-up to execute an ‘Elder-type’ Put option (not advice, not a recommendation).

That Put strategy has already been discussed but for those who may be new, it’s basically a short-expiration, out-of-the-money Put for maximum (potential) gain.

A completely counter-intuitive approach to the standard method of long-dated entries, then ‘wait’ while the value burns down to nothing.

Newmont Mining NEM, Daily

The compressed chart has the big picture; Newmont’s all-time highs were reversed on April 18th, 2022.

It’s currently in the process of finding its long-term bottom which is possibly far away from current levels.

The next chart gets close in on the potential set-up.

If price action follows its current down-trend, NEM may reach the potential free-fall area late next week.

Stay Tuned

Charts by StockCharts

Note:  Posts on this site are for education purposes only.  They provide one firm’s insight on the markets.  Not investment advice.  See additional disclaimer here.

The Danger Point®, trade mark: No. 6,505,279

ccc

The Netflix, Set-Up

Another ‘Implosion’, Waiting To Happen

Get woke, go broke, right?

Corporations control the ‘woke’ part.

What can’t be controlled is when the ‘broke’ part shows up.

We can, however, discern a potential inflection point … or, points.

In the case of Netflix (NFLX), that inflection appears to be happening now (not advice, not a recommendation).

Netflix NFLX, Weekly

Two weekly charts are shown.

The first has the terminating wedge, tentatively confirmed with last week’s new weekly low (below NFLX: 348.71).

The second chart shows the Fibonacci retrace to the 38.2% level; if there’s a reversal and the level holds, it indicates weakness and higher probability for continued downside action.

Note how the wide, high-volume bar of week ending 4/22/22, has been completely retraced.

This is what markets do; they tend to come back and test wide, high-volume areas.

In the case of NFLX, that test required about 40-weeks to accomplish.

Summary & Strategy

Price action itself will define the potential strategy (not advice, not a recommendation).

Based on where the overall markets closed on Friday, the expectation is for more downside action at the next open, then followed by a retrace that day, or the next.

If it happens, we’ll look at NFLX, on the daily chart for additional set-up clues.

Stay Tuned

Charts by StockCharts

Note:  Posts on this site are for education purposes only.  They provide one firm’s insight on the markets.  Not investment advice.  See additional disclaimer here.

The Danger Point®, trade mark: No. 6,505,279

Tesla Top, and Fibonacci

Options Day-Trade, Nets … 170%

It’s no secret that Tesla’s a Ponzi scheme mania.

Its current market capitalization is over ten-times that of General Motors (GM); a company that’s been in business, since 1908.

GM’s auto production numbers for 2022, were 66% higher (imagine that), than Tesla’s 1.37-million; provided, that we actually believe any of the data. 🙂

If we take Tesla’s market cap as of Friday’s close (654.7bln) and divide it by the closing price of 196.89, we get 3.33.

You can’t make this stuff up.

The TSLA market has ultra-high liquidity and is highly emotional (like the gold market). That liquidity lends itself to Fibonacci-based analysis.

We’ll get to the analysis but first, the options trade.

Tesla TSLA, Option Trade: 3-minute Chart

We’re trading the day of expiration 2/10, and the value is decaying rapidly. The entry of 0.50 was about where the option closed on the prior session.

Note, the entry was made on the way up … extremely difficult to stomach selling short, on an expiring position, as the price is rising.

Option was closed when it was obvious there was no more downside for the day. Since it was a 195.0 Put, it expired worthless at the end of the session.

Now, on to Fibonacci.

Tesla TSLA, Daily, with Fibonacci Projection(s)

The chart shows how precise the moves have conformed to Fibonacci.

We’ve included the “3.33”, as mentioned above; it will be interesting to see what happens at the next open.

After-hours activity was down – 2.31 pts, on 2,486,196 shares, according to BigCharts.

Depending on subsequent price action, the next update will address the Fibonacci downside projections.

Stay Tuned

Charts by StockCharts

Note:  Posts on this site are for education purposes only.  They provide one firm’s insight on the markets.  Not investment advice.  See additional disclaimer here.

The Danger Point®, trade mark: No. 6,505,279


Tesla … At The Top

Terminating Wedge

Technically, the short-covering rally appears to be over.

Shown below, there was a minor wedge formed over the past two weeks that has been met with a measured move.

Pre-market action (9:10 a.m., EST) is lower; currently trading below yesterday’s low of TSLA 204.77.

We’ll get to that but first, a look at the forecast created back in November, last year.

Tesla TSLA, Weekly: November Forecast

Here is the link to the original post.

In that post, note there were two potential outcomes for price action. The charts below show that “Chart 2“, was the course chosen by TSLA.

Original Forecast

And … the result

Let’s move on to the daily and show the terminating wedge.

Tesla TSLA, Daily

It’s important to note that TSLA’s previous decline was ‘well behaved’. That means, it was orderly with few if any significant price gaps.

On the next move down, if it occurs, ‘well-behaved’ is not what comes to mind.

Notice on the short covering rally how there were at least three price-gaps higher … the last of which may be filled at the open today.

Summary & Strategy

We’re in the largest bear market in world history.

There is no sure way to ‘predict’ what will happen next (not advice, not a recommendation).

What can be done, is to identify probabilities.

At this juncture, TSLA appears to have completed its short-covering rally.

It’s now up to the trader/speculator to either stand-aside, or to enter the arena.

Stay Tuned

Charts by StockCharts

Note:  Posts on this site are for education purposes only.  They provide one firm’s insight on the markets.  Not investment advice.  See additional disclaimer here.

The Danger Point®, trade mark: No. 6,505,279

Biotech Bobsled, Starts … Down

Slowly, At First

Of all the major indices for today’s (Wednesday) session, biotech’s SPBIO, Leveraged Inverse Fund LABD, had one of, if not the largest gain @ +10.48%.

The last update identified two sectors to watch for short positioning: Real Estate IYR, and Biotech SPBIO; Short positioning via leveraged inverse funds DRV, and LABD, respectively (not advice, not a recommendation).

Since that post, DRV is up + 1.74%, and LABD is up + 8.58%, both measured on a close basis.

The ‘Big Reveal’

Remember: When price action turns south, that’s when the bad news comes out.

If this is the big reversal and biotech is the downside leader, unfortunately, that could mean a planned ‘reveal’ by the mainstream media.

Anyone going to alternative sites such as BitChute, ZeroHedge, Rumble, know full well what’s happening.

Maybe we’ll have another distraction like the 100-th (at last estimate) food processing plant fire or even something totally retro, like a balloon flying across … oh, wait. 🙂

Biotech SPBIO, Leveraged Inverse LABD

We’ll get straight to the point as prior updates have built a substantial case for a long term, significant reversal.

Recall, LABD is the leveraged inverse of SPBIO. The daily chart shows the current set-up.

This site does not provide investment advice.

With that said, one could infer from this prior post (at the bottom), a position in LABD had already been established and included a hard-stop.

That was indeed the case.

Next Steps

There’s no guarantee on how far or how long a directional move will go.

However, for SPBIO, one can observe since the February 2021, reversal from all-time highs, a sustained, directional move typically lasts 4 – 6 weeks.

The next update will show the best chart timeframe (multiple days) that resulted in capturing the majority of the directional moves since the February 2021-high.

Stay Tuned

Charts by StockCharts

Note:  Posts on this site are for education purposes only.  They provide one firm’s insight on the markets.  Not investment advice.  See additional disclaimer here.

The Danger Point®, trade mark: No. 6,505,279

The Moderna ‘Channel’ … Redux

… And The Weekly, ‘Summary & Strategy’

The last update about our chief cook and bottle washer of gene ‘modification’ had this to say about price action.

“We’re about forty minutes into the session; Moderna (MRNA) has just confirmed the up-thrust reversal discussed in the last update“.

From that point Moderna (MRNA) declined for seven weeks for a total of around – 31.5%.

However, that’s not the most important part.

In that update, a trading channel was shown which at the time, was declining at – 93.7%, on an annualized basis.

Well, the channel is back.

Only this time, probabilities and price action have come together to set up for a potential sustained decline.

Moderna MRNA, Weekly

Above, we have a Wyckoff ‘Up-Thrust’ and a test that has since turned lower.

Next, we have a series of repeating trend or channel lines.

Additional data has modified the downward slope to be declining at approximately – 90%, annualized.

From a fundamental standpoint, the data set is enormous on the events of the past three years.

At some point that data could provide a huge tailwind for downside action.

For now however, let’s stick with what price action is telling us and go to the Summary & Strategy

Summary & Strategy

The past week has identified two areas of position or trade execution and two areas for possible short-term options execution (not advice, not a recommendation):

Position or Trade: Real Estate IYR, and Biotech SPBIO

Options: Carmax KMX, and Moderna MRNA

As a reminder, most if not all trade analysis is for the short side (not advice, not a recommendation).

Final Thoughts

Since we have possibly the largest bull trap in market history with huge numbers of VIX Call options, the following week may be subdued by going modestly up, sideways or down, slowly.

With that said, options positioning (if any) could be slated for the week of 2/17/23.

As always, price action is the final arbiter.

Stay Tuned

Charts by StockCharts

Note:  Posts on this site are for education purposes only.  They provide one firm’s insight on the markets.  Not investment advice.  See additional disclaimer here.

The Danger Point®, trade mark: No. 6,505,279

CarMax … Dead Cat Bounce

That, Was Then …

Back in October last year, the update on CarMax, said this:

“… there could be small blip up to resistance in the 85-area before potentially rolling over into a descent that projects to the 4.00, level.

If and when that happens, CarMax rival Carvana, may be long gone; its disruptive vending machines possibly being used as homeless shelters or insect farms.”

Even with the short-squeeze mania last week, rival Carvana, remains down a blistering – 96.2%, from its all-time highs; having reached an interim low of – 99.1%, in December.

Insect farms, dead-ahead. 🙂

The ‘Bounce’

So, does getting to a high of KMX 80.92, meet the forecast of “the 85-area” ?

It looks close enough, but the real story is the bearish trade set-up.

I’ve lost track of the number of Wyckoff ‘Spring to Up-Thrust’, set-ups that have been covered since this post, over sixteen months ago; we now have another.

CarMax KMX, Weekly

Unmarked chart.

Long time users should be able to spot the set-up immediately.

For those new to the site or if more clarification is needed, here it is:

Getting down to the daily, is where a trading plan is created.

KMX, Daily

Several scenarios.

Three potential scenarios are below.

Remember, we’re in possibly the largest bull-trap in market history.

Those in control of the markets need to bleed-off the VIX Call options values by having the market go up, sideways, or down slowly (at first).

Here is the VIX Option expiration calendar for 2023-2025.

Going straight down at this juncture (although anything can happen), is not the most probable outcome.

Scenario No. 1

Lower open at the next session, followed by a labored move to test the underside of resistance.

The test can happen in one day or several days.

Scenario No. 2

Next up, is congestion tests before heading lower.

Scenario No. 3

Lastly, a steady but ratcheting move lower.

These are just three potential outcomes of an infinite number.

The market itself will give clues at the next session to the more probable outcome.

Summary

It may be after the 15th (past VIX option expiration), before there is a decisive move lower.

Not covered in this update is what happens if KMX, actually goes higher instead of lower. If that happens, we’ll post updates as necessary.

Stay Tuned

Charts by StockCharts

Note:  Posts on this site are for education purposes only.  They provide one firm’s insight on the markets.  Not investment advice.  See additional disclaimer here.

The Danger Point®, trade mark: No. 6,505,279