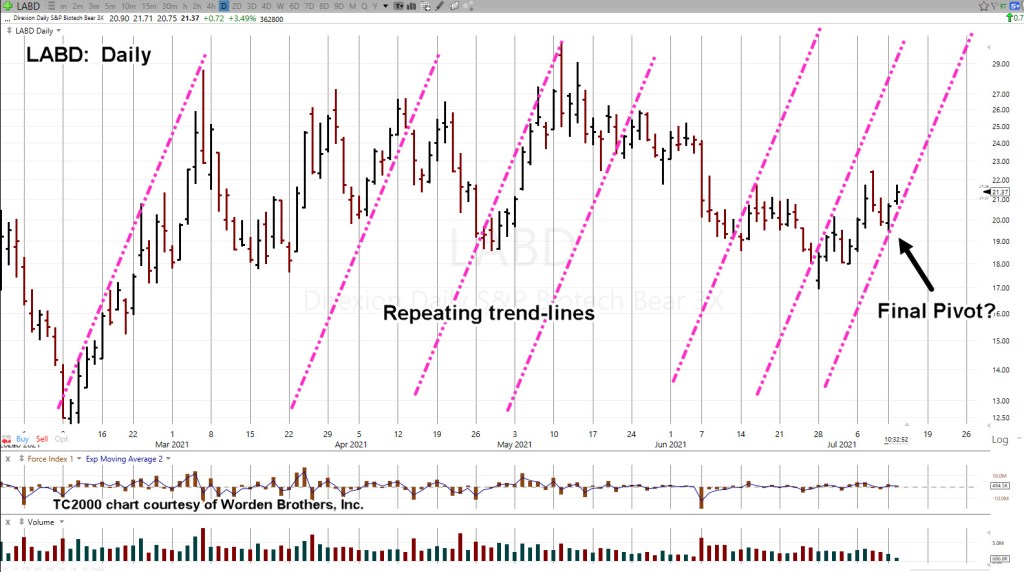
Inverse biotech, LABD above, is confirming a pivot.
The magenta arrows show contact points morphing into a pivot that has two more contacts.
The new trendline was copied, then pasted to the far left of the chart.
It’s clear the new (pivot) trend is identical to the one created when LABD bottomed out this past February.
While the overall markets (S&P, Dow, COMPX) are still showing green, biotech looks like it has started the next leg down.
The original short position via LABD, has remained intact (not advice, not a recommendation) and has been increased five times (including today) since the beginning of this month.
In our view, biotech’s signaling the potential for a very dangerous situation.
Biotech’s headed down and we’re already short; not advice, not a recommendation..
As Livermore said a hundred years ago, ‘surprises tend to happen in the direction of trend.’
Stay Tuned
Note: Posts on this site are for education purposes only. They provide one firm’s insight on the markets. Not investment advice. See additional disclaimer here.
‘If you can’t completely ignore the news and the financial press, you will never be successful in the markets’ (emphasis added).
In line with that, we have this: The very first sentence from this article out of barchart is questionable to say the least.
First:
There is no rapid ‘re-opening’. There never was. There is no ‘pent up’ demand.
Massive credit card usage shows the U.S. consumer has been decimated; using credit just to survive.
It should be (but somehow for some, it’s not) obvious we’re in a controlled demolition of the economy (including the food supply) on a world-wide scale.
Second:
Price increases are the result of supply chain (also, controlled demolition) shutdown not inflation.
Uneducated Economist has probably done the best job of ‘boots on the ground’ work to completely dispel the inflation false narrative.
He called the current and now waning lumber price spike two years ago. That’s how you know who to trust or believe. Take a look at their past analysis and see how it ‘aged’.
Third:
The U.S. population collectively, has never experienced real hardship. Those who made it through the Great Depression have all but died off.
There is no one around to give said population a swift kick in the pants and tell them to ‘suck it up’.
Northman Trader
Sven Henrich has come out with an excellent market update, linked here.
Towards the end of his analysis he states; ‘when the break comes, it will be quick, deep, keep going and most (if not nearly all) will be psychologically unprepared.’
Which brings us to biotech.
LABD Analysis:
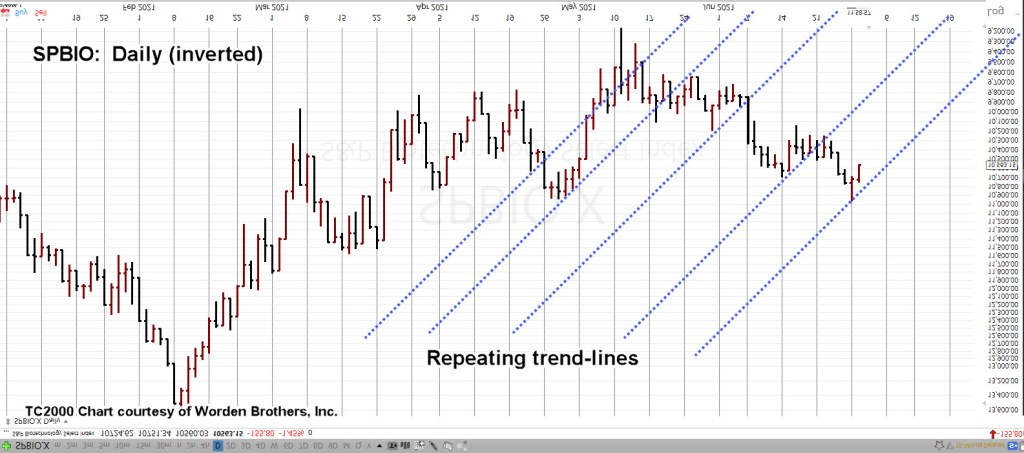
Biotech SPBIO, is back as downside leader: Down just over -25%, from its highs in February, this year.
The daily chart of (inverse fund) LABD is below. The market itself is showing us it wants to follow the repeating pattern of trendlines (not advice, not a recommendation).
If the entire structure (from the February low) is actually a trading channel, it’s hard not to overuse the word ‘massive’.
Non Confirmation:
As of this post, the Dow, the S&P and the Composite are unchanged to slightly higher. Yet biotech SPBIO, is down -1.2%.
We won’t know until it’s all over … but it looks like biotech could somehow be the catalyst (along with the dollar and gold?) that precipitates the final reversal in the overall market.
Stay Tuned
Note: Posts on this site are for education purposes only. They provide one firm’s insight on the markets. Not investment advice. See additional disclaimer here.
Events have been set in motion; not necessarily immediately but it has started nonetheless.
Market Positioning:
So, here we are going into the weekend.
Does anyone want to be long the market at this point (not advice, not a recommendation)?
There must be some that do as we’re still at elevated levels.
The trade approach implemented on this site (i.e., positioning short), takes into account and actually plans for a ‘disconnect’.
Only the inexperienced or naïve think (at this time in market history) they can get out as easily as they got in; i.e. day and swing trading.
Analysis: SPBIO (LABD):
We’ll start close in first and look at the hourly LABD:
Price action has come back to test the boundary (blue line).
As frustrating as it might seem (and it is), this is normal market behavior. The market itself has to define who is in control; bulls or bears.
It’s never ending.
That’s why a case has been built on the fundamental side; why biotech is subject to a massive implosion.
That backdrop, is being supported (little by little) with price action and thus, helps keep the mind focused.
If we pull out to the daily, we see the familiar trend-line(s):
We’re at another danger point. Price action can go either way.
If LABD pivots higher from here, it’s one more confirmation that we’re trending higher (SPBIO, lower) into our October-exit timeframe (not advice, not a recommendation).
Stay Tuned
Note: Posts on this site are for education purposes only. They provide one firm’s insight on the markets. Not investment advice. See additional disclaimer here.
This morning’s gap lower in SPBIO (LABD higher) was fully expected.
Expected as well, is the retrace in progress as of this post.
Today, is Fibonacci Day 8 from the LABD, pivot low of June 28th.
Biotech (SPBIO) has posted a fantastic time sequence on the daily as well as the weekly.
The gap-lower open in the S&P (more so for SOXX) has everyone sharpening their pencils; wondering, if ‘this is it?’.
It could be.
However, with attention now focused on potential downside, the clean Fibonacci sequences are likely to morph into chaotic movement.
The time for low-risk short positioning (not advice, not a recommendation) in this sector may be coming to an end.
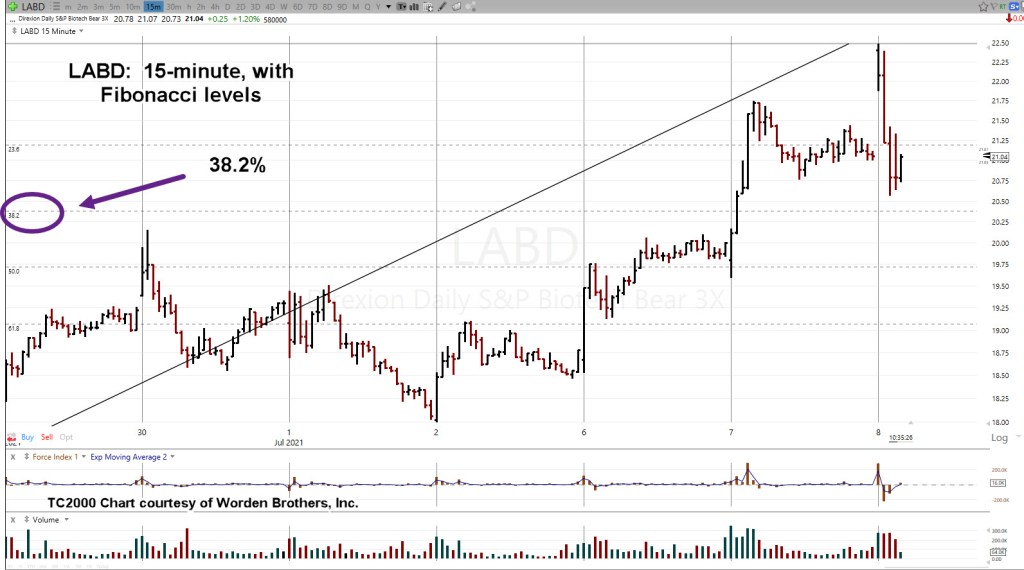
Looking at inverse LABD, and using the Fibonacci retrace tool, it’s likely price action will retrace to at least the 38%, level.
At this point, it’s already close:
The inverse biotech LABD, 15-minute chart (above) shows we’re near the 38%, level.
After today, the expectation is for price action to become SPBIO downside chaotic … long enough to frustrate the late-comers to the sector.
After that, and however long that is, price action may once again become orderly.
Stay Tuned
Note: Posts on this site are for education purposes only. They provide one firm’s insight on the markets. Not investment advice. See additional disclaimer here.
After BA pilot fatalities were confirmed, at least one airline is backing off from insisting their pilots are injected.
Some adverse reactions linked above, occurred in-flight; the pilot was incapacitated.
“Is there a pilot on-board?”
That could become a frequent call through the cabin intercom in the months … even years to come.
The bottom line implications are obvious.
The response to ‘back-off’ probably has nothing to do with safety and more to do with protecting those executive stock options.
Which brings us to the markets.
Analysis: SPBIO (LABD)
The last update for biotech said it was ‘about to get real’. So, it has.
Looking at SPBIO inverse fund LABD, we have the familiar trend lines:
The market itself says it wants to follow this trend.
Pulling out to the weekly, we get what seems to be an incredible picture.
At the beginning of the trade, the short position in SPBIO, via LABD (not advice, not a recommendation), had an exit time-frame during the second, or third week of October.
From an empirical and seasonal standpoint, that’s when on-going downtrends tend to reach their lows.
Already Baked In:
Various numbers are bandied about as to how many have been injected.
One estimate is 2-Billion, world-wide (Dr. Coleman if memory serves).
Total population at 7.9-Billion; 2-Billion, equates roughly to 25%
No matter what happens, de-population is already baked-in.
Stay Tuned
Note: Posts on this site are for education purposes only. They provide one firm’s insight on the markets. Not investment advice. See additional disclaimer here.
Looking at each, none of them even hint things could go wrong.
To be really cynical (and probably correct), the senior trading professionals may know this sector’s at risk of implosion.
They task junior employees to cover it; attempting to talk it up.
Analysis: SPBIO
Moving on to inverse fund LABD, we have Fibonacci correlation on two time frames:
In addition, from a Wyckoff standpoint, we’re in spring position on the weekly and daily time frames.
All of this points to high probability (not advice, not a recommendation) that biotech and specifically the weaker SPBIO, has pivoted to the downside (LABD higher).
Naming Names:
A couple of days ago, we had Dr. Yeadon (former Chief Scientist, Pfizer) absolutely grilling and eviscerating his interviewers, covered here.
Then, we have Dr. Coleman deciding to name, names.
Now, it’s getting real.
With this type of high-level pressure being applied from internationally known and respected (real) heroes, one has to think, it can’t be long before the lie is fully exposed; blowing the entire sector, wide open.
Stay Tuned
Note: Posts on this site are for education purposes only. They provide one firm’s insight on the markets. Not investment advice. See additional disclaimer here.
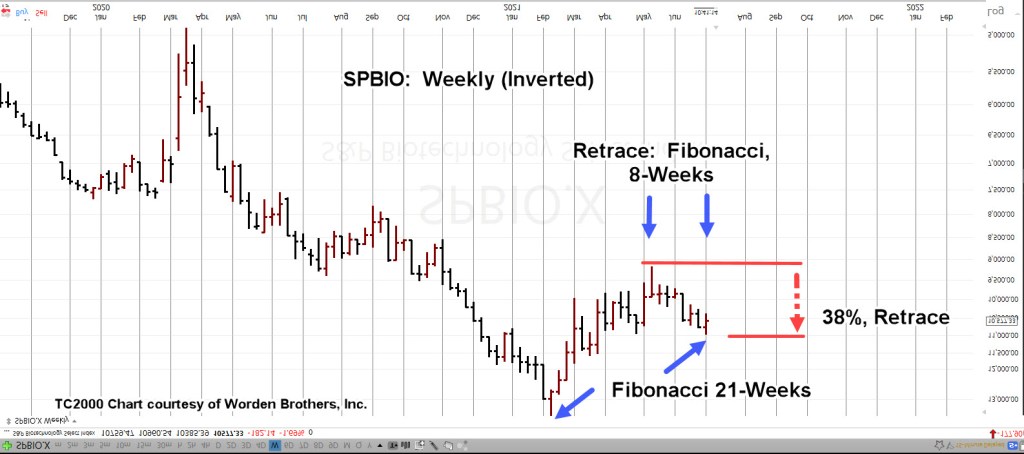
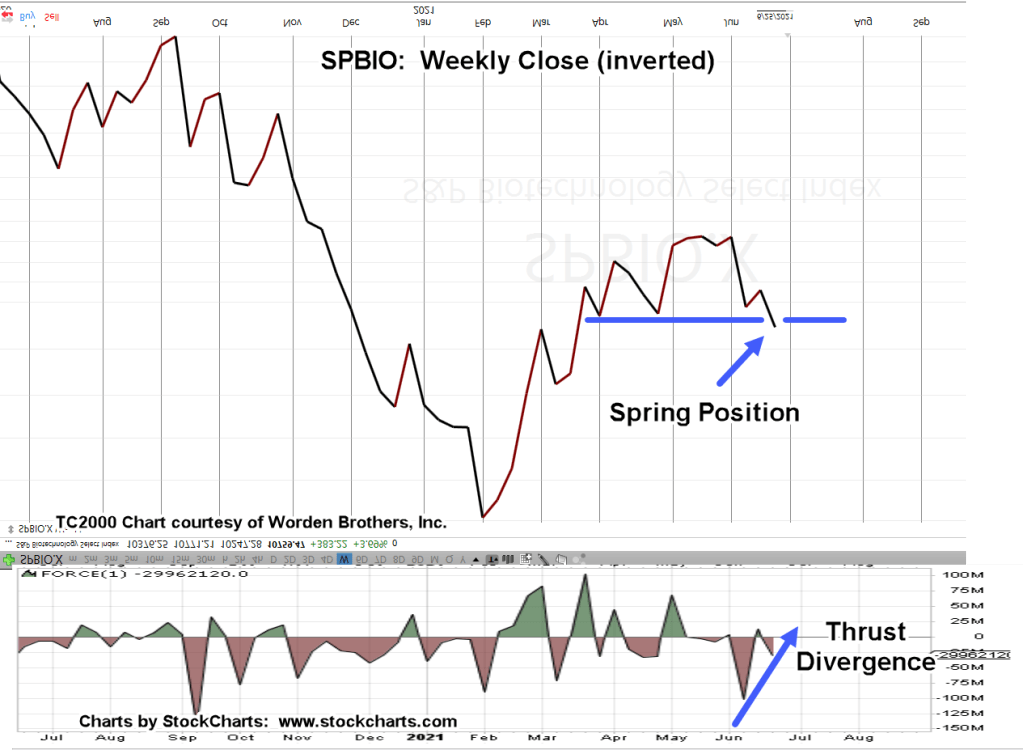
It’s a list of empirical observation that market tops (reversals) tend to occur during holiday weeks.
The weekly chart of biotech SPBIO (which has been inverted), shows a Fibonacci 21-weeks, from the all time high (low on the chart) to this week’s pivot:
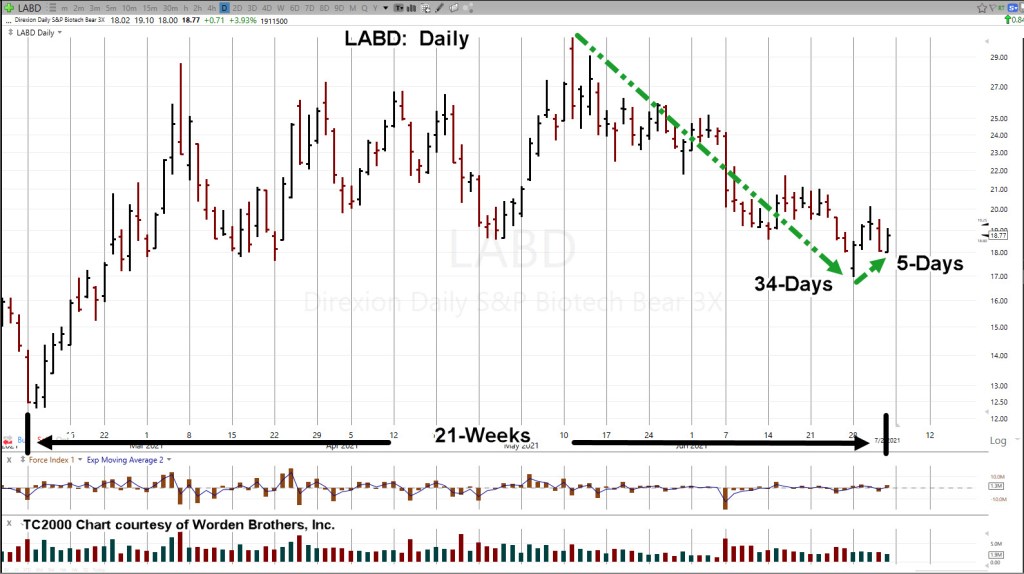
Not only is SPBIO adhering to Fibonacci time prints on the weekly, it’s doing it on the daily as well.
It was a Fibonacci 34 days to complete the 38%, retrace.
It was a Fibonacci 5 days to complete the most recent reversal and test; culminating early this session.
As stated many times, the bottom may fall out of biotech.
Someone or something in the criminal cabal is going to let loose; fully exposing the real intent of the entire operation.
Recall Prechter’s admonition; ‘price leads the news’
If SPBIO reverses at week 21, with a decisive move lower, it may not be long before news precipitates out into the mainstream.
We’re now two-hours into the trading day.
It’s typical for SPBIO, to begin its erosion (discussed here). Let’s see if it can retrace the sharp down move from the early session.
Stay Tuned
Note: Posts on this site are for education purposes only. They provide one firm’s insight on the markets. Not investment advice. See additional disclaimer here.
However, those fully immersed in their evil, are not aware when sentiment changes.
How can they be?
They don’t have the discernment (a God-given gift), that lets them know when the jig is up.
The statements made by the organization’s CEO listed in the title block, sorry, you’ll have to do your own search, we’re not providing links for what should be obvious reasons, has instantly brought the entire ‘charitable foundation’ schtick under suspicion if not outright exposure.
The visceral response to those statements was immediate.
Complexion of the so called ‘charitable’ industries has forever changed.
Has sentiment for the biotech euthanasia project changed also?
As always, price action is the final arbiter. Anything can happen.
Chart Analysis: Biotech, SPBIO
At this juncture biotech and specifically SPBIO, has pivoted decisively to the downside.
As with yesterday’s update, the daily SPBIO chart is inverted and annotated:
The ‘repeating trendline’ concept that’s been discussed for nearly the entire seven week corrective period, is included above.
This time, it looks like we’ve reached the right-edge.
Stay Tuned
Note: Posts on this site are for education purposes only. They provide one firm’s insight on the markets. Not investment advice. See additional disclaimer here.
Over the past seven weeks, as the biotech indexes worked their way through a corrective retrace, there were no guarantees we’d get such an obvious reversal.
A market disconnect could have happened at any time (and is still a possibility).
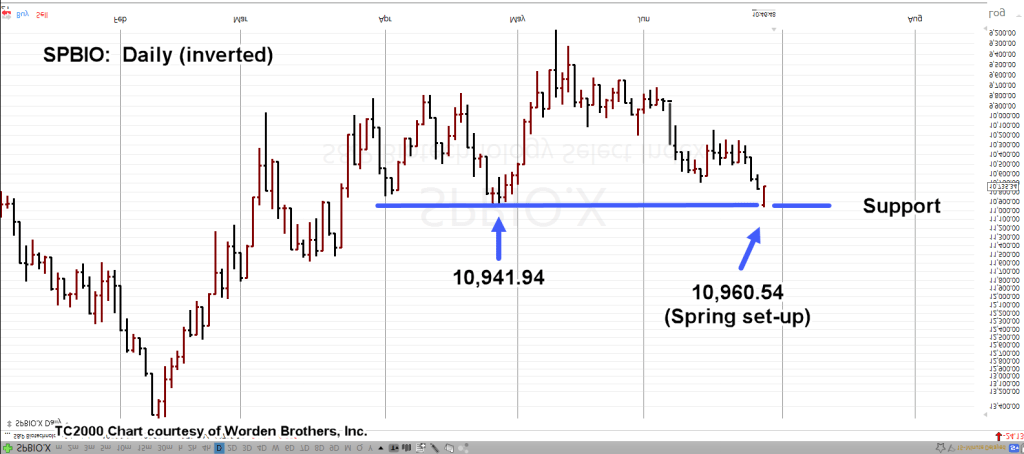
At this juncture with SPBIO, penetrating and rejecting a prior resistance area, we’re likely on the way to much lower levels.
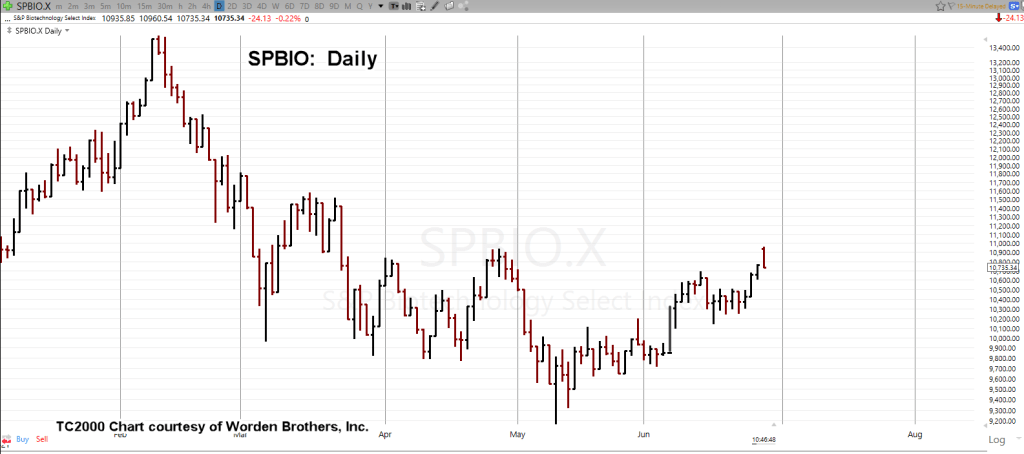
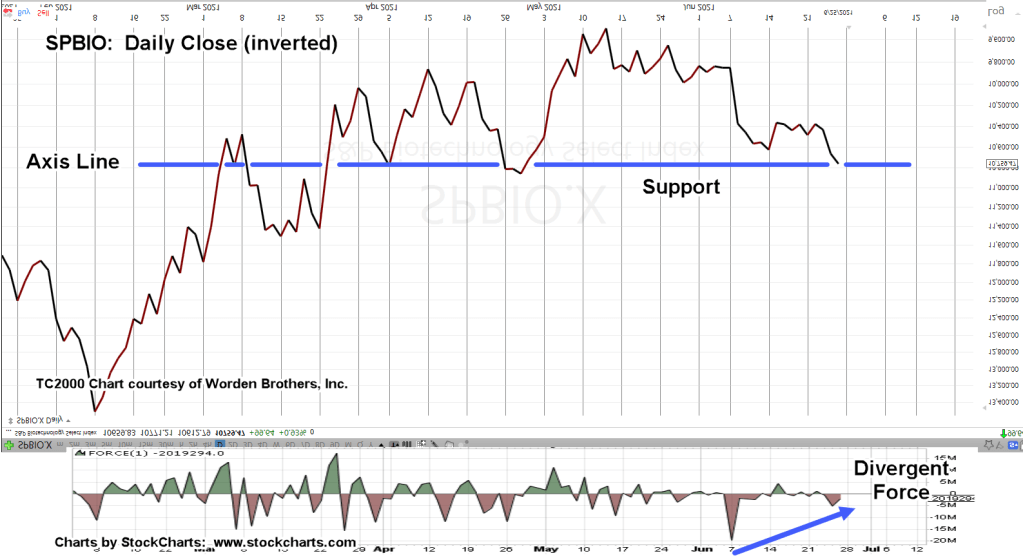
The daily SPBIO is below. The next chart has it inverted with notations added:
Inverted. Notations added:
We see penetration below the blue line support area. This sets up the Wyckoff spring condition (up-thrust, non-inverted).
The last update, showed thrust energy already divergent; set for reversal.
Note:
The criminal behavior within this sector continues to mount by the day.
Operating with impunity.
When, how, or if that breaks out into the open, is the big unknown.
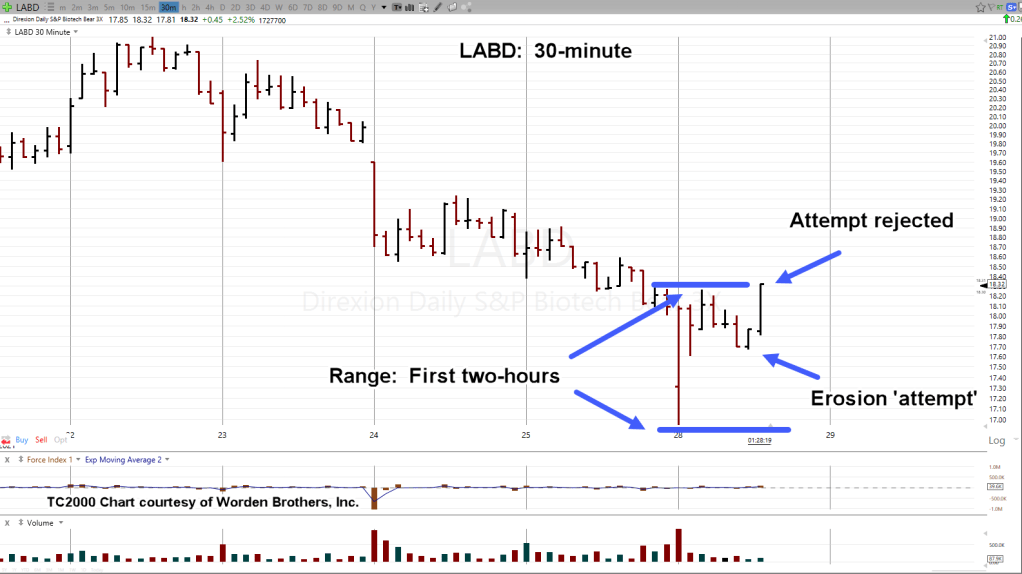
SPBIO, Character Change:
One of the benefits (if you can call it that) of having a position that’s eroding by the day, is that you get very intimate with the behavior of price action.
Consider it an ‘opportunity’ to focus the mind.
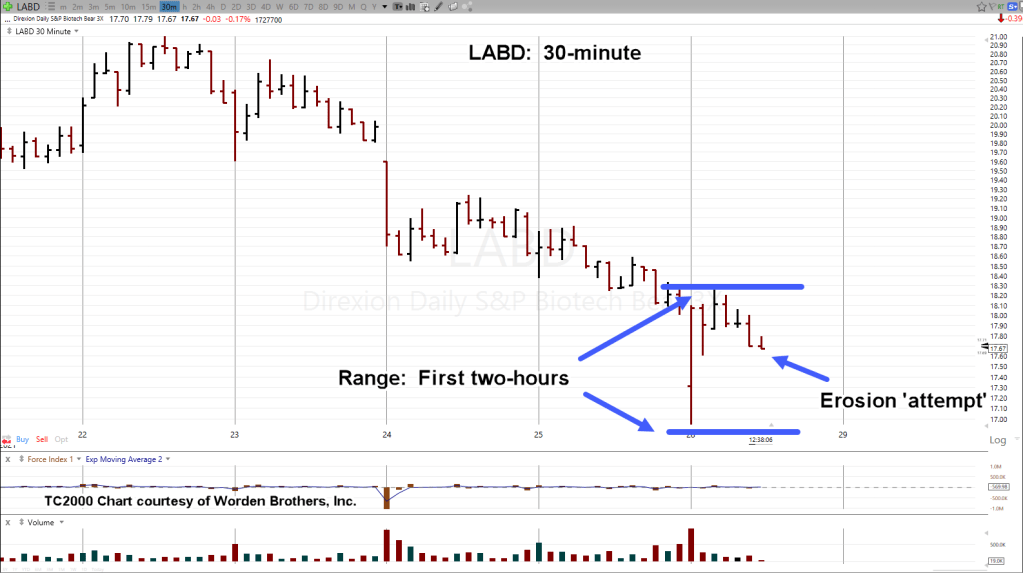
The typical behavior of SPBIO (and inverse LABD), is to establish the day’s trading range within the first two hours of the session.
Consider those two hours as the ‘head fake’ as that range is then eroded throughout the rest of the day.
Today’s session has been no different. A wide range established early but here’s the change; There’s been little, to no erosion.
As if on cue, during the third hour of trade, SPBIO attempted to erode the range. Inverse LABD, shown below.
However, that attempt appears to have been rejected:
As of this post, price action can’t get itself (appreciably) back into the early morning’s range. The character of the index has changed.
Stay Tuned
Note: Posts on this site are for education purposes only. They provide one firm’s insight on the markets. Not investment advice. See additional disclaimer here.
In the entire history of the market, that’s never happened before, either.
Biotech Backdrop:
We’ve got empirical and anecdotal evidence pointing to the real objective of the ‘experiment’; now, we’re fortunate enough to have a data analyst doing what the medical establishment used to do.
Note: Posts on this site are for education purposes only. They provide one firm’s insight on the markets. Not investment advice. See additional disclaimer here.