Government, Is Always Last

The laws enacted by the Government to prevent the crash of 1929, were passed in 1934.
So, now we have at least two states (here and here) eliminating sales tax on the purchase of gold and silver.
Where were they way back in 2001, as the metals were bottoming?
Interestingly (then again, not) it’s a Fibonacci 21-years, nearly to the day, from that 2001 bottom.
That’s not the only Fibonacci correlation being observed.
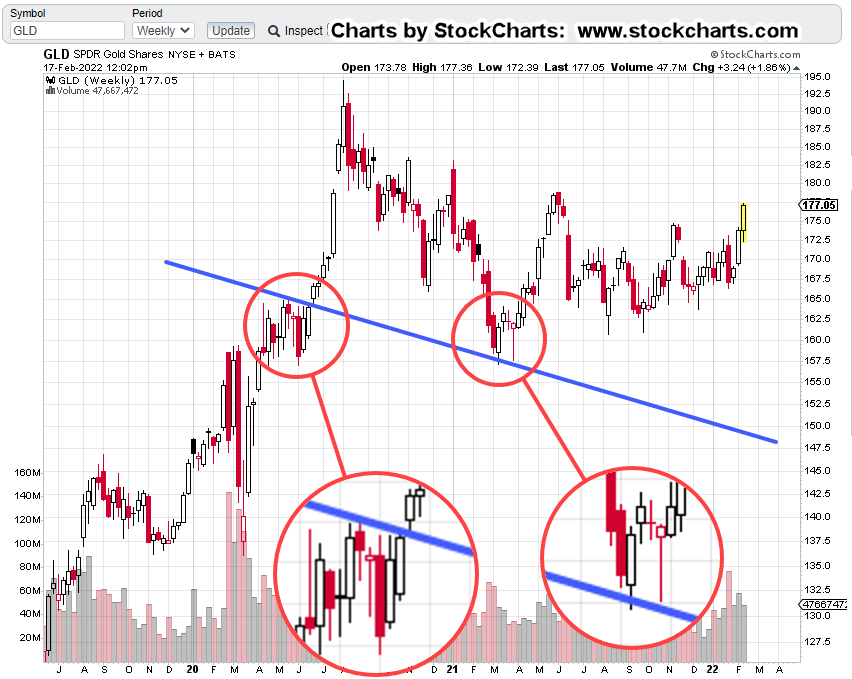
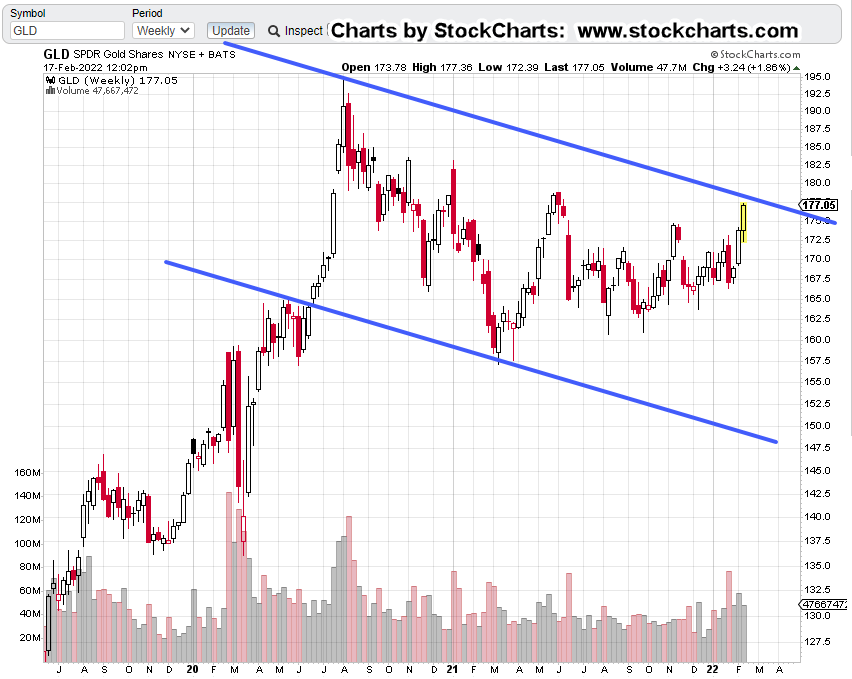
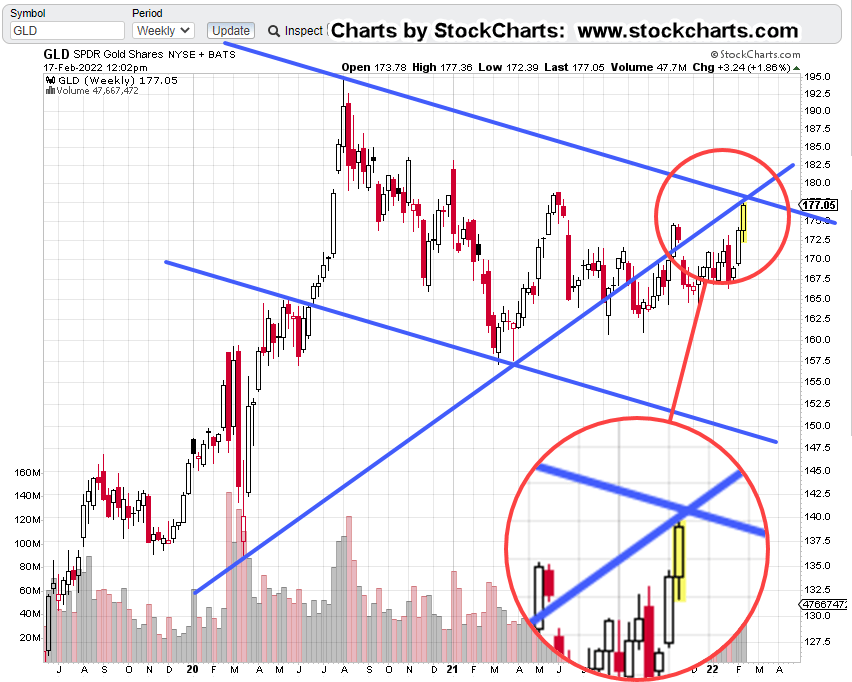
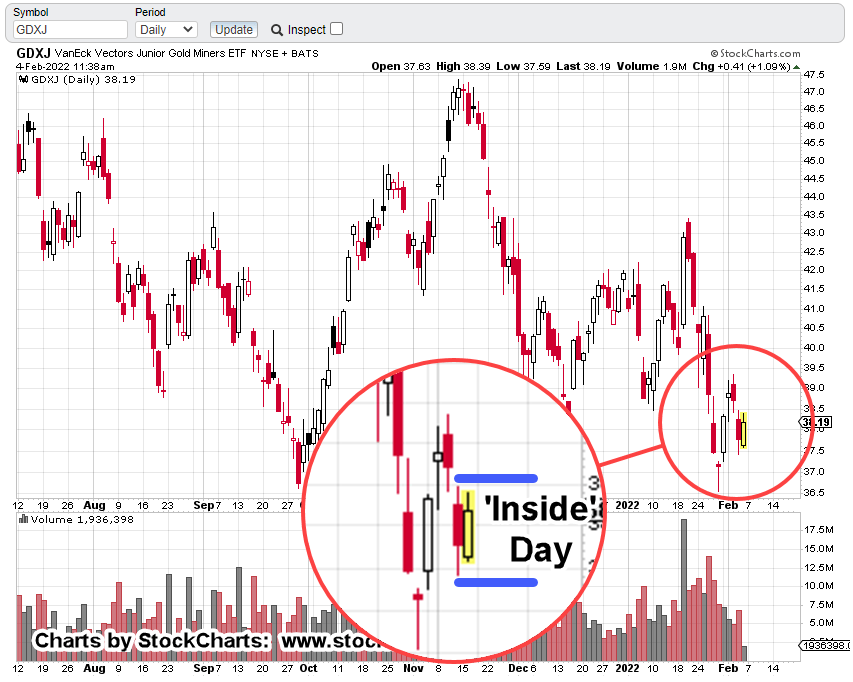
Let’s take a look at Junior Miners GDXJ, and see if it too, has a Fibonacci event.
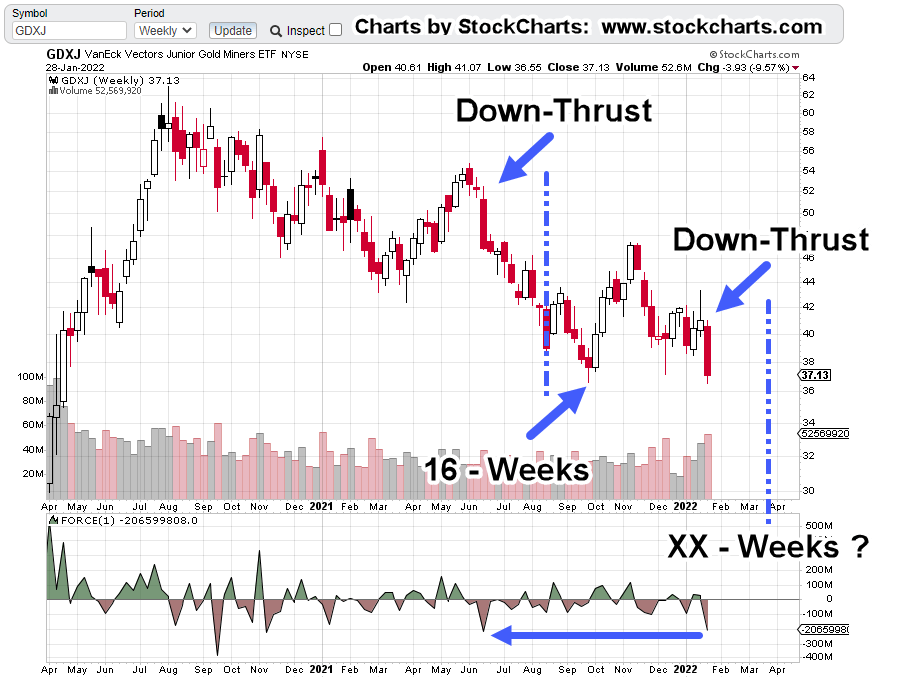
Junior Miners GDXJ, Weekly

We’re just one week short of Fibonacci 13-Weeks, from the late January 2022, bottom.
One extra week is well within margin of error when considering the 89-Week timeframe as shown.
But wait, there’s more.
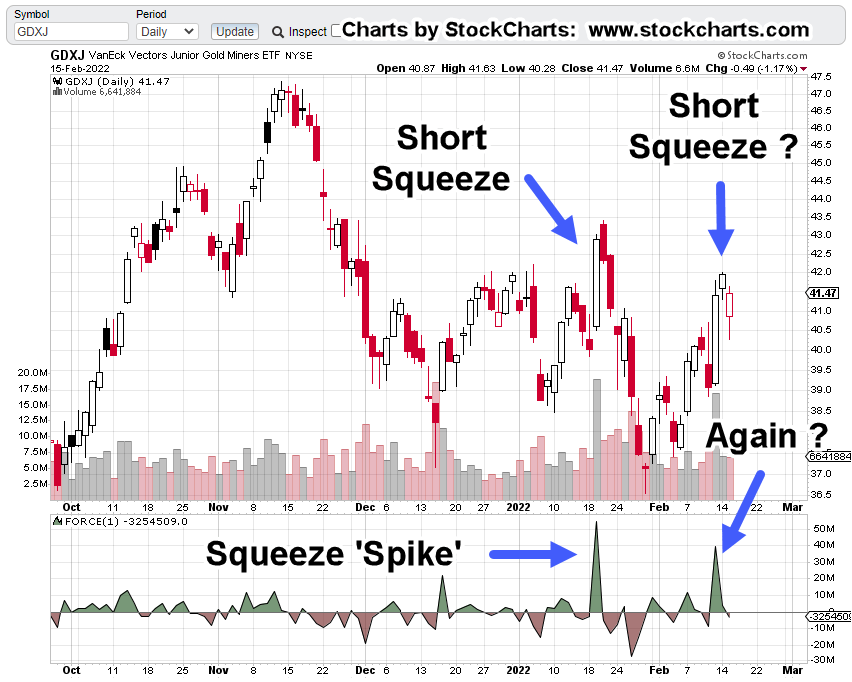
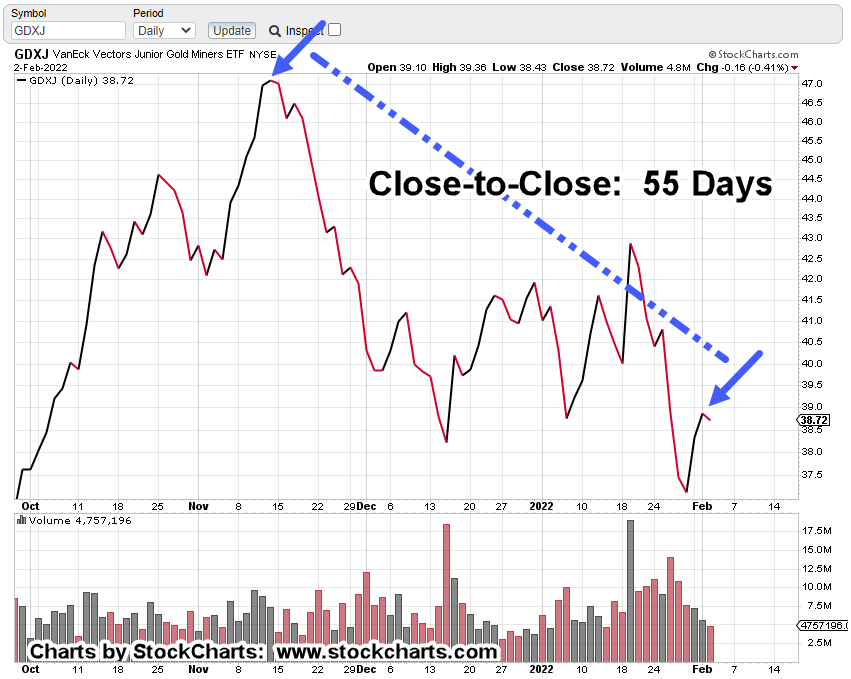
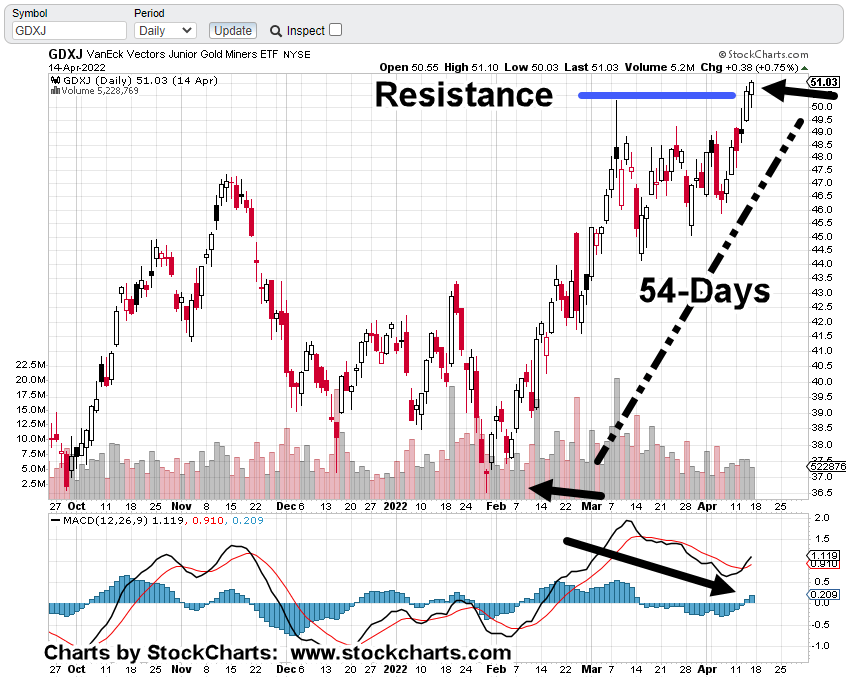
Looking at the daily chart, not only is there a bearish MACD divergence, we’re also just one day shy before it’s a Fibonacci 55-Days, from the 1/28/22, bottom.
Junior Miners, GDXJ, Daily
Can it all line up this perfectly?
Well, it can if no one is watching; that’s where the crowd and the government come in.
Summary
It’s a fairly safe assessment, nobody expects a downside reversal … nobody.
Even though time and again, we have clues that opportunity for precious metals may come later not sooner (not advice, not a recommendation).
The lockdowns in Shanghai with subsequent starvation and bartering (here and here), show under such conditions, precious metals are nowhere on the list.
Closer to home, the Texas Freeze of 2021, exposed that (lack of metals demand) as well.
Housing prices are starting to ease-off as well as prices for used cars.
Gold (GLD) may have reached its peak, March 8th, this year. Let’s see what happens next.
Stay Tuned
Charts by StockCharts
Note: Posts on this site are for education purposes only. They provide one firm’s insight on the markets. Not investment advice. See additional disclaimer here.
The Danger Point®, trade mark: No. 6,505,279