The Mother of All Contrary Indicators

This has to be it, right?
Selling gold in a supermarket; an expensive commodity, peddled to the least informed and least capitalized segment of the public.
Once that market’s saturated, who’s left?
Going Down Memory Lane
It’s been nearly three years since this post.
From a long-term strategy standpoint, this site has been consistent; it’s the food supply first, then gold and silver (not advice, not a recommendation).
The next shoe has yet to drop on how or what’s going to be used to extract (or confiscate) precious metals from the (stacking) proletariat.
With craziness by the day, anything can happen.
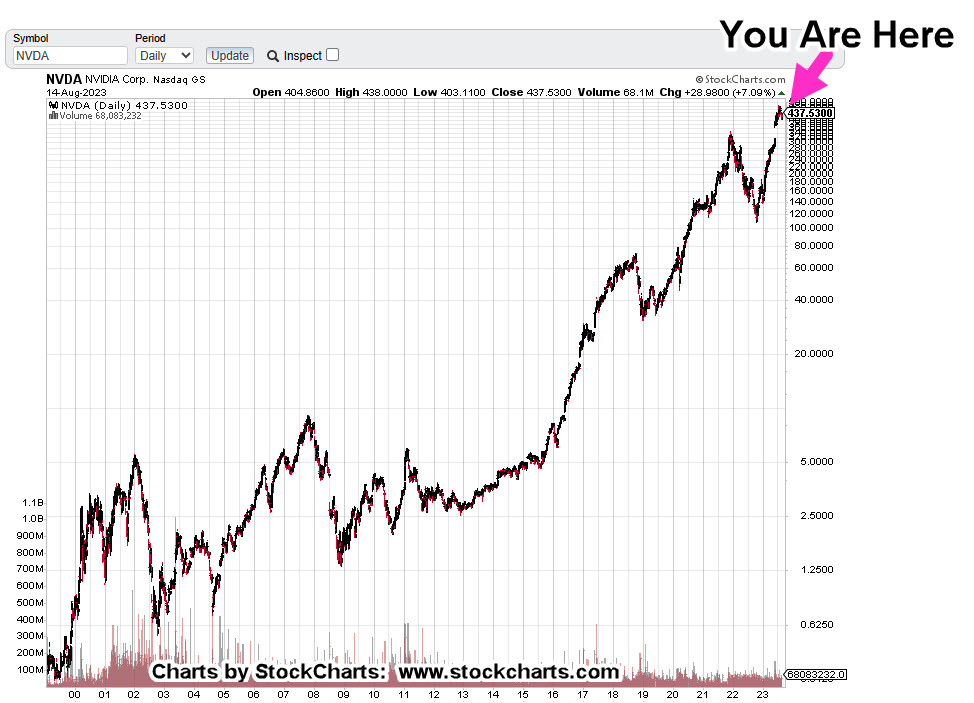
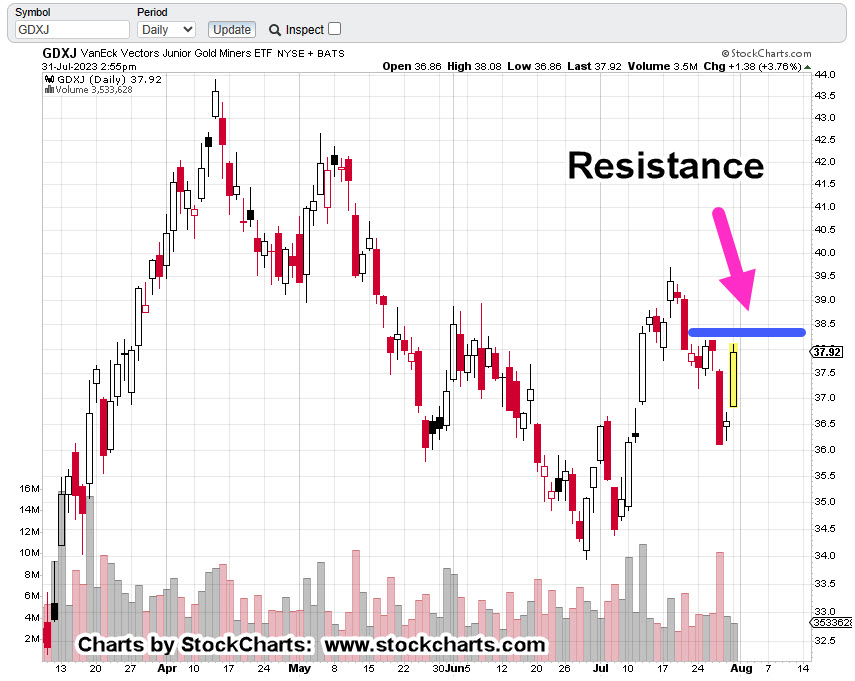
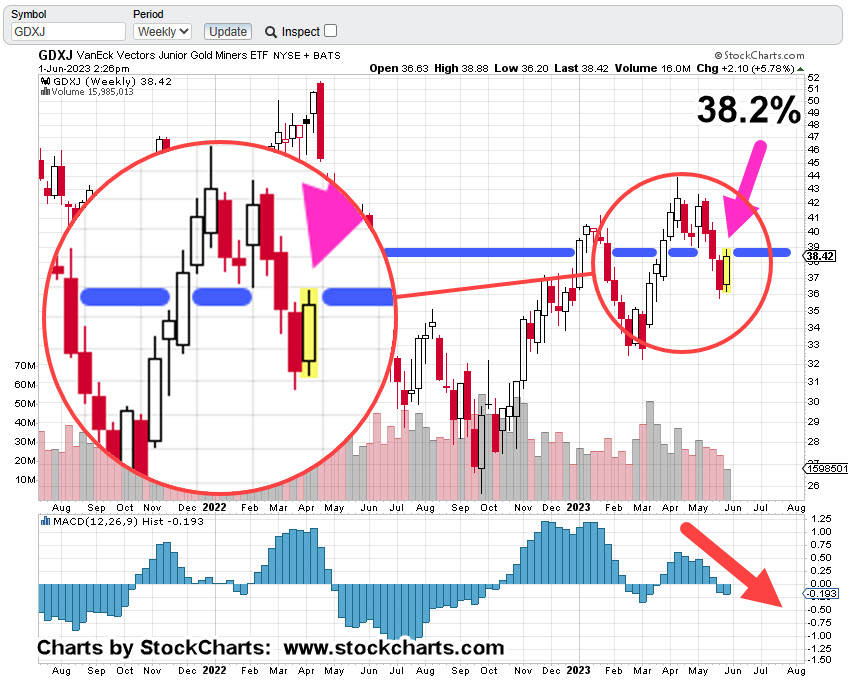
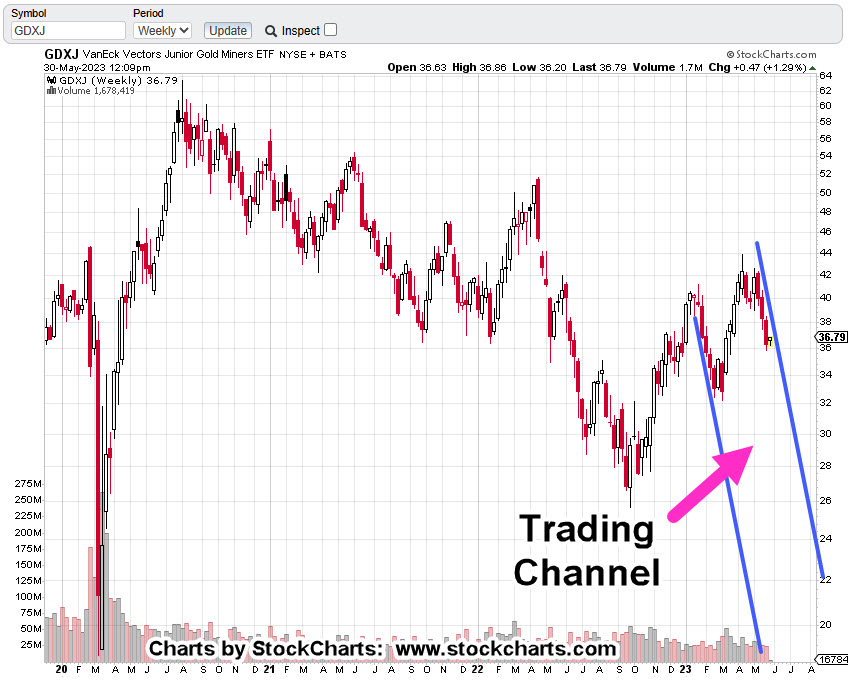
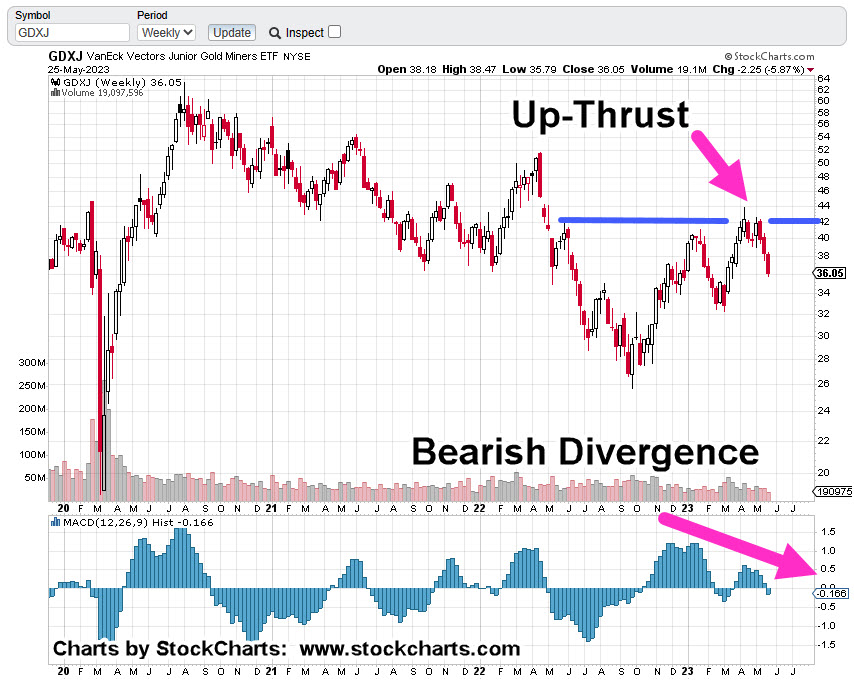
Gold: Turning Points & Technical
So far, it’s been three-for-three (here, here and here) identifying recent significant technical conditions and turning points for gold, GLD.
At this juncture, the dollar collapse, and the silver/gold bull launch are just not happening. It’s not there … something else is going on (not advice, not a recommendation).
We’re in the middle of a massive sovereign bankruptcy (Time Stamp 7:10) that’s never happened before.
What’s going on behind the scenes is not visible to us.
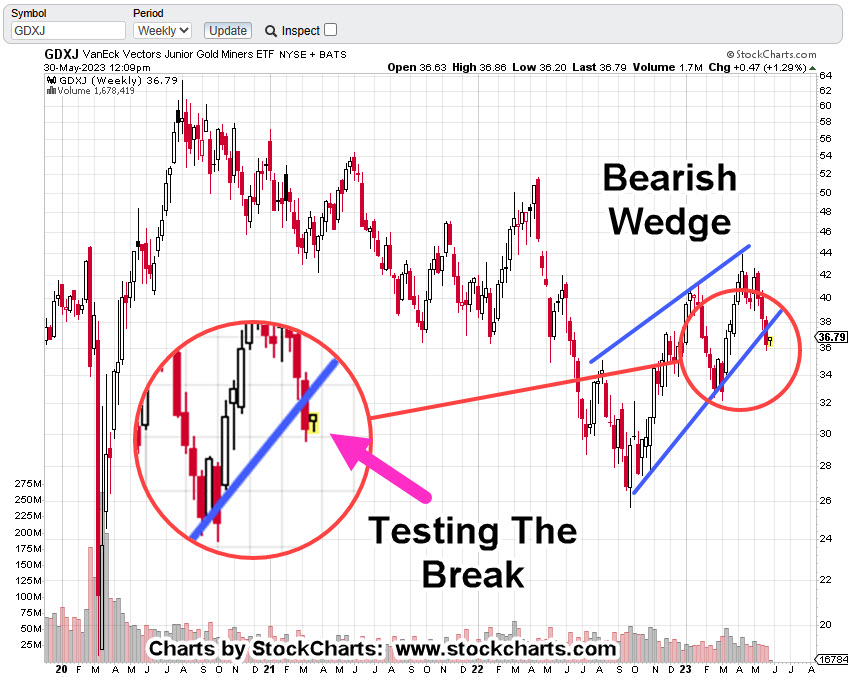
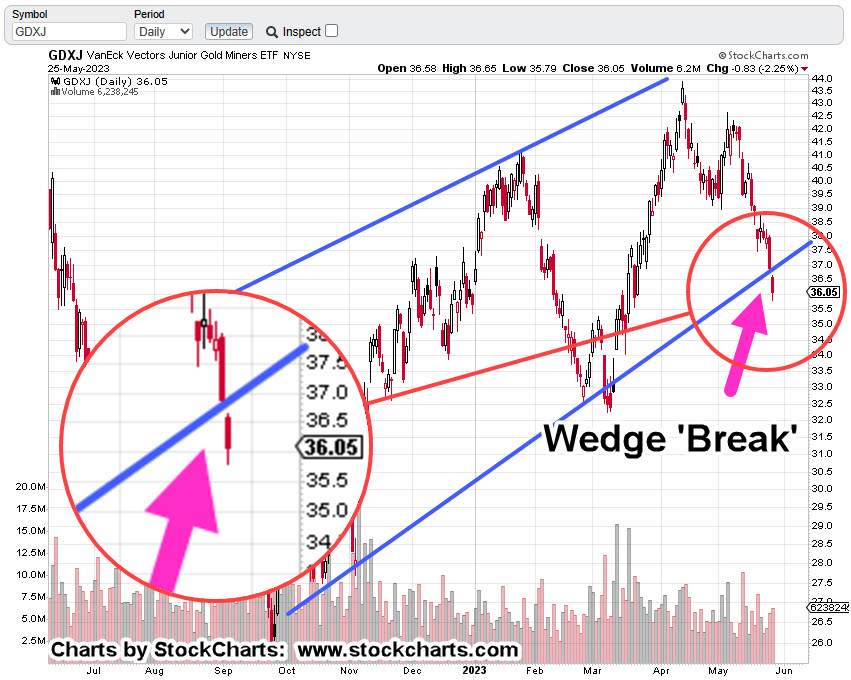
However, from a Wyckoff analysis standpoint, those (hidden) actions and decisions show up on the chart(s).
Contrary Indicator
Remember Baghdad Bob?
Constantly giving press conferences discussing the strength of the military campaign when the exact opposite was true.
It may be so with gold as well (not advice, not a recommendation).
The local supermarket has decided, after a 22-year long bull market, it’s ‘safe’ for profit.
The hapless public is now standing at the gold kiosk; with face-mask firmly secured, arm bandaged from the latest booster, EV FOB in hand (or pocket), hypnotized into yet another mania.
Stay Tuned
Charts by StockCharts
Note: Posts on this site are for education purposes only. They provide one firm’s insight on the markets. Not investment advice. See additional disclaimer here.
The Danger Point®, trade mark: No. 6,505,279