Note: Posts on this site are for education purposes only. They provide one firm’s insight on the markets. Not investment advice. See additional disclaimer here.
With a slight new daily high, we’re potentially at the end of the GDX rally.
It should be noted: The past two weeks of trading have stayed within the price extremes of the wide bar posted during the week of August 20th.
This is called ‘inside action’; typically signaling preparation for the next phase … whether up or down.
Note, the inverse fund DUST pushed just 0.02 points (DUST, 19.78) below our stop level (not advice, not a recommendation).
That position was elected to be maintained … we’re still short.
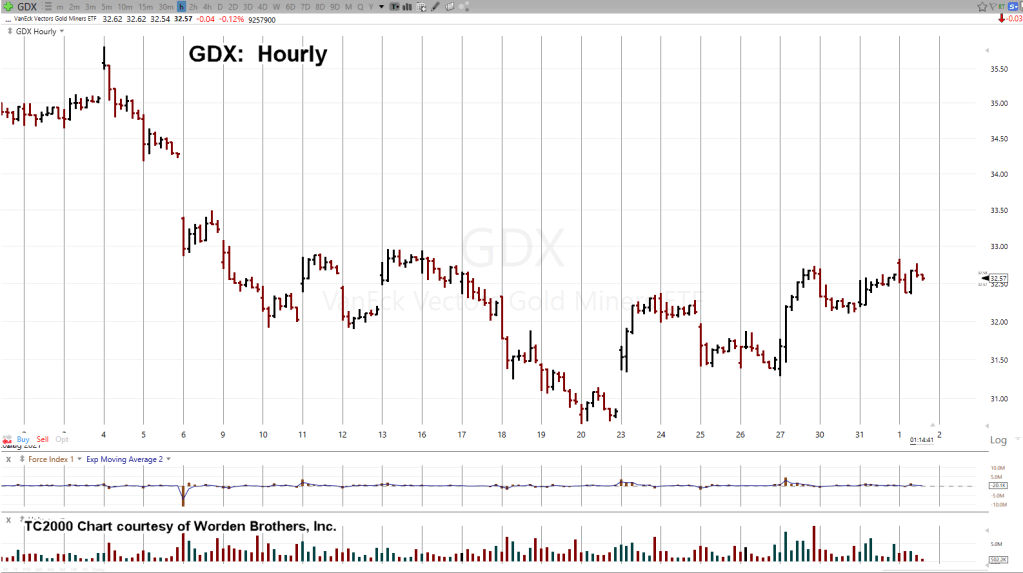
The hourly unmarked chart of GDX is below:
Next, we invert the chart to mimic the inverse fund DUST:
Now, comes the mark-up:
From Wyckoff’s writings all the way back to circa 1910, he discussed ‘shortening of the thrust’.
When net progress becomes less and less … we know we’re nearing the end of the move.
Throw into the mix the high level of resistance at the GDX 33.00, and probabilities favor the downside … upside for DUST (not advice, not a recommendation).
Stay Tuned
Note: Posts on this site are for education purposes only. They provide one firm’s insight on the markets. Not investment advice. See additional disclaimer here.
We’re not there yet and anything can happen in the meantime.
However, Senior Miner’s GDX, price action has moved lower during this session as expected.
Today has offered up one more clue for the bears provided GDX closes lower.
That is, we may have a channel confirmation:
Fibonacci time sequences are not necessarily always at price extremes. As shown above, they can define the width of a trading channel as well.
If this short (sell) set-up fails (GDX moves higher), we now have a definitive stop area for inverse fund DUST (not advice, not a recommendation); somewhere around: DUST 19.80 – 20.00.
Steven Van Metre in his last update, gave data on how the dollar is in a rally and nearing breakout position.
So far, there’s still a negative correlation between the dollar, gold, and gold miners.
Note: Posts on this site are for education purposes only. They provide one firm’s insight on the markets. Not investment advice. See additional disclaimer here.
It’s true when price action rebounds off a level, whether support or resistance, that level is confirmed.
However, personal (mental) bias, like the rabid hyperinflation ‘dollar destruction’ gold bulls, collectively have their minds so twisted, every bounce off so called support, is a buying opportunity.
That kind of blindness can set oneself up for (financial) disaster.
Well, we’re about to see if the current bounce was a buying opportunity or harbinger of a “free fall” breakdown.
Price action’s the final say. So, let’s take a look at what its been saying about the latest move.
Un-marked weekly chart of Senior Mining (ETF) Index GDX:
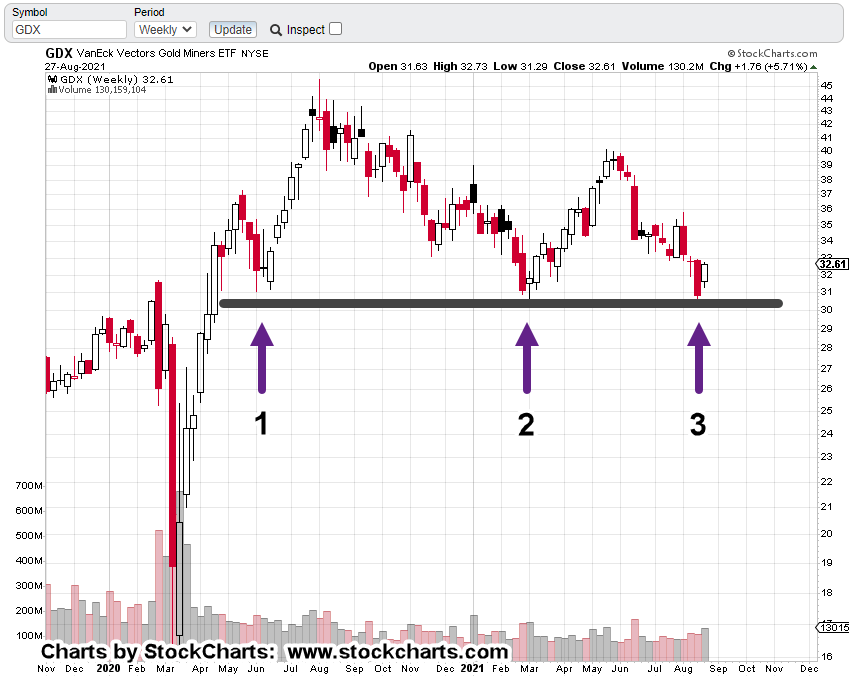
Next, comes the support line and contact points identified:
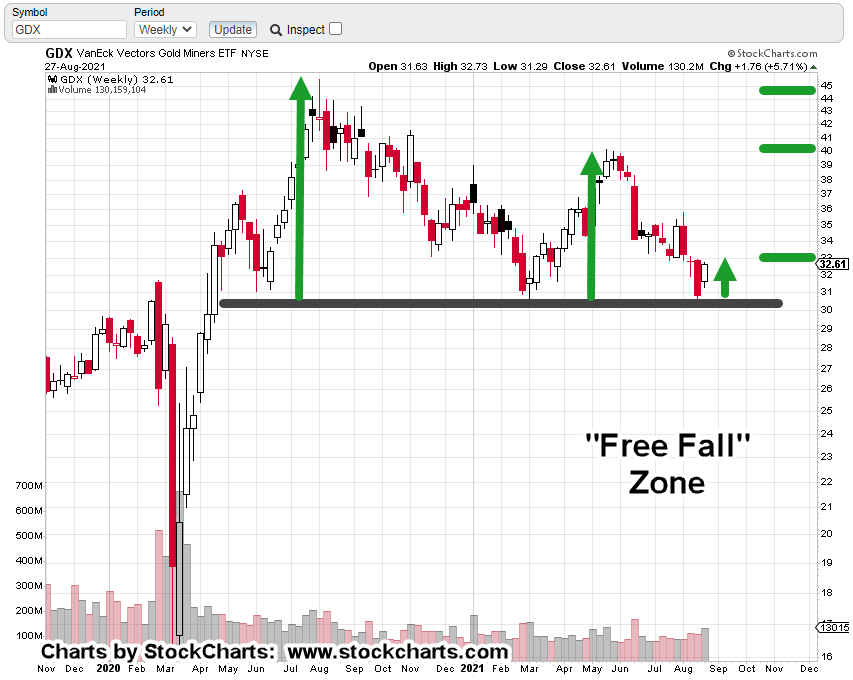
Now, comes the important part. Each rebound off support has less upward travel than before:
The right-most green arrow (upward travel), may or may not be complete. One fact in favor of completion is the significant amount of resistance around GDX, 33.00.
Price action has spent six weeks transacting in this area. Three weeks above support and now three weeks below.
Positioning:
We’re at the danger point; risk of being wrong on a short position is least (not advice, not a recommendation).
At this juncture, price action does not need to go far to either support or negate a short trade set-up.
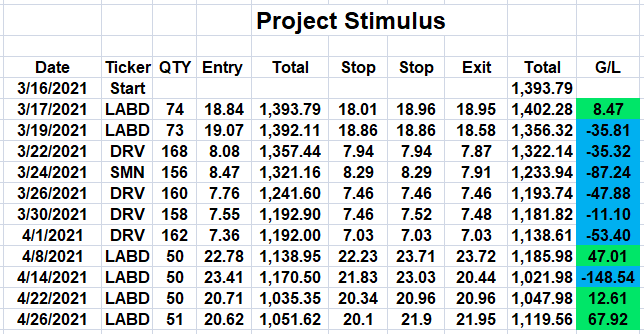
With that in mind, the Project Stimulus account is short this sector via DUST (not advice, not a recommendation).
Note: Posts on this site are for education purposes only. They provide one firm’s insight on the markets. Not investment advice. See additional disclaimer here.
Note: Posts on this site are for education purposes only. They provide one firm’s insight on the markets. Not investment advice. See additional disclaimer here.
As Dr. Elder once said (paraphrasing): ‘There are many ways to make money in the markets … even more ways to lose it.’
The time required to master the basics like support, resistance, accumulation, distribution is up to the individual.
After that however, the experimentation starts: Fibonacci retrace, time sequences, technical forces, multiple time frames and on.
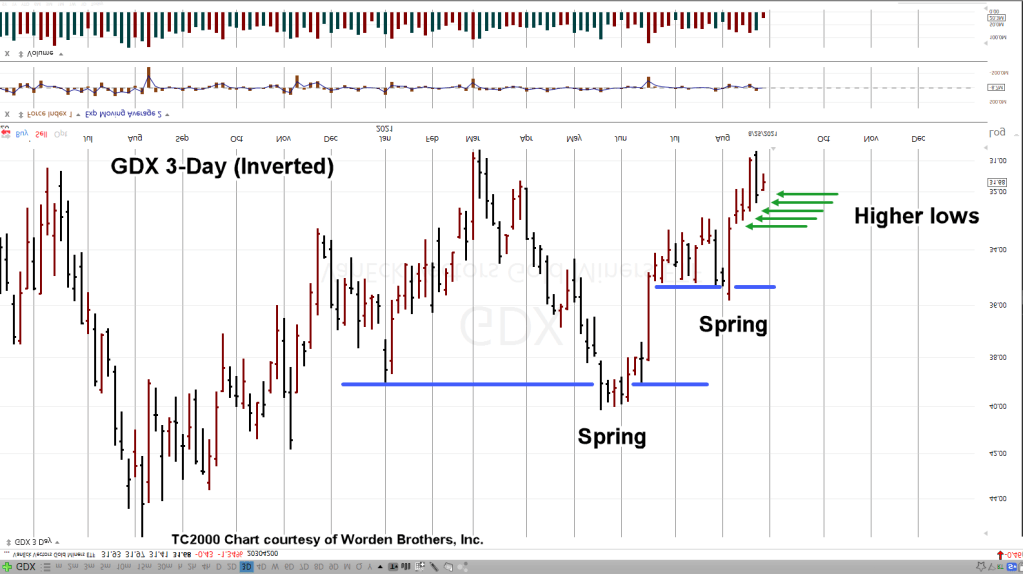
Experimenting with the chart of Senior Gold Miners GDX, shows at this time, a 3-Day chart reveals nuances not seen (so easily) in the daily or weekly.
We’re going to invert the chart to mimic the GDX inverse fund DUST (without the tracking errors) as shown below:
Then comes the mark-up:
All of a sudden, it becomes clear. Inverted GDX has been in a series of springs (up-thrust, non-inverted) and is now pivoting to the upside. That pivot is shown with the green arrows.
Each 3-Day period having a higher low than before.
As detailed in this prior update, GDX is potentially on the verge of ‘free fall’ (not advice, not a recommendation).
Pre-market trading has GDX, lower with DUST higher.
Stay Tuned
Note: Posts on this site are for education purposes only. They provide one firm’s insight on the markets. Not investment advice. See additional disclaimer here.
Note: Posts on this site are for education purposes only. They provide one firm’s insight on the markets. Not investment advice. See additional disclaimer here.
Note: Posts on this site are for education purposes only. They provide one firm’s insight on the markets. Not investment advice. See additional disclaimer here.
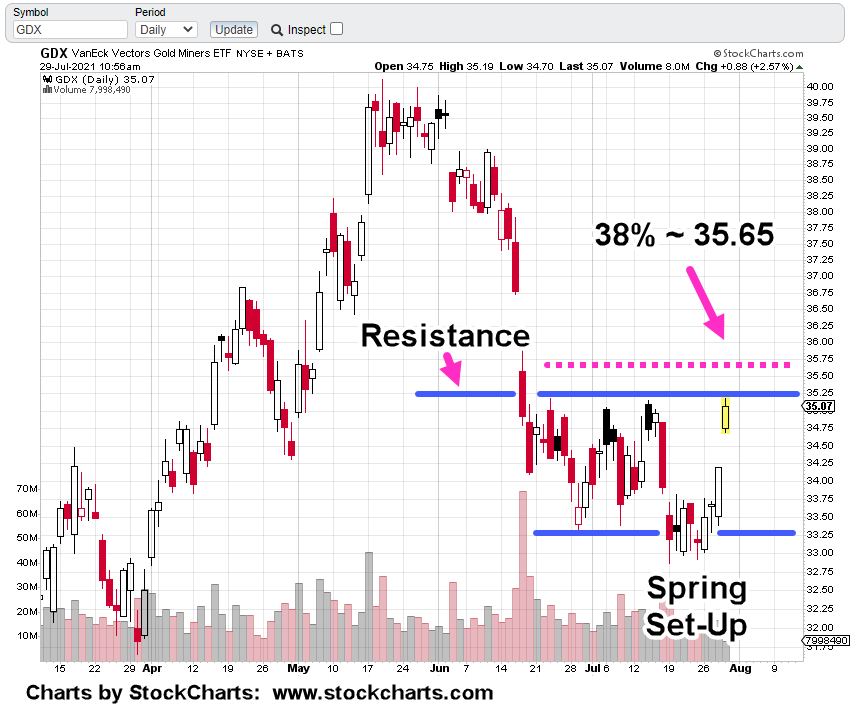
First, let’s start with the July 29th analysis of GDX. That update showed price action about to ‘Up-Thrust’ into a reversal.
The update even gave a possible high for the top of the developing set-up.
That high was in the area of GDX 35.65, near the 38% retrace level.
GDX topped-out at 35.82; then reversed.
The set-up chart is shown below and followed with the price action result:
And the result …
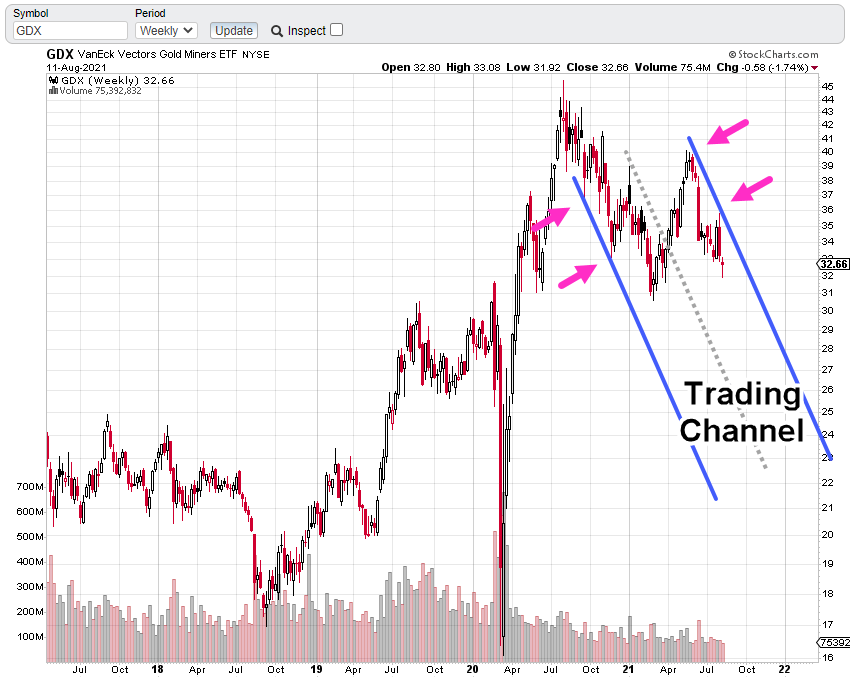
Pulling out to look at the weekly time frame, it’s clear, GDX is in a down-channel.
The magenta arrows show channel contact points:
Summary:
Gold and the miners are not showing hyperinflation at this juncture. It’s just not there.
Something else is going on.
As with the real estate index (IYR) not reversing as expected from collapsing retail purchasing (within established malls and elsewhere), gold and the miners are not moving decisively higher.
With real estate, It came out months later (after abandoning shorts on IYR) that Black Rock and others had been buying up whole sub-divisions … specifically from D.R. Horton.
With gold, it may be something else.
As proposed several times, the ‘controllers’ may make it irrelevant.
If you can’t get to the bullion dealer to either buy or sell, does it really matter if the metal’s in your possession?
This is a long-term game and this site’s in it for the long haul.
Each side making its chess moves. With that, it’s probably a good idea to review the standard plan of those on the other side.
Anecdote:
From a personal standpoint, as this post is being generated, there’s a Leghorn Rooster in a dog kennel cage (in my office) that’s been crowing for about two hours.
The same one (only much larger now) seen in this brief video.
Roosters are absolutely verboten in this neighborhood.
He started to crow decisively (collar or not) about a week ago; starting around 6:30 a.m.
He was not part of the plan. The five chicks were all presumed to be hens and his appearance was sort of an accident.
Several iterations later, which included sound-proofing the garage, he’s got his own set-up in my office.
It’s been about two and a half hours now and it looks like he’s done crowing. Soon, he’ll be off to check out the hens and be on with his day.
As a result of his arrival, we’ve changed our thinking: It may not be long before sentiment (to the food supply) changes instantly. It’s possible everyone at that time will be clamoring for their own livestock … crowing or not.
They’re no guarantees we’ll be able to keep him a secret (but God willing).
However, if he can be kept on the down low and then food supplies are cut off or severly curtailed, we’ll be more than happy to offer “Stud” services … for ‘small’ fee 🙂
Note: Posts on this site are for education purposes only. They provide one firm’s insight on the markets. Not investment advice. See additional disclaimer here.
“This site’s not part of the hyperinflation crowd. It’s too easy to jump on the bandwagon, get the clicks and then say it’s all ‘manipulated’ when price action does not follow the narrative.”
A firm foundation has already been laid; a bearish case for gold (the miners and silver) that includes the inverse correlation of a bullish dollar.
Both moves are currently underway.
Steven Van Metre, followed-on; highlighting the bearish gold set-up in his ‘Sunday Night Charts‘ update.
As is typical, there’s a small cadre that can see what’s happening. They are somehow able to ignore the constant media hype; positioning accordingly.
The original weekly chart of GLD below, is followed by today’s update:
Updated chart:
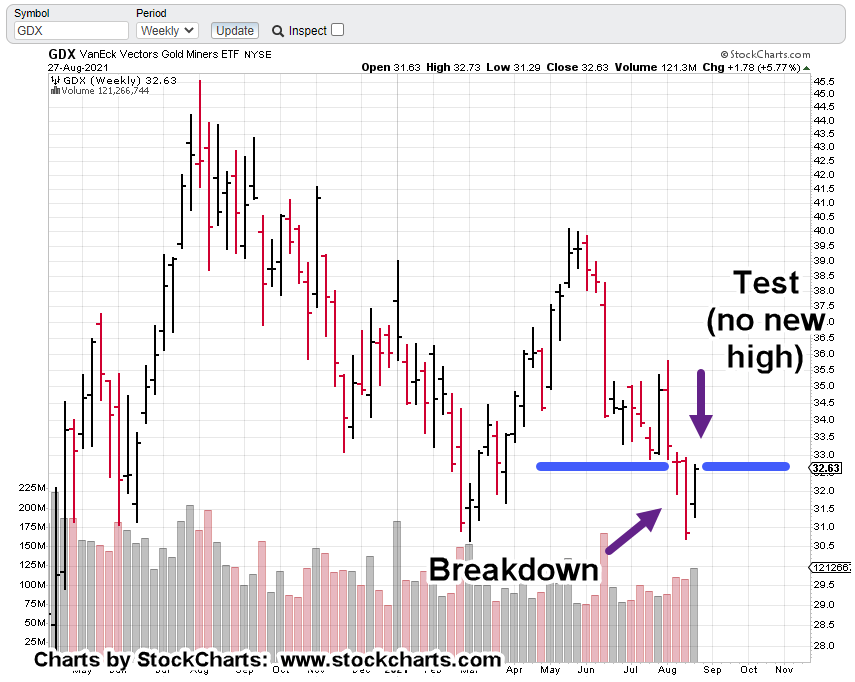
Typical market behavior is to break through the trend (for however long) and then come back for an underside test.
It seems that anything related to the gold (silver) markets is an overcrowded trade. There are too many rabid bullish fanatics.
We’ll stand on the sidelines for this one (not advice, not a recommendation).
Note: Posts on this site are for education purposes only. They provide one firm’s insight on the markets. Not investment advice. See additional disclaimer here.