The Unprepared

1:57 p.m., EST

South Africa Food Lines

The video at this link paints the picture.

Let’s use the images in that video and get deathly serious for a minute.

Imagine yourself walking up to one of the people in line, asking this rhetorical question:

“How’s that stack of silver?”

It’s no secret to anyone that’s been monitoring this site, we’re using the Biblical model (Genesis 41) for the current environment (not advice, not a recommendation).

That is: Corn and Grain (food) first … then gold and silver.

At first it seemed like a quaint alternative to the non-stop hyperinflation (no thought required) rants to continue ‘stacking’.

Now, it’s different. Now, it’s getting serious.

You won’t see that kind of line outside the bullion dealer.

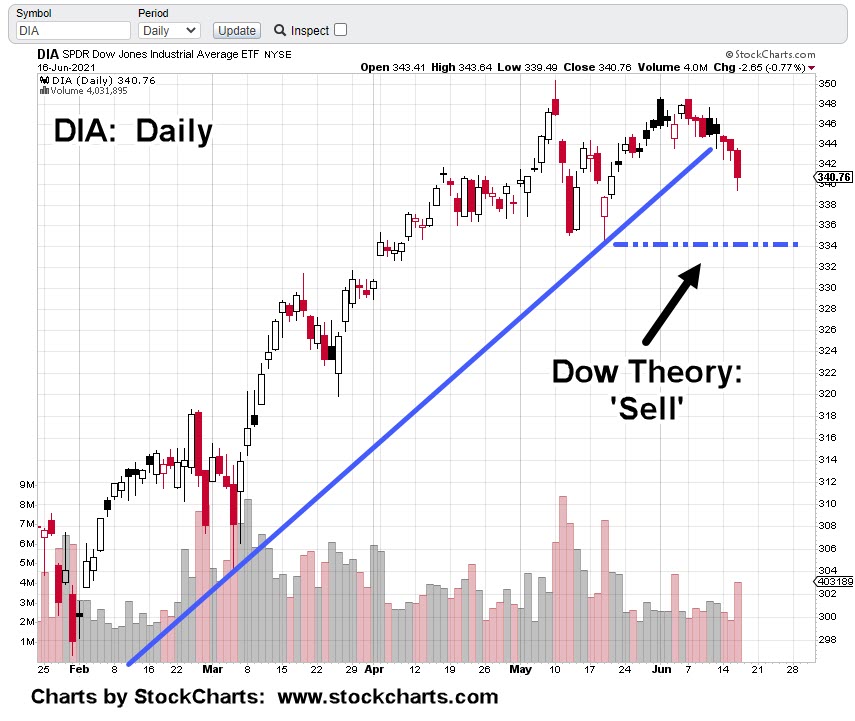
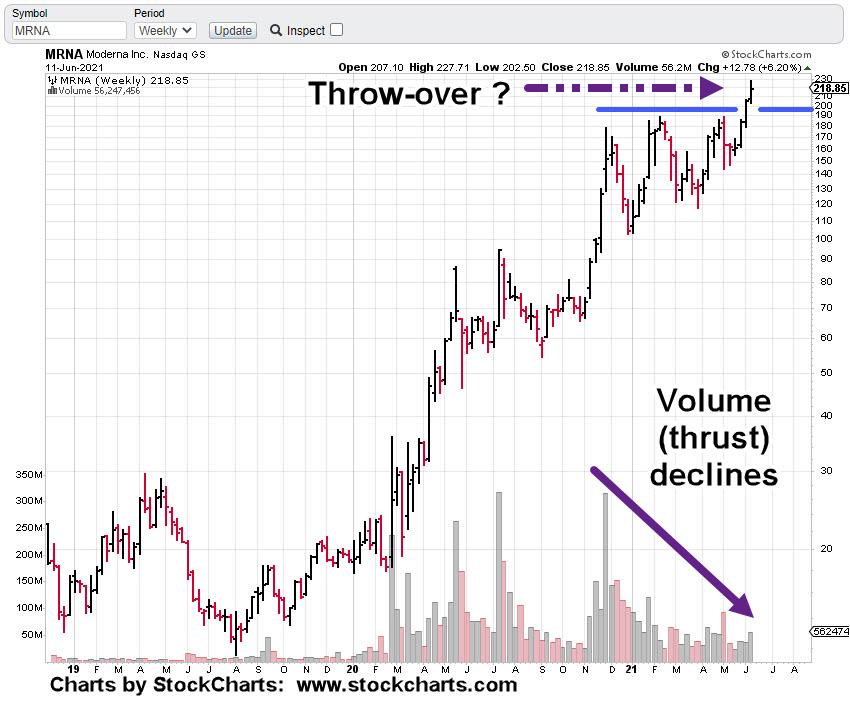
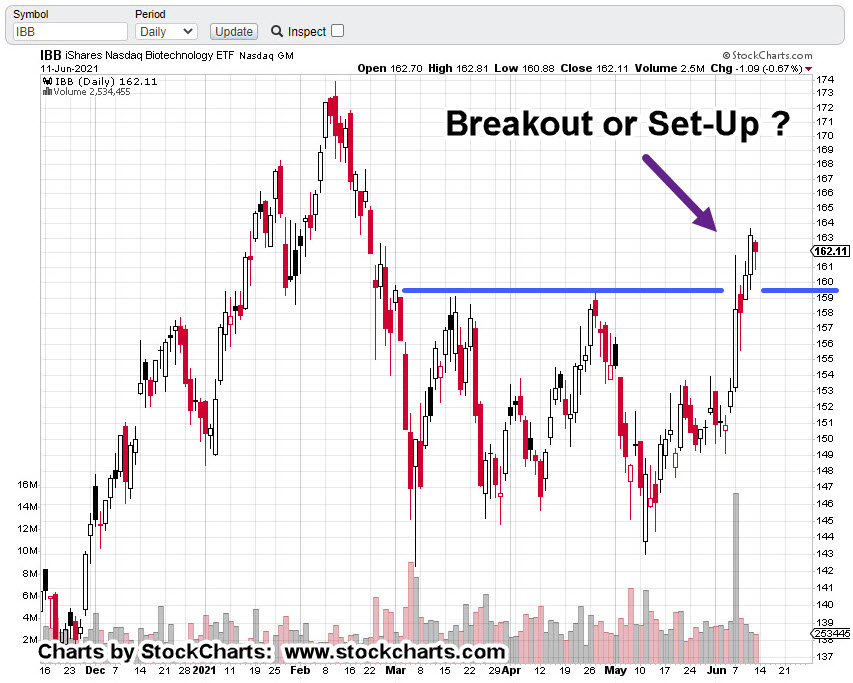
Moving on to the markets at hand … once again, biotech:

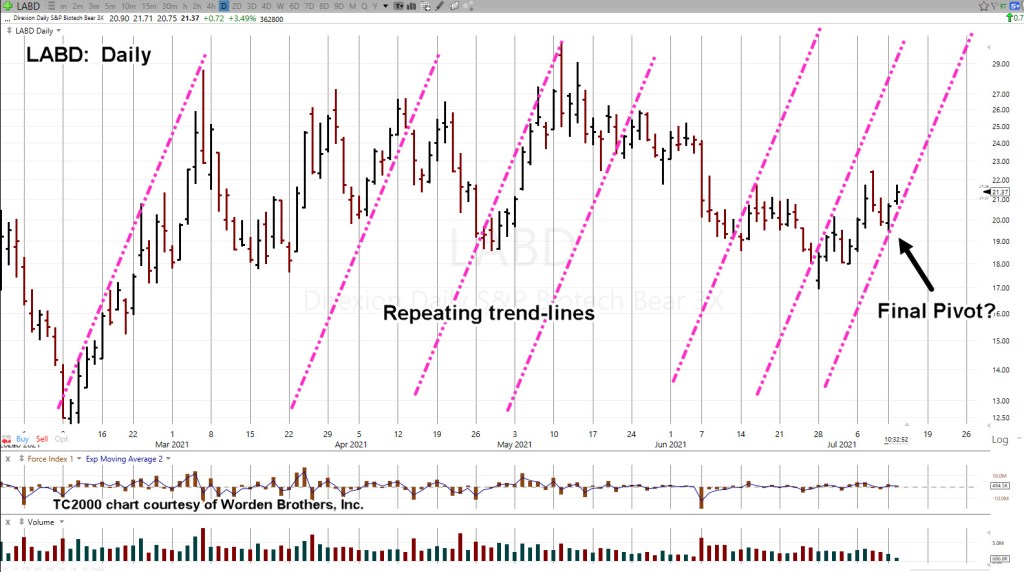
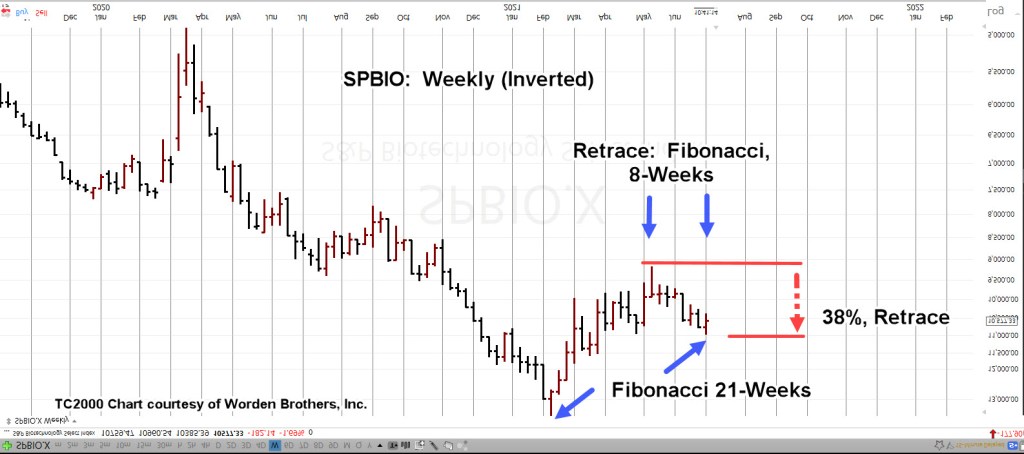
LABD (SPBIO) Analysis:

After yesterday’s LABD behavior, the logical thing to do would be to put the stop at the session low.

After all, that low was just below the lows of the previous day. Good to go, right?

Wrong.

It’s wrong because that’s what everyone would do. It looks like from today’s action, that’s what everyone actually did.

Recall that price action is automatic.

If there are too many stops all bundled up at one location, the orders will (automatically) be generated to go that that spot.

LABD price action penetrated the daily lows at a deeper level early in the session.

In the process, it penetrated well defined support which in turn, puts LABD, in spring position.

That’s where we are now.

Springs are usually tested.

If price action can hold above the support boundary, expectation is for a rally to at least the top of the range: ~ 24.50 – 24.75

Stay Tuned

Note:  Posts on this site are for education purposes only.  They provide one firm’s insight on the markets.  Not investment advice.  See additional disclaimer here.

Psychologically Unprepared

11:43 a.m., EST

When the break comes … it’s not coming back

Nearly 100-years ago, Wyckoff, stated:

‘If you can’t completely ignore the news and the financial press, you will never be successful in the markets’ (emphasis added).

In line with that, we have this: The very first sentence from this article out of barchart is questionable to say the least.

First:

There is no rapid ‘re-opening’. There never was. There is no ‘pent up’ demand.

Massive credit card usage shows the U.S. consumer has been decimated; using credit just to survive.

It should be (but somehow for some, it’s not) obvious we’re in a controlled demolition of the economy (including the food supply) on a world-wide scale.

Second:

Price increases are the result of supply chain (also, controlled demolition) shutdown not inflation.

Uneducated Economist has probably done the best job of ‘boots on the ground’ work to completely dispel the inflation false narrative.

He called the current and now waning lumber price spike two years ago. That’s how you know who to trust or believe. Take a look at their past analysis and see how it ‘aged’.

Third:

The U.S. population collectively, has never experienced real hardship. Those who made it through the Great Depression have all but died off.

There is no one around to give said population a swift kick in the pants and tell them to ‘suck it up’.

Northman Trader

Sven Henrich has come out with an excellent market update, linked here.

Towards the end of his analysis he states; ‘when the break comes, it will be quick, deep, keep going and most (if not nearly all) will be psychologically unprepared.’

Which brings us to biotech.

LABD Analysis:

Biotech SPBIO, is back as downside leader: Down just over -25%, from its highs in February, this year.

The daily chart of (inverse fund) LABD is below. The market itself is showing us it wants to follow the repeating pattern of trendlines (not advice, not a recommendation).

If the entire structure (from the February low) is actually a trading channel, it’s hard not to overuse the word ‘massive’.

Non Confirmation:

As of this post, the Dow, the S&P and the Composite are unchanged to slightly higher. Yet biotech SPBIO, is down -1.2%.

We won’t know until it’s all over … but it looks like biotech could somehow be the catalyst (along with the dollar and gold?) that precipitates the final reversal in the overall market.

Stay Tuned

Note:  Posts on this site are for education purposes only.  They provide one firm’s insight on the markets.  Not investment advice.  See additional disclaimer here.

Deflation = Credit Destruction

Silver Collapse Ahead?

If and when food shipments halt nationwide and there’s nothing at the grocery store, is everyone going to run to gold and silver?

Will that be the savior?

It certainly wasn’t during the ‘Texas Freeze’. Not even on the list of must-haves.

The next planned event(s) are in plain sight for those who can see.

Mega drought in the corn belt (whether real or not), power substation blows up in Houston (that one was real) and planned destruction (or total control) of semi-trailer shipping (also real).

It’s the food supply and infrastructure first; then gold and silver (not advice, not a recommendation).

The Wells Fargo incident; inflation has likely run its course.

The dollar (and bonds) are in strong upside reversals; gold and sliver are (still) inversely correlated to those markets.

Inflation is credit expansion. Deflation is credit destruction. That’s where we are now.

Analysis: Silver

It’s the job of the mainstream financial media to make sure as many as possible are on the wrong side of the trade.

They have done well with the ‘inflation’ narrative.

Uneducated Economist puts it well; price increases are the result of supply constriction not inflation.

Which brings us to silver.

The weekly close of silver proxy SLV, has the ‘short squeeze’ already complete.

Shortages of product, continued inflation pummeling by the press, have not moved the metal higher; that’s the ‘tell’, something’s wrong.

Wells Fargo has kicked off the next round; deflation or deflation impulse.

One has to be prepared; silver may (even if only for a few days or weeks) head down to below where it started the squeeze.

Even to single digits … $9/oz., anyone?

If that happens, it means that gold and silver are being dumped onto the market while everyone’s scrambling for food, water and protection.

Stay Tuned

Charts by StockCharts

Note:  Posts on this site are for education purposes only.  They provide one firm’s insight on the markets.  Not investment advice.  See additional disclaimer here.

Downside Leaders: Gold, Biotech

11:39 a.m., EST

Biotech SPBIO, Down Over 21%

Miners GDX, Down Over 25%

As of about 10:50 a.m., EST, this is where we are from a sector standpoint.

The major indices are masking the potential the next leg down, has already started.

Yesterday’s update posted the link for ‘Holiday Turns’.

It’s a list of empirical observation that market tops (reversals) tend to occur during holiday weeks.

The weekly chart of biotech SPBIO (which has been inverted), shows a Fibonacci 21-weeks, from the all time high (low on the chart) to this week’s pivot:

Not only is SPBIO adhering to Fibonacci time prints on the weekly, it’s doing it on the daily as well.

It was a Fibonacci 34 days to complete the 38%, retrace.

It was a Fibonacci 5 days to complete the most recent reversal and test; culminating early this session.

As stated many times, the bottom may fall out of biotech.

Someone or something in the criminal cabal is going to let loose; fully exposing the real intent of the entire operation.

Recall Prechter’s admonition; ‘price leads the news’

If SPBIO reverses at week 21, with a decisive move lower, it may not be long before news precipitates out into the mainstream.

We’re now two-hours into the trading day.

It’s typical for SPBIO, to begin its erosion (discussed here). Let’s see if it can retrace the sharp down move from the early session.

Stay Tuned

Note:  Posts on this site are for education purposes only.  They provide one firm’s insight on the markets.  Not investment advice.  See additional disclaimer here.

Gold, Dollar: In Tandem

Dollar Rally, Gold Rout

Markets Remain Inversely Correlated

First, let’s start with a review of the dollar reversal.

Back in early May, this report pointed at the possibility for a bullish set-up in the dollar.

That type of head’s up gives one time to investigate the correlations.

Correlations like, ‘is gold still inversely correlated to the dollar (and bonds)?’

Over the weeks as the set-up unfolds, confirmation or negation can be added by observing price action.

By the time we get the dollar penetrating support levels, we have gold at interim highs.

In fact on June 9th, the day the above ‘penetration’ report was posted, gold (GLD) had already reached its peak and was in a reversal.

Five days later (before the major down-move), this report was published on gold.

Therefore, at this juncture, we’re still inversely correlated.

So, what does that mean?

The updates on the dollar have proposed, since the bullish divergence (now turned rally) is on a longer, weekly time frame, the ensuing move could have the potential to carry the index UUP, to the top of the trading range shown here.

Then, what happens to gold?

If the negative correlation remains intact, gold gets whacked.

The weekly chart of GLD (above) has the index closing right at the Fibonacci 38.2%, projected level.

Wide bars tend to get tested. There could be some kind of rally in the coming week but it’s not required.

The Fibonacci projections highlighted as the orange bars, go all the way down to 161.8%. That’s equivalent to GLD at ~ 118.65, or the futures market somewhere around $1,300 – $1,350.

With the Dow 30, (DIA) penetrating and closing below the 336, support levels on Friday, we have a Dow Theory Sell Signal (not advice, not a recommendation).

The markets appear to be rolling over.

The last market reversal in February – March, of last year, had GLD dropping over – 14.5%, in two weeks.

Fast forward to now; GLD, is already down over – 15.2%, from its August 2020, highs.

Stay Tuned.

Note:  Posts on this site are for education purposes only.  They provide one firm’s insight on the markets.  Not investment advice.  See additional disclaimer here.

Update: Dow Theory, ‘Sell’

9:05 a.m., EST

Dow 30 (DIA) breaks trendline

Price action declining towards support

Price action rolls over and in the process, breaks the uptrend.

The prior update, had this link to an explanation of the sell signal (not advice, not a recommendation).

The sell signal is confirmed if/when the support at the dashed line is penetrated with a close below that line.

Summary:

The markets were volatile yesterday with sharp moves in the dollar, gold and the gold miners.

Pre-market action has gold (GLD), continuing sharply lower; – 4.1 points, or – 2.37%.

Inverse GDX, gold miners DUST, is trading higher as well; up about + 1.1 points, or + 6.65%.

For those monitoring this site on a regular basis, none of the above is a surprise.

We’ve been reporting on the pending dollar reversal for weeks; how gold (and silver) still appear to be inversely correlated.

Stay Tuned

Charts by StockCharts

Note:  Posts on this site are for education purposes only.  They provide one firm’s insight on the markets.  Not investment advice.  See additional disclaimer here.

Gold Channel … Down

10:47 a.m., EST

Contact points confirm channel

Gold (GLD) heading lower

The two hits on the right side channel line provide confirmation of the trend.

An expanded version of the daily is below:

So far, we’ve had the blockage of the Suez Canal. Auto parts being sent to the bottom of the ocean off Japan. ‘Mysterious’ grain silo fires destroying harvested crops.

But wait, there’s more. This just in:

A fire has destroyed the largest grease plant in the U.S.

If transportation is shut down as a result of cyber attack, fuel pipelines off-line, no grease to lubricate the wheels or any number of other (planned … and don’t think there’re not) events, the last thing that’s going to help get anyone through, is a ‘stack’ of inedible metal.

It’s no secret this site’s been using the Biblical precedent of Genesis 41.

That is: Grain and Corn come first … then gold and silver.

The ‘stacking’ public has got this message reversed. Of course, this is not advice or a recommendation.

However, for those that can see, it’s so obvious the goal is ‘controlled demolition’ of the supply chain. All of it.

We’ll put everything back to ‘normal’ if you just get injected.

Meanwhile, biotech IBB, and SPBIO, have both posted a new daily low.

IBB is poised to penetrate the resistance area identified in this update, and come back to test the wide bar.

If that happens, we have a Wyckoff up-thrust in play. More analysis of biotech to follow.

Stay Tuned

Charts by StockCharts

Note:  Posts on this site are for education purposes only.  They provide one firm’s insight on the markets.  Not investment advice.  See additional disclaimer here.

Dow Theory Sell & Gold

9:23 a.m., EST

Dow Theory; Sell signal nears

Gold, in Wyckoff ‘Up-Thrust’ reversal

Even though the current environment is anything but traditional, the report at this link shows how close the market is to a Dow Theory sell signal.

It could be. Even with valuations and markets at never before seen extremes, the traditional theory will still hold.

Wyckoff analysis, developed during the same time as Dow (published in 1910), does not concern itself with ‘valuations’.

That’s the key

Wyckoff discovered early on, that ‘markets have an energy of their own’.

This ‘energy’ has nothing to do with valuations.

Gold (GLD) has been discussed several times over the past few weeks; that it has stalled and in potential reversal.

The weekly chart shows the blue line resistance area. Price action has struggled at this location for weeks.

Now, with the market about to open, GLD is trading down a solid -2.5 points, or – 1.4%.

If that level is held to the open, it puts GLD below the June 3rd (weekly) low and below the resistance area.

With all the inflation, and hyperinflation talk, GLD has not made it to new highs.

Last week, the dollar reversal was confirmed with UUP posting a new weekly high. At the same time, weekly MACD confirmed its bullish divergence.

The stage appears to be set for some kind of surprise; in the markets, the dollar and gold.

Stay Tuned

Charts by StockCharts

Note:  Posts on this site are for education purposes only.  They provide one firm’s insight on the markets.  Not investment advice.  See additional disclaimer here.

Moderna: Reversal Review

‘Reversal at hand’ said the prior update

Reversal still imminent?

MRNA has pushed above resistance on declining volume (shown above) . The next chart has MRNA in a terminating wedge pattern:

Price action this past week has just contacted the top portion of the wedge.

MRNA is the fifth-largest cap equity in the IBB index. Its market moves have a definite effect on that index.

IBB, shown below:

On Friday, the market eased back a little. Will it come back to test the resistance area next week?

There’s no doubt about the wide high volume bar. That day (last Monday) posted the highest daily volume in four years.

Wide high-volume areas are usually tested.

It just so happens, that wide area is below resistance.

To test the wide bar, price action would need to move below the resistance area. Doing so, would put a Wyckoff ‘up-thrust’ into play.

The next chart shows another resistance area not easily discernable:

Although somewhat hidden, there’s another resistance level that for now is putting a limit on the upward travel of IBB.

Summary:

MRNA’s at an extreme. The previous update linked to a site which shows insiders bailing out in the tens-of-millions of dollars.

The bond market, with its upside breakout is not confirming the ‘recovery’ narrative.

The dollar is reversing as well.

Gold and the miners have stalled; potentially reversing.

The narrative is shifting as the media (all controlled don’t forget) has decided on its sacrificial, e-mail lamb.

Don’t worry, nobody’s going to jail. It will just be another distraction to keep the mask wearing masses from getting prepared for the fall.

As a reminder, this is how they think; ‘Just doing the right thing’ Almost like ‘Just following orders’.

Stay Tuned

Charts by StockCharts

Note:  Posts on this site are for education purposes only.  They provide one firm’s insight on the markets.  Not investment advice.  See additional disclaimer here.

Dollar Divergence: Update

2:37 p.m., EST

Dollar penetrated support and is reversing

Potential for sustained, persistent rally

Wide trading range

Looking at the weekly close chart, we can see the wide range.

In addition, there’s a significant bullish divergence that (technically) gives the dollar, UUP, enough energy to test the top of that range; a potential that’s completely opposite the current narrative.

A this juncture, silver, gold and the miners are still correlated.

Yesterday, a potential top and reversal in miners GDX, was identified. Today, it appears to be hovering and looking unsure of its direction.

GDX has not posted a new daily high or low as of this update.

A sustained dollar rally (along with the bond market?) would be unexpected given what seems to be apoplectic hyperinflation ranting.

Separately, in biotech, the market (IBB) has stalled to the upside in a higher than expected test. Inverse fund LABD, made a new daily low and it too, has stalled.

Downward thrust energy on LABD is dissipating.

Technical update for biotech, planned for tomorrow … market permitting.

Stay Tuned

Charts by StockCharts

Note:  Posts on this site are for education purposes only.  They provide one firm’s insight on the markets.  Not investment advice.  See additional disclaimer here.