Today’s trip to the office supply store, had those employees and some customers alike, still putting toilet paper on their face in an attempt to ward off goblins … unseen.
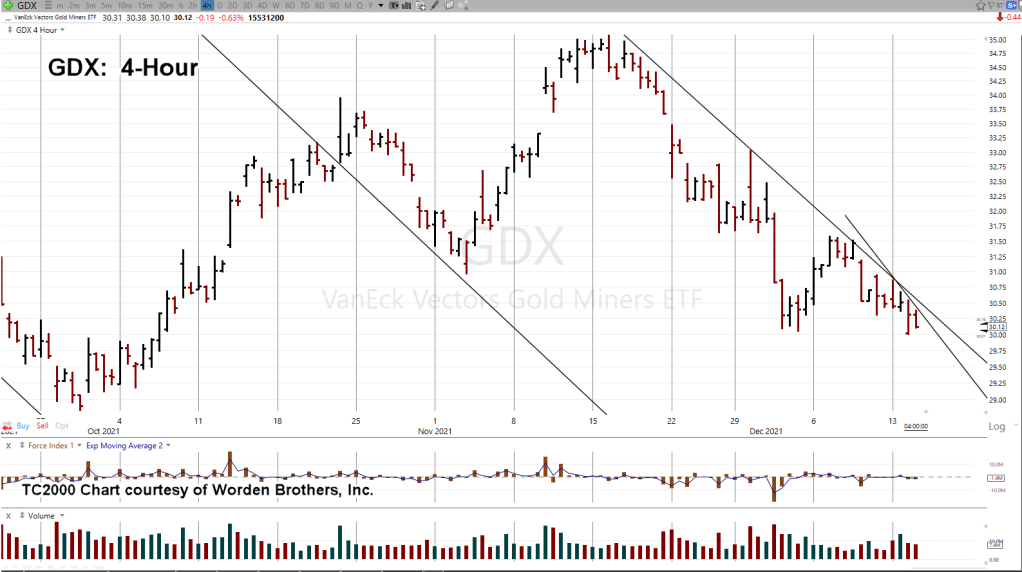
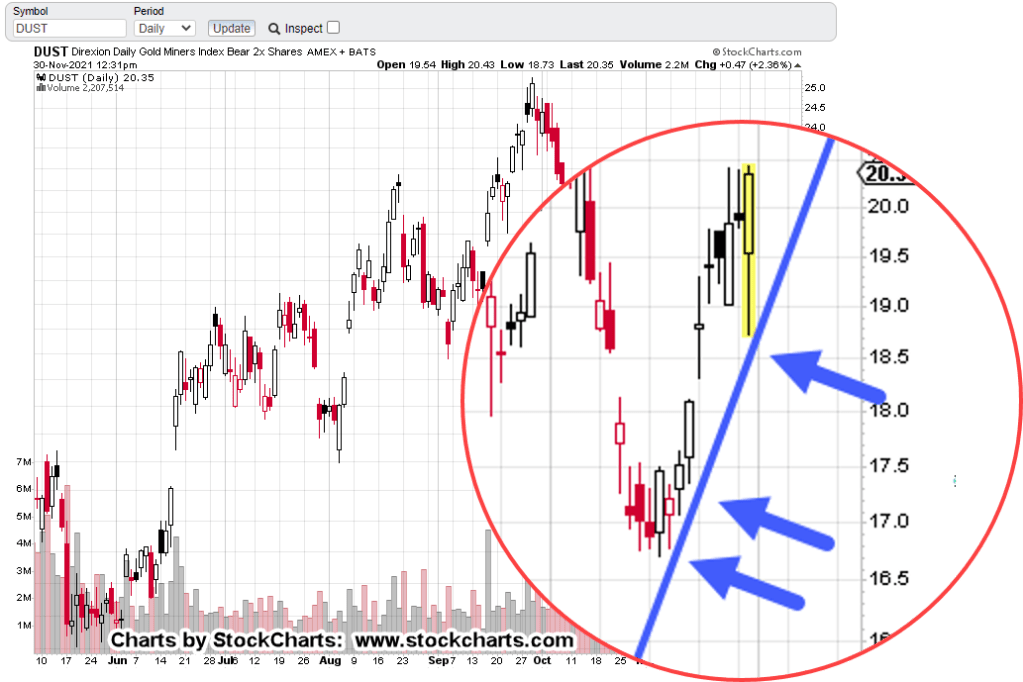
Looking closely, today’s bar pulled away from the right-side trend-line just a bit.
Next, the same chart but on a 4-Hour time-frame
Note how a new (increased angle) trendline can be drawn.
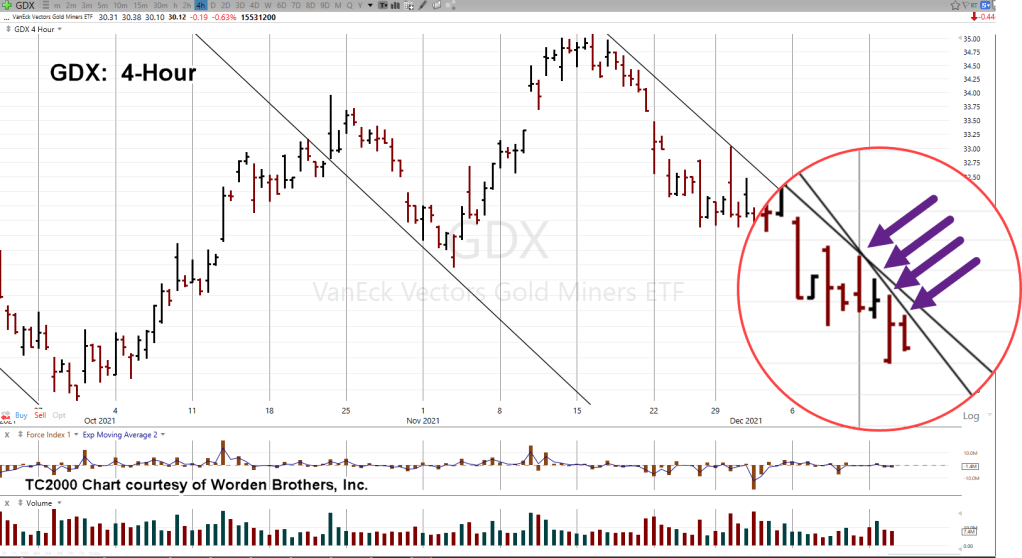
The next chart zooms-in
There have been four, four-hour hits on the new more aggressive downtrend line.
That new line (thus far) is declining at about -94%, on an annualized basis.
Summary
If this is a more aggressive pivot lower, it’s very early in the trend. The next session can easily negate the trend or just as easily, provide confirmation.
Maintaining short via DUST (not advice, not a recommendation).
Stay Tuned
Note: Posts on this site are for education purposes only. They provide one firm’s insight on the markets. Not investment advice. See additional disclaimer here.
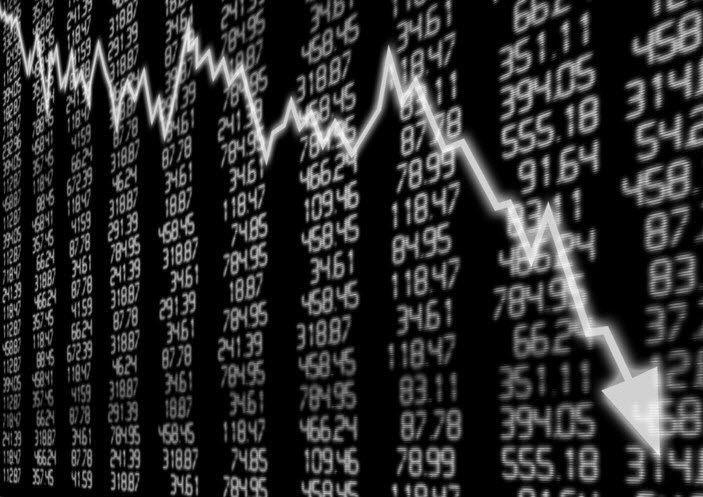
Even after gold and the miners have reversed lower, the press still implores gold to head higher.
Like something out of Moby Dick … even after Ahab is dead, he still beckons.
The above link gives us another report on ‘inflation expectations’ at a new record high.
Near the bottom, the text says that survey respondents expect ‘gold to continue acceleration higher’.
The problem: Gold’s not accelerating and currently, is not going anywhere.
The statement (or belief) is completely false.
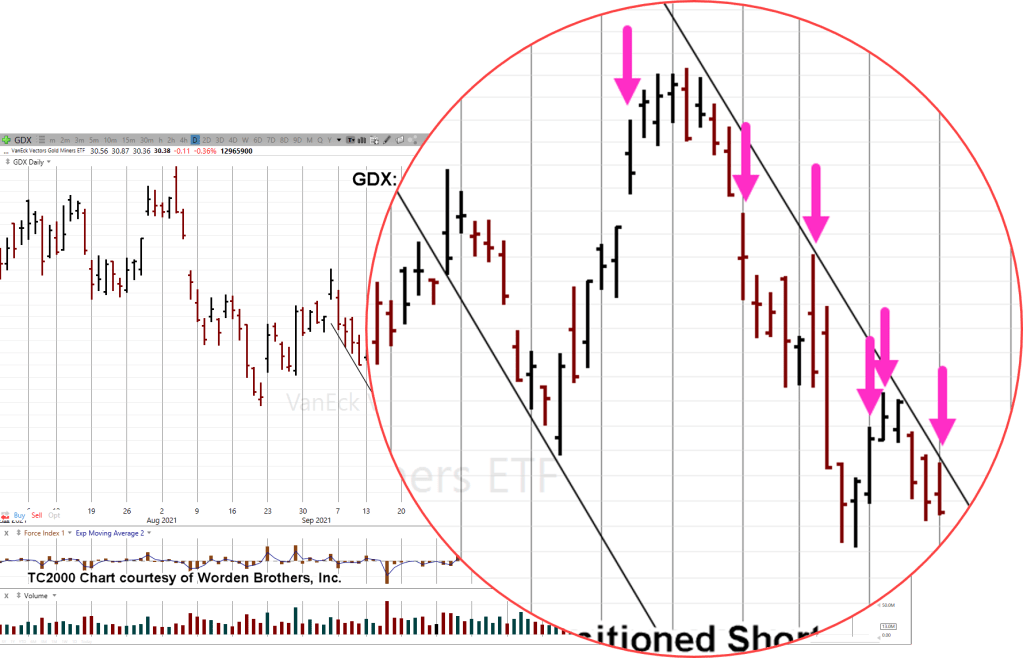
Senior Miners, GDX
The short positioning continues (not advice, not a recommendation)
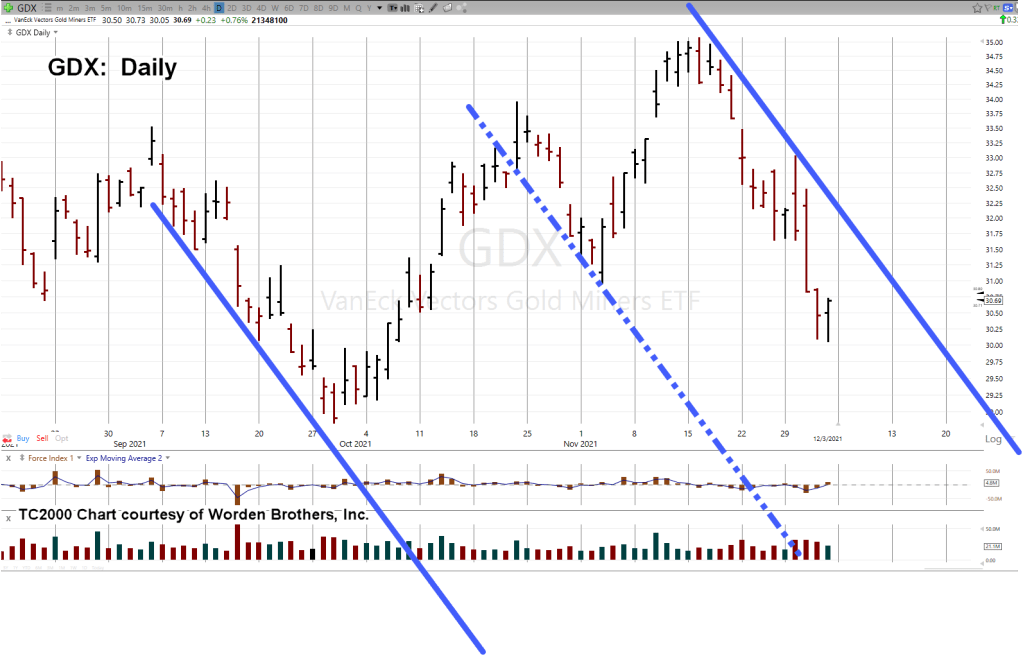
The daily chart of GDX, shows price action hugging the right-side trend-line. Each tap and reversal provides more data on potential direction lower.
With the understanding an exit could be required at any moment, the hits on the right side are being used to increase short positioning (not advice, not a recommendation).
The zoom chart above, shows every short entry, except one, at a lower price (higher for DUST).
Summary:
Today’s ‘expectations’ report was released at 11:12, a.m.
If the day’s narrow-range bar is the best the gold miners can do with such high ‘inflation’, there must be something else more powerful at work (to the downside).
Maintaining short until the market itself says to get out (not advice, not a recommendation).
Stay Tuned
Note: Posts on this site are for education purposes only. They provide one firm’s insight on the markets. Not investment advice. See additional disclaimer here.
… And when you find one, you must use it to its maximum extent.’
That was the admonition from Gerald M. Loeb, in the above titled book.
It’s the exact opposite of ‘diversification’. The professional traders/speculators know this and so focus on a few or just one opportunity.
The months-long bullish hysteria in the gold market, gave an advance clue it might be a significant opportunity; the opportunity for a low-risk trade opposite the crowd (not advice, not a recommendation).
So far, that’s correct.
The gold bulls are trapped. Such events can go on much longer than anyone expects.
With that said, we’re focused exclusively on this market until it falls apart, we exit, or there’s another opportunity.
Now, on to the Senior Miners, GDX
GDX
We’ll get straight to the marked-up chart.
Looking at price action on a closing basis, the past four trading days were a test. The print high was on Tuesday (31.58) and the close high was yesterday (31.49).
The test was on underside resistance and looking at the chart, that underside was also an axis line.
Next, we see at least one trading channel with the possibility of an extension to other channel lines.
If these other channel lines are in-effect … meaning we’re really in the wider channel(s) but it’s not yet verified, that represents some serious downside potential.
Positioning
The past three trading sessions allowed the opportunity to increase the short position via DUST (not advice, not a recommendation).
A previous post said that positioning was essentially complete. However, the market kept providing opportunity to go short.
Market action directs trading action. The total size (via DUST) was increased by about 8.7% (not advice, not a recommendation).
Note: Posts on this site are for education purposes only. They provide one firm’s insight on the markets. Not investment advice. See additional disclaimer here.
That is, unless the current patterns in price action change.
From a professional trader’s standpoint, one has to be on-watch for two things:
First:
Be mentally flexible enough to recognize the trade is falling apart and then exit.
Second:
As Prechter put it years ago, be mentally prepared to accept the huge gain.
At this juncture, what is the chart of GDX, telling us?
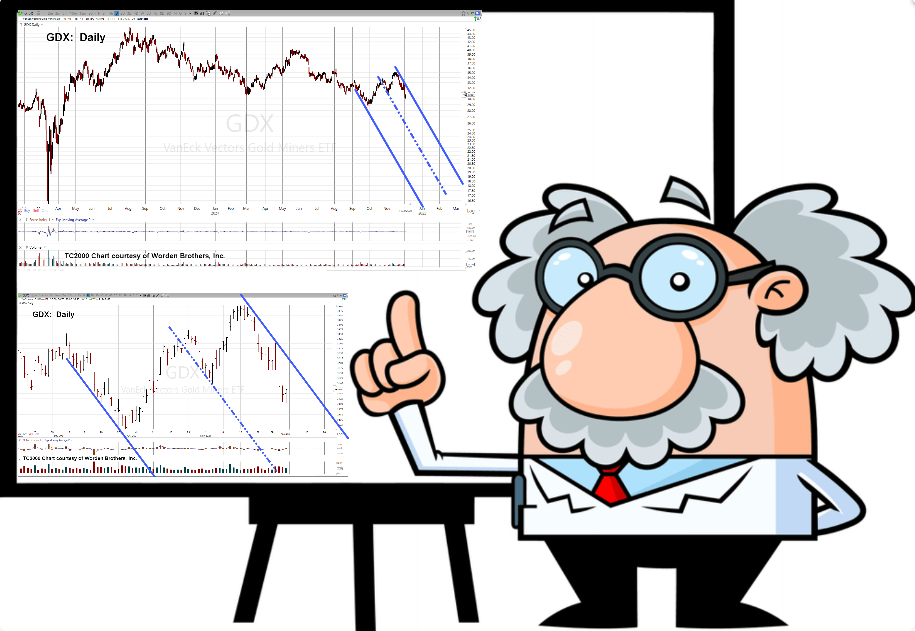
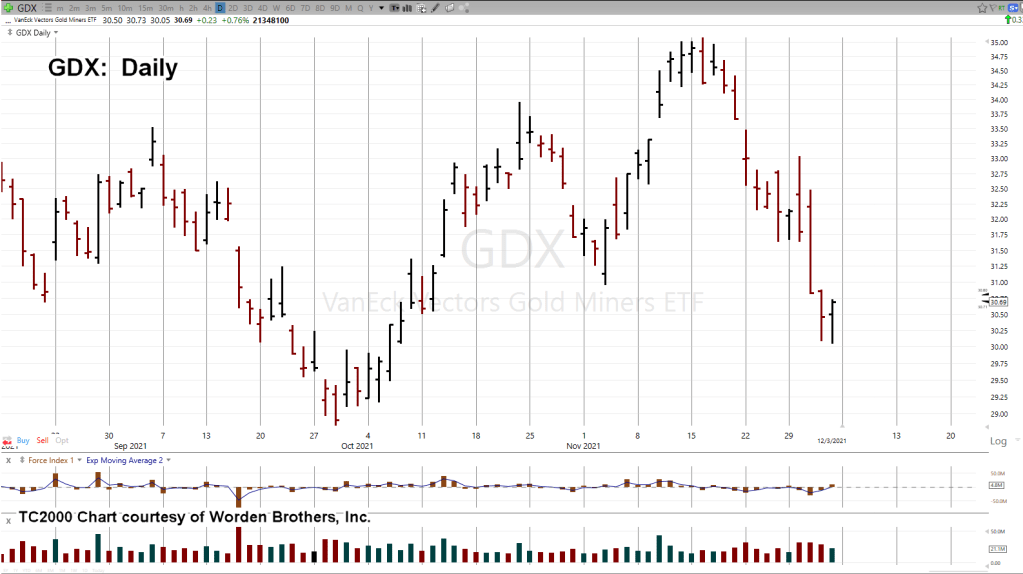
Senior Miners (GDX), Daily
The un-marked chart.
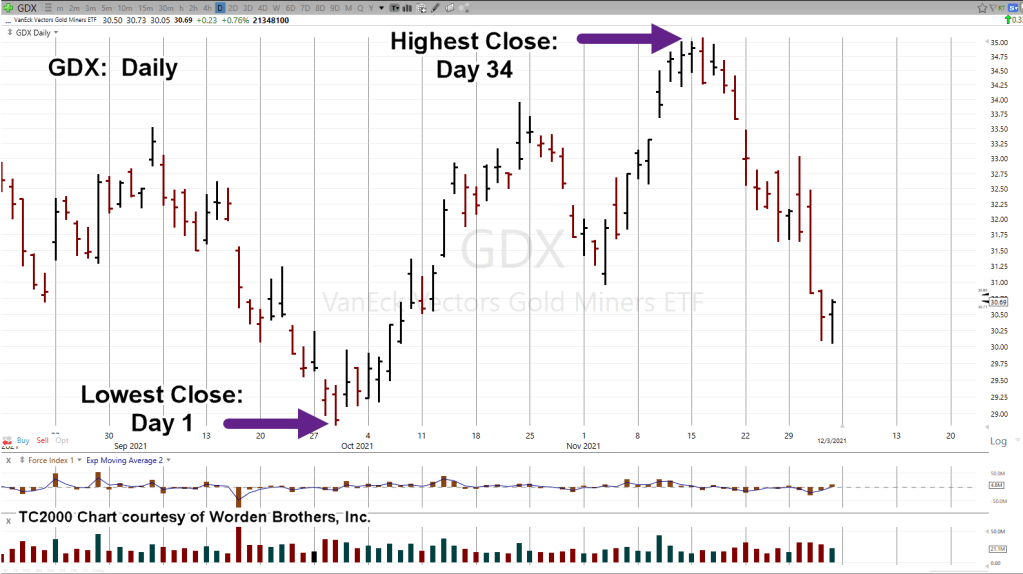
Marking-up with Fibonacci time sequence.
Adding-in some trend lines.
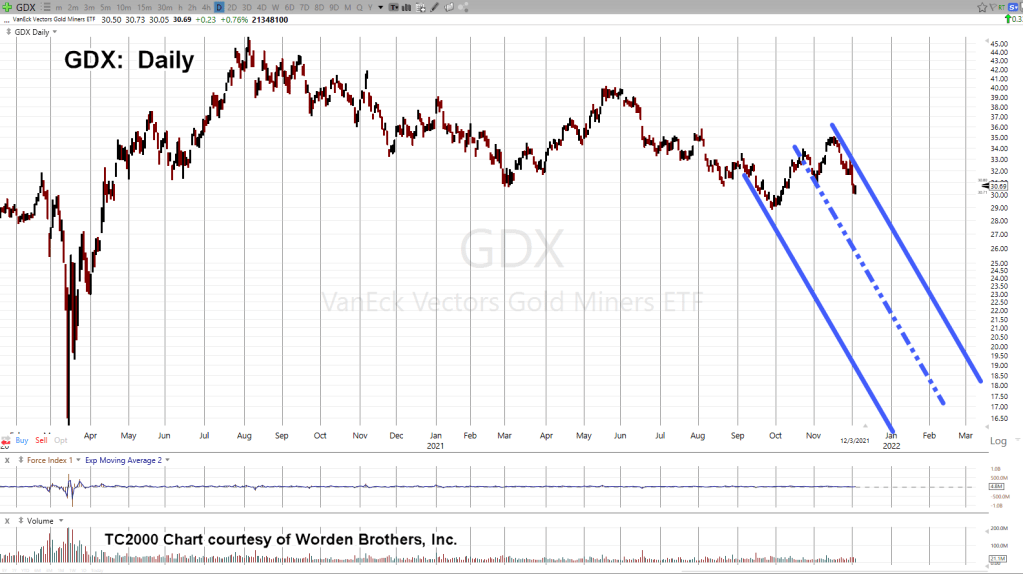
Zoom out to show the big picture.
Summary:
From low-close, to high-close, the counter trend move took a Fibonacci 34-days.
In the process, it appears that price action is now moving within a trading channel.
In addition, the counter-trend print high on 11/16/21, was close to a 38%, retrace level (not shown) of the entire move from the peak on 8/5/20, to the 9/29/21 low.
Positioning
The last update detailed how a short position was opened in the miners (not advice, not a recommendation).
At this juncture, price action continues to indicate lower prices ahead.
The short is being maintained.
Stay Tuned
Note: Posts on this site are for education purposes only. They provide one firm’s insight on the markets. Not investment advice. See additional disclaimer here.
To date, there’ve been 232 transactions in the firm’s main trading account.
Each one has its own story.
The big one for now, is shorting the gold miners GDX, via DUST (not advice, not a recommendation).
We’re going to pull out the ‘card catalog’ on that one and take a brief look.
As a reminder, this post identified the breakout target for gold (GLD), months before it actually happened.
Also, in a prior post, it was discovered the miners had 3:1 downside response to recent down moves in gold.
Therefore, at this point in time, using leveraged inverse fund DUST, at -2X, the miners, gives an estimated, 6:1, market exposure.
Short entries were opened (shown below) once the gold market and miners broke to the upside.
Hysteria First
Those who’ve been here a while, already know part of the short set-up, was the necessary hysteria needed to get nearly everyone on the wrong (bullish) side.
Senior Miners, GDX
Just for reference, the daily chart of GDX, is below.
I suppose it must have been from behind enemy lines, with one of the gold updates warning us about archrival, Russia.
As we can see from the price collapse, the Russians must have found our gold bulls. 🙂
Meanwhile, Back At DUST
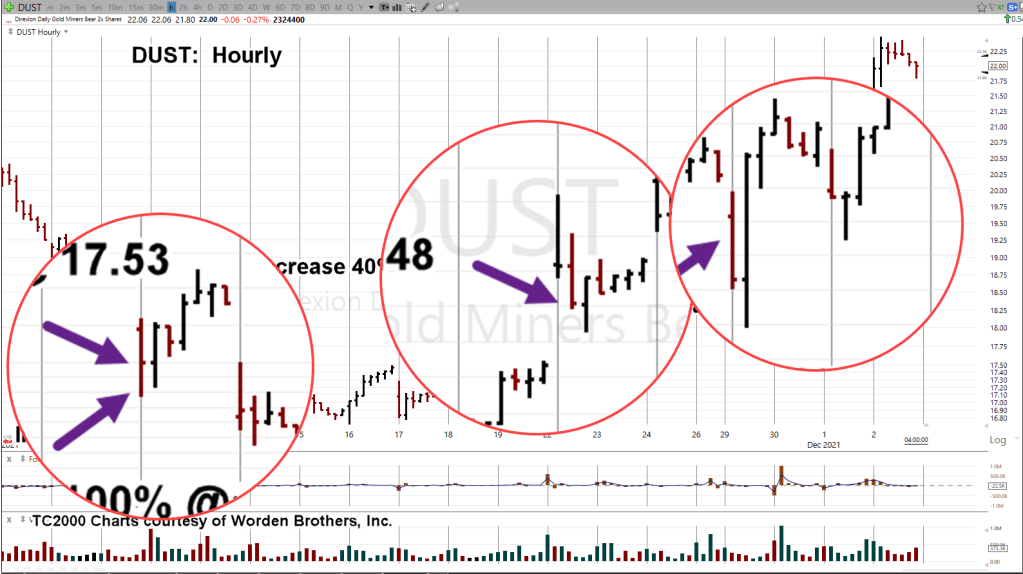
The daily chart of leveraged inverse DUST, shows trade entry locations to date (not advice, not a recommendation).
The hourly chart below, gives a closer look.
The next chart is a zoom-in of the entries.
Positioning in this market for now, is essentially complete.
At this point, it’s time to monitor and track for any potential trend reversal or trendline break.
Early Or Late
Years ago, sometime around late 2007, or early 2008, Robert Prechter Jr., said concerning his trades, he tends to be a little bit early.
That implicitly means he might suffer through adverse action including loss-exit, if action goes counter enough.
There’s no perfect entry. Early or late, take your pick.
Fixing Entry Errors
As can be seen on the hourly chart, every trade entry was on a red (declining price) bar.
The risk is, price action will just keep on going red.
The benefit is a big one; I’m not chasing the market.
If I’m chasing, it means I’m not on my game or I never had a game or worse, a coward that can’t pull the trigger on a trade without more ‘confirmation’.
David Weis covers in his video, how to properly get aboard a market that’s already underway.
After the initial entries, DUST banged around the bottom (GDX at the top) for eight trading days.
In retrospect and looking at the chart, the adverse action was not much lower but it did not feel like it at the time.
Because of the months of planning, there was an inference the size of this reversal would be significant.
So far, it is.
In the process of reversing, price action itself has fixed trade entries made a little too early.
Summary
Future updates will show potential trend and/or channel action as well as Fibonacci time correlation.
At this point, the DUST trade is well underway.
A reasonable stop area would be in the vicinity of DUST 19.37 (not advice not a recommendation).
Stay Tuned
Note: Posts on this site are for education purposes only. They provide one firm’s insight on the markets. Not investment advice. See additional disclaimer here.
As the link above says, it’s almost ‘impossible’ to substitute.
Silver goes into nearly everything electronic.
Depending on whom you believe, the mainstream says the Future’s So Bright … right?
However, the charts say we may be headed much lower.
Remember the silver ‘short-squeeze’ and the little guy putting-it to ‘The Man’?
At this point, the only silver put around is on the little guy.
The Man’s going merrily along; short the sector that was so recently hyped with gold to “$3000 In Months, Not Years”
In Steven Van Metre’s latest update, he said no fewer than three times, the Fed ‘does not print money’.
It’s a false belief (by the public) they’re not about to change.
At the end if his video, he promised a report … or to make accessible his research on how that (not printing) is so.
Bringing us to the market at hand.
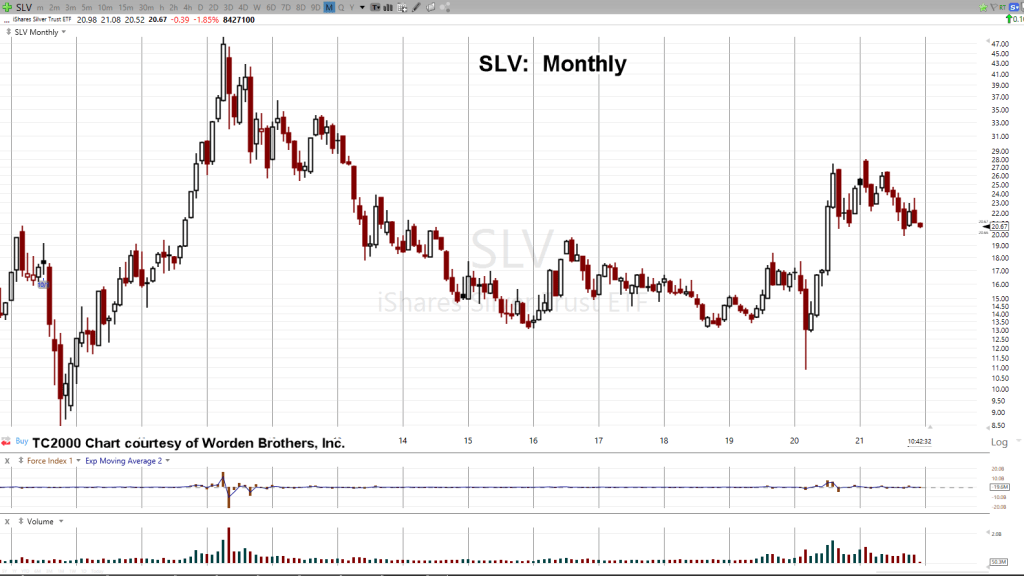
Silver (SLV)
Monthly un-marked chart.
The main thing to note above, SLV, is not at new highs.
In fact, at today’s price, SLV is down over 57%, from its all-time high set in April of 2011.
That in itself, should say there’s something wrong with the inflation, hyper-inflation, narrative.
Using a standard Fibonacci projection tool and tagging the 2011 high, the 2020 low, and the 2021, retrace high, we get the following:
It’s a little hard to see … so we’ll zoom in on the right side.
The 50%, Fibonacci projection, is somewhere between SLV: 9.00, and 9.50.
The premise for declining past 38% (around 13.70) and getting at least to 50%, is predicated on the collapse of the economy and subsequent evaporation of silver demand … at least from an industrial standpoint.
The precious metals ‘stacker’, discussed below, might become more interested in obtaining food than continuing to stockpile something that in times of famine, has very little use.
As Bjorn says in ‘famine’, come this spring, when the masses realize there will be no (or very little) food and/or you need ‘papers’ to buy food, market pandemonium (if not already) is the likely result; precious metals included.
When To ‘Stack’
So, when will be the time to acquire precious metals (not advice not a recommendation).
It’s deceptively simple; ‘When you don’t want to’.
The time to acquire an asset, is when nobody else wants it … including you.
Positioning short the gold miners GDX, was done when everybody and their dog was a manic bull; screaming an upside breakout was “imminent”.
As Prechter said, positioning opposite the herd involves overriding the limbic system of the brain.
It’s an intellectual (logic-only, thinking) process.
However, overriding the lower brain, i.e., going against the herd, is physically painful.
Excruciating, is a better description.
He went on to say, some of the best traders/speculators he ever knew, were former Marines.
Positioning
Coming up (most likely tomorrow) will be a chart showing positions opened in GDX inverse fund DUST (not advice not a recommendation).
There’s no obligation on this site’s part to reveal that information.
However, it will help explain how the market itself directed trading actions.
It will also show how the on-going reversal corrected several entry errors on my part.
Stay Tuned
Note: Posts on this site are for education purposes only. They provide one firm’s insight on the markets. Not investment advice. See additional disclaimer here.
Note: Posts on this site are for education purposes only. They provide one firm’s insight on the markets. Not investment advice. See additional disclaimer here.
Note: Posts on this site are for education purposes only. They provide one firm’s insight on the markets. Not investment advice. See additional disclaimer here.
Adverse moves in gold (GLD) like we have right now, especially after months of incessant hype, puts those who bought into the narrative on the wrong side; stunned, unable to move.
There’s a small chance, this could be a shakeout before going higher. Anything can happen.
However, if we look at the chart of GLD, it’s a grim situation for the bulls.
Gold (GLD)
Daily chart, GLD:
This wasn’t just a one-day push above resistance and then reversal.
GLD, spent a Fibonacci 8-Days struggling to break out before this morning’s collapse.
Stunned bulls may think it’s a buying opportunity. If so, there’s likely to be some kind of underside test of resistance.
However, that’s not guaranteed. Moves like this tend to offer no relief and just grind their way lower.
Positioning:
At this juncture, we’ve got a nasty adverse move; putting the short position (DUST) well in the green (not advice, not a recommendation).
Any upward test of GLD, and the miners, GDX, GDXJ, is likely to reveal new support/resistance boundaries and possibly trend-lines.
If so, we’ll have something to monitor for a potential exit signal.
Note: Posts on this site are for education purposes only. They provide one firm’s insight on the markets. Not investment advice. See additional disclaimer here.
This trade could still fall apart for some unknown reason.
If it looks like the bulls are somehow re-gaining control, it will show up in the price action and we’ll exit accordingly (not advice, not a recommendation).
Stay Tuned
Note: Posts on this site are for education purposes only. They provide one firm’s insight on the markets. Not investment advice. See additional disclaimer here.