Early Session
Or … ‘How To Lose Your Shirt’

If you’re reading this, consider yourself already separated or in the process of separating from the crowd.
At time stamp 5:15, in this from Uneducated Economist, there’s a mind-blowing statement from one of his followers.
UE is posting his thoughts on inflation. That is, there isn’t any … just like what this site proposes.
The commenter asked ‘Why don’t you see it just like everybody else does?’
It’s incredible but very telling on the collective mindset of those who are (or allow themselves to be) easily manipulated.
High School Correlation:
It’s not much different than High School (what a joke that was).
The popular kids seeming to have it all while the nerds, the geeks, and the weirdos were all left out … or bullied.
However, the raw edge of real life is not High School. That’s where the opportunity is for those in the very small minority.
Everybody has an equal chance to grow up.
After (years ago) going to my 10-year High School reunion, I realized the vast majority never grow or challenge themselves in any way.
I could see during the event, more than a few were already alcoholics. Deadening the pain of their cowardice.
As it turned out, I realized that ‘popularity’ is a prison. Locking up the individual in a life of fear (of becoming unpopular) and the associated mediocrity that results.
How does that anecdote relate to the problem at hand … the markets?
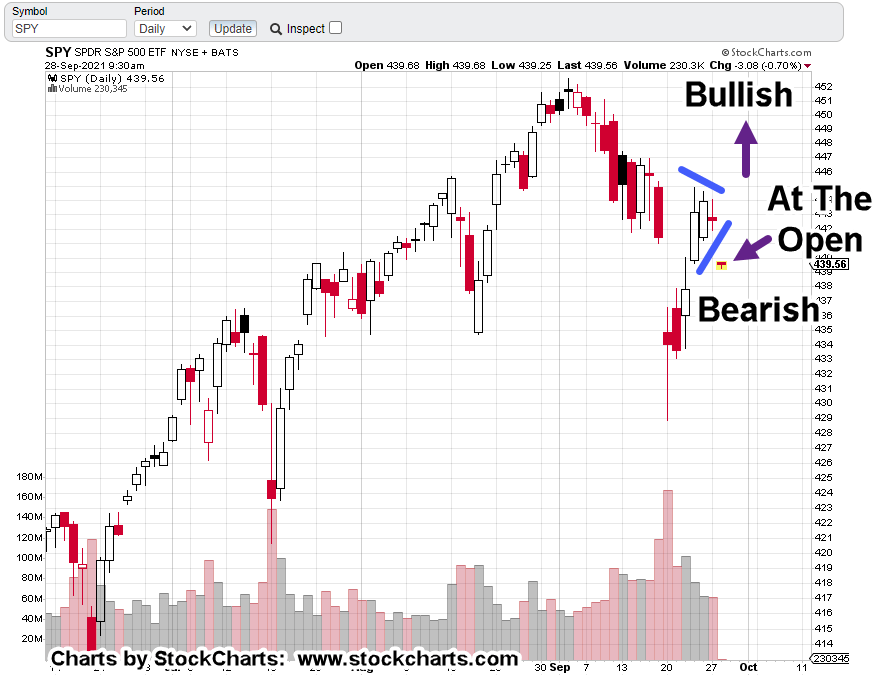
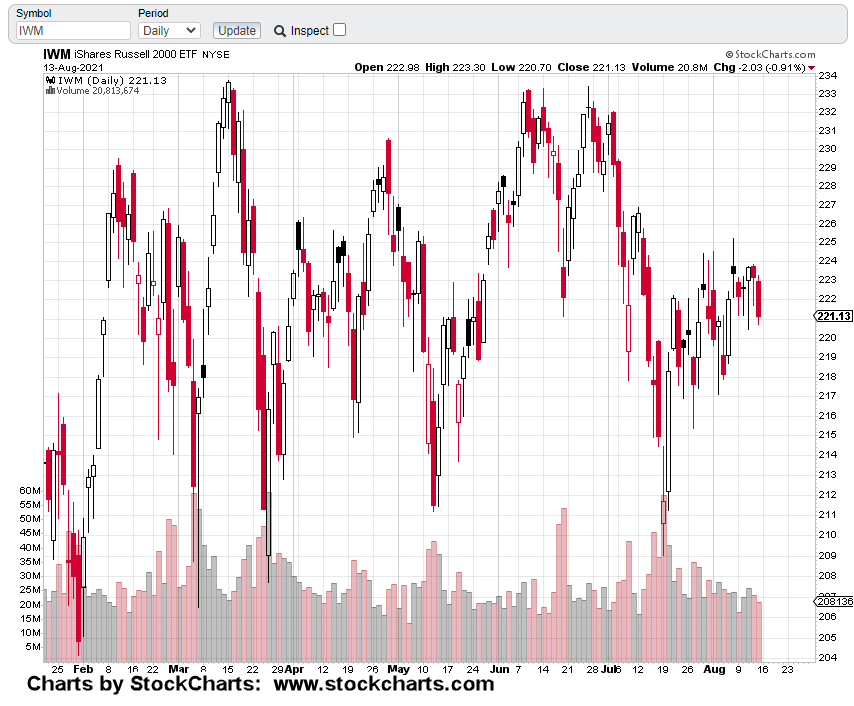
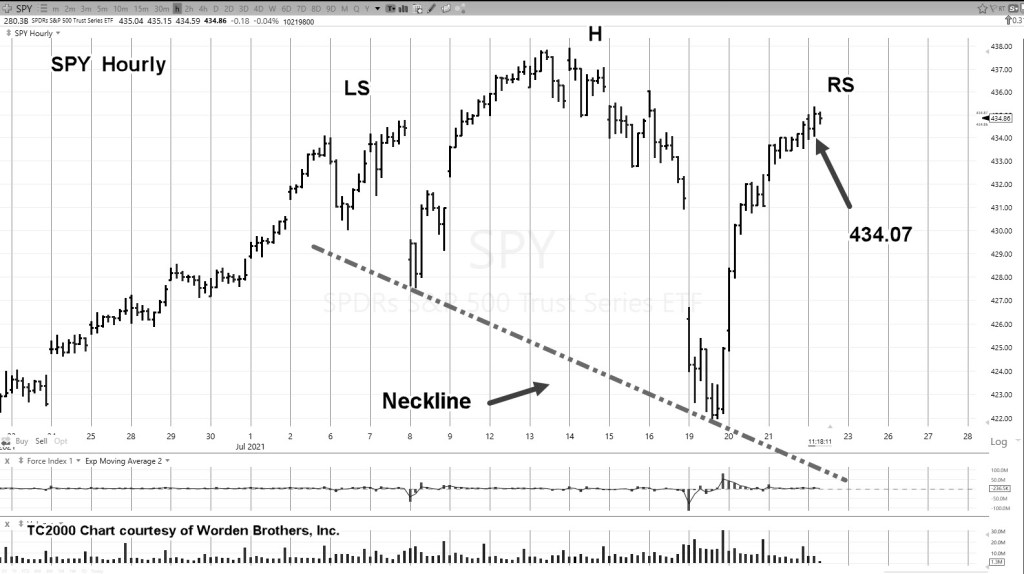
S&P Review:
It’s early in the session and the S&P (SPY), is trading lower.
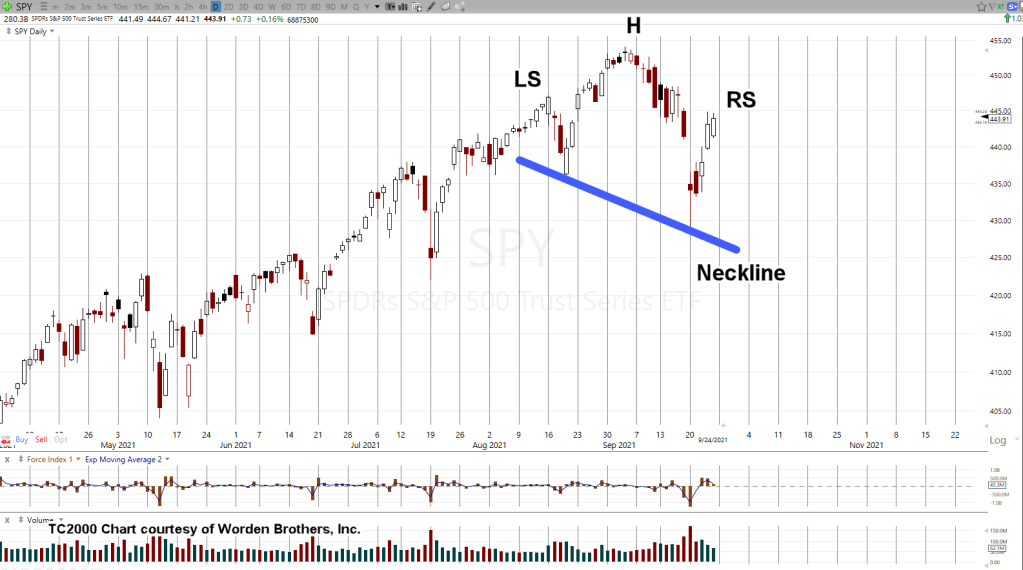
The daily chart shows possible completion of the H&S pattern discussed previously.
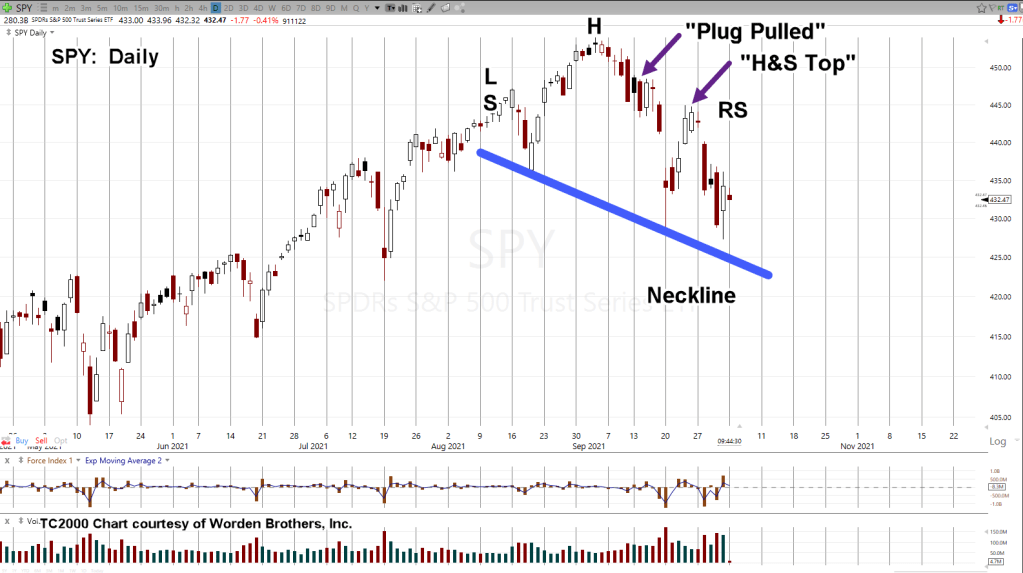
The location of the report “The Plug Has Been Pulled” is also provided for reference.
At the time, it was uncertain and certainly unpopular to suggest the (potential) all time high was in.
So, we’ll see if the SPY, heads lower to start bouncing around the neckline … providing more confirmation of a significant reversal.
Stay Tuned